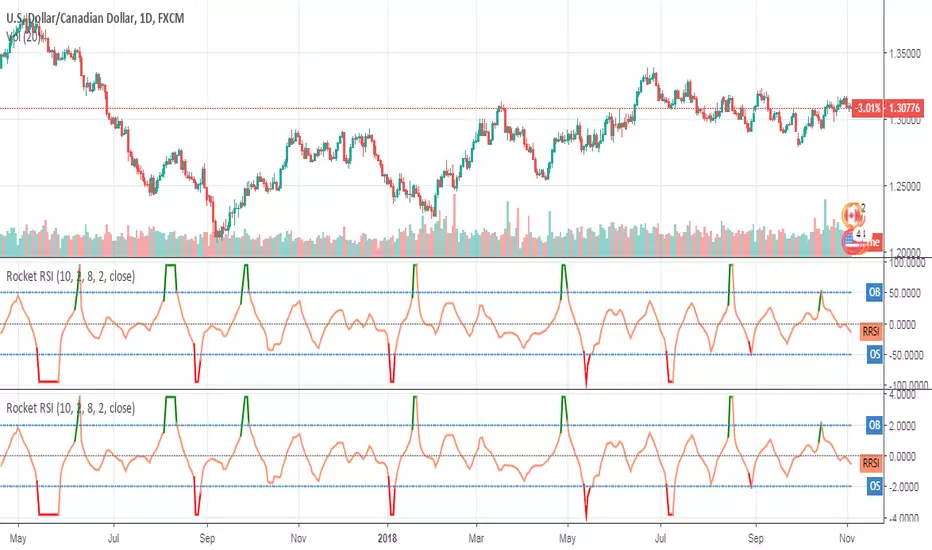
Rocket RSIRocket RSI indicator script. This indicator was originally developed by John Ehlers (Stocks & Commodities V.36:6, RocketRSI - A Solid Propellant For Your Rocket Science Trading).Chỉ báo Pine Script®của evergetCập nhật 88732
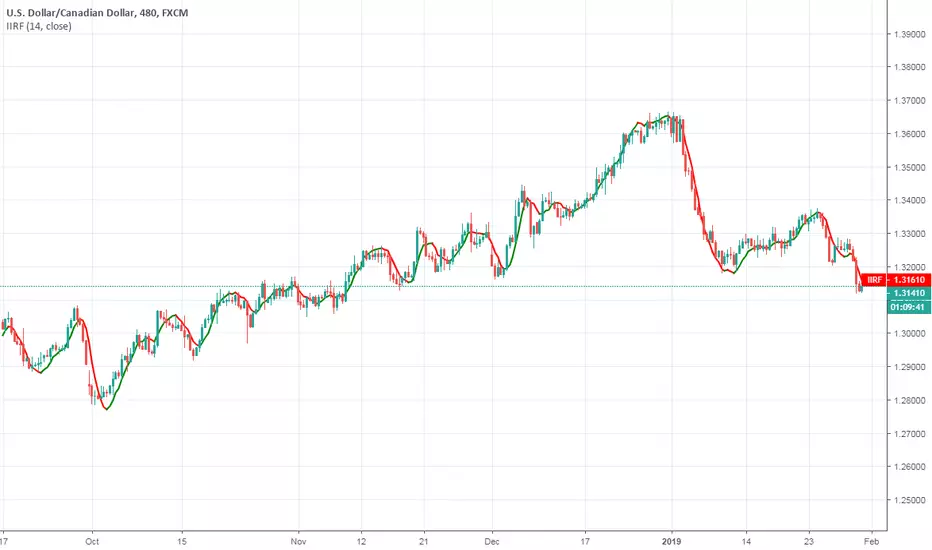
Infinite Impulse Response (IIR) FilterInfinite Impulse Response (IIR) Filter indicator script. This indicator was originally developed by John Ehlers (Stocks & Commodities V. 20:7 (26-31): Zero-Lag Data Smoothers).Chỉ báo Pine Script®của evergetCập nhật 77234
Adaptive Laguerre FilterAdaptive Laguerre Filter indicator script. The Adaptive Laguerre Filter was originally developed and described by John Ehlers in his paper `Time Warp – Without Space Travel`. Thanks to @apozdnyakov for the sorting solution.Chỉ báo Pine Script®của evergetCập nhật 1616589
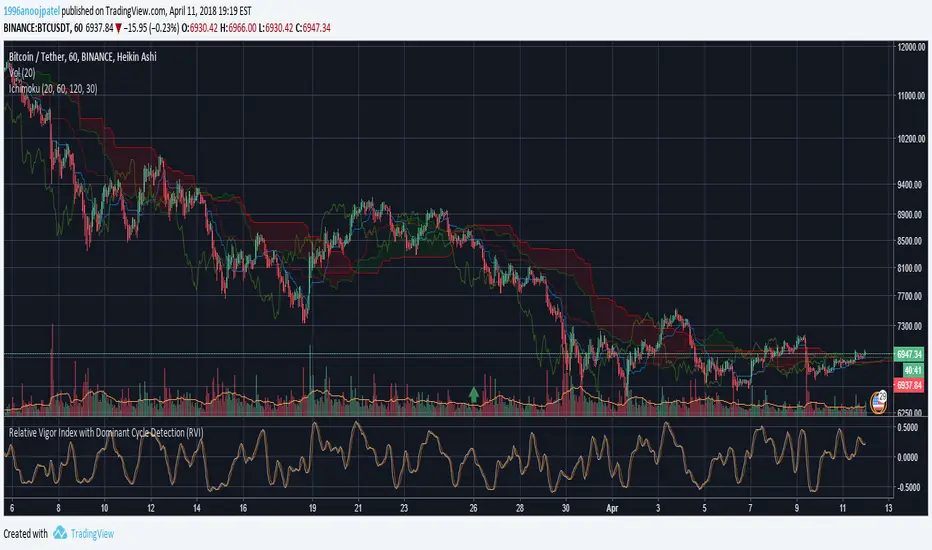
Relative Vigor Index with Dominant Cycle Detection (RVI)Relative Vigor Index with Dominant Cycle Detection. As Ehler's mentioned, fixed length look back is inherently flawed when it is possible to extract a length from a dominant price cycle. may be less effective if signal to noise ratio is greater than 2, but that usually would not happen at >5m candles, and honestly shouldn't be looking at RV(igor)I when price is moving sideways. Read just like an RVGI, but adjusted to the current time frame. To reduce noise, changing to heiken ashi will help with signals as well. Let me know if there are improvements! Made for JD, the OG.Chỉ báo Pine Script®của anoojpatel55340
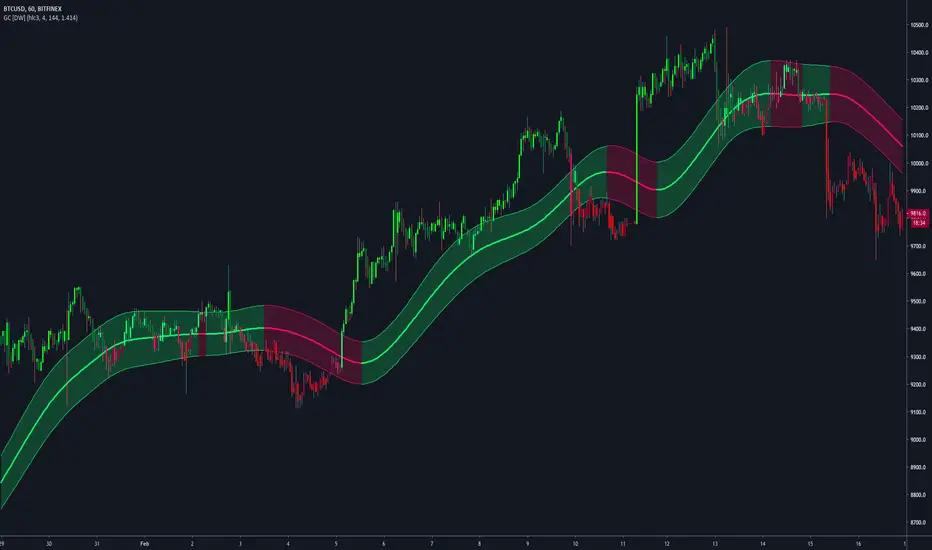
Gaussian Channel [DW]This study is an experiment utilizing the Ehlers Gaussian Filter technique combined with lag reduction techniques and true range to analyze trend activity. Gaussian filters, as Ehlers explains it, are simply exponential moving averages applied multiple times. First, beta and alpha are calculated based on the sampling period and number of poles specified. The maximum number of poles available in this script is 9. Next, the data being analyzed is given a truncation option for reduced lag, which can be enabled with "Reduced Lag Mode". Then the alpha and source values are used to calculate the filter and filtered true range of the dataset. Filtered true range with a specified multiplier is then added to and subtracted from the filter, generating a channel. Lastly, a one pole filter with a N pole alpha is averaged with the filter to generate a faster filter, which can be enabled with "Fast Response Mode". Custom bar colors are included. Note: Both the sampling period and number of poles directly affect how much lag the indicator has, and how smooth the output is. Larger inputs will result in smoother outputs with increased lag, and smaller inputs will have noisier outputs with reduced lag. For the best results, I recommend not setting the sampling period any lower than the number of poles + 1. Going lower truncates the equation.Chỉ báo Pine Script®của DonovanWallCập nhật 6666 7.8 K
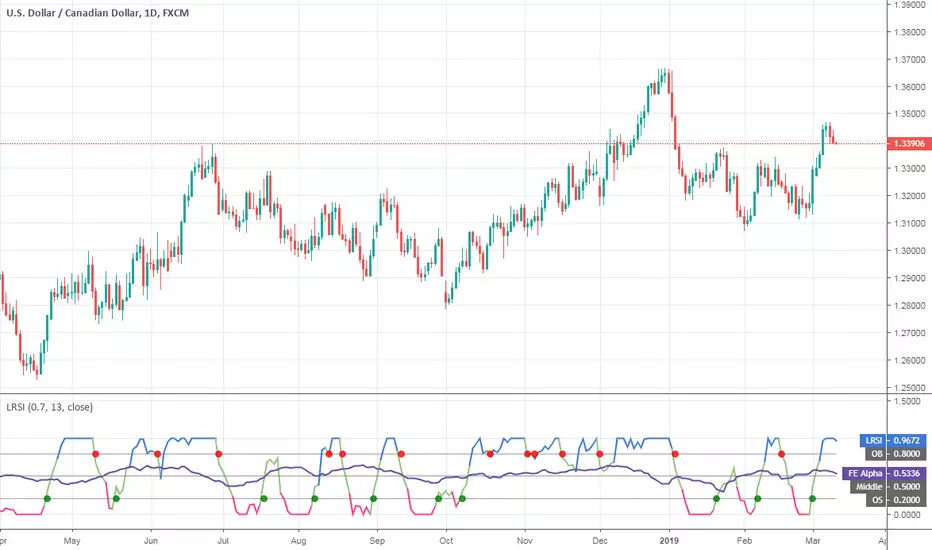
Laguerre RSI (Self Adjusting Alpha with Fractals Energy)Laguerre RSI (Self Adjusting Alpha with Fractals Energy) indicator script. I adopted idea from www.prorealcode.com and If you disable `Apply Fractals Energy` option, you will get the original Laguerre RSI.Chỉ báo Pine Script®của evergetCập nhật 2121 1.4 K
Ehler's Super Smoother strategyThis strategy is a mean-reversal strategy based on John F. Ehlers's Super Smoother filter. I tried it on 15m timeframe with 'Recalculate After Order Filled' option checked. Chiến lược Pine Script®của zoltan.dzooli.fabian22159
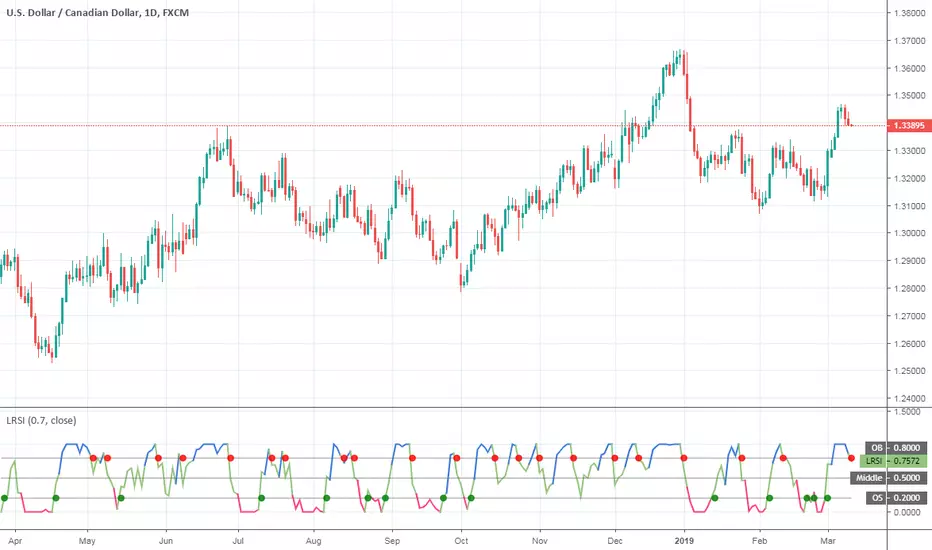
Laguerre RSILaguerre RSI indicator script. This indicator was originally developed by John Ehlers.Chỉ báo Pine Script®của evergetCập nhật 22585
The Perfect RSI (Ehler's Cycle RSI Modified with Discriminator)This is the RSI indicator that I use. It combines two concepts of John Ehler. It integrates the idea of Highpass filtering the Price data, along with the the idea of automatically determining the Dominant price cycle through a Homodyne Discriminator, and using half of a cycle length as the input for the RSI. Not only determines the most effective range for the RSI by setting it based on the cycle, but also makes the RSI PDF(Probability Distribution Function) adjustable as shown in John Ehler's papers. Still needs some tweaking on determining the best calculations for cycles, and whether or not to better filter the price data into the discriminator. Works just like a normal RSI, but should have less false signals, and also has the option for super smoothing. Play around it and see if theres any new indications or signals that come from it ;) Let me know if there's any concerns or additions!Chỉ báo Pine Script®của anoojpatel1010768
Moving Average Bundle3 Moving Average Lines. All parameters are configurable via user input. Each of these moving average lines already exist as individual indicators in TradingView. This script just bundles them for one stop shopping. It's helpful if you're limited by the number of indicators per chart. And highly educational: quickly compare the different averaging methods! sma: Simple Moving Average rma: Recursive Moving Average ema: Exponential Moving Average wma: Weighted Moving Average vma: Volume Weighted Moving Average wma: Weighted Moving Average alma: Arnaud Legoux Moving Average Note: Only Pine built-in functions are included. Chỉ báo Pine Script®của brobearCập nhật 44239
CG Oscillator (Center of Gravity)CG Oscillator indicator script. This indicator was originally developed by John Ehlers.Chỉ báo Pine Script®của evergetCập nhật 224
Normalized Relative Vigor IndexThis is the Relative Vigor Index indicator just multiplied by 100 to have non-zero integer partChỉ báo Pine Script®của evergetCập nhật 55271
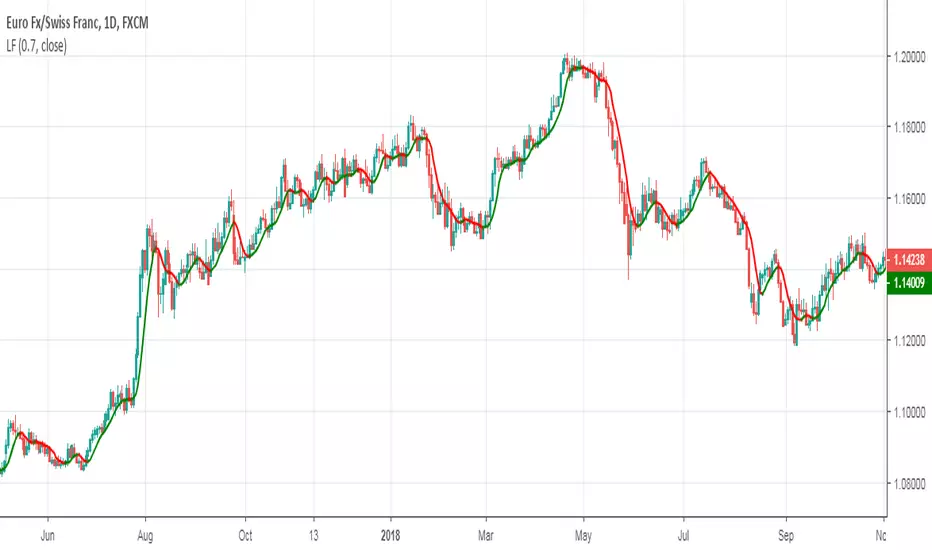
Laguerre FilterLaguerre Filter indicator based on the John Ehler's article "Time Warp – Without Space Travel" about the Laguerre TransformChỉ báo Pine Script®của evergetCập nhật 33326
Ehlers Early Onset Trend With Buy/Sell signalsSlight modification of Ehlers Early Onset Trend Chỉ báo Pine Script®của QuantXORCập nhật 22219
Fisher Transform Ribbons Indicator V1.0Utilizing the Fisher Transform by Ehlers with different lengths based on multipliers will allow you to notice movements in price and understand whether the shift was a correctional wave, or part of the overall trend. To learn about Fisher Transform , check out the Fisher Transform documentation: www.mesasoftware.com Fisher has plenty of functionalities. Ribbons provides you with a view of consistency in price action. If all ribbons flip, generally this is a strong signal that the trend is changing. Fisher is extremely punctual (minimum input lag) and robust (doesn't miss movement). Look for everything, including divergences, trends, and Oversold, Overbought points. Changing length will further provide you more sensitivity in overselling and buying, while numbing chop. Enjoy! And for a single Fisher, check out HPotter's Fisher Transform or LazyBear's implementation of the inverse of the Fisher, which has many other interesting properties Chỉ báo Pine Script®của anoojpatel66487
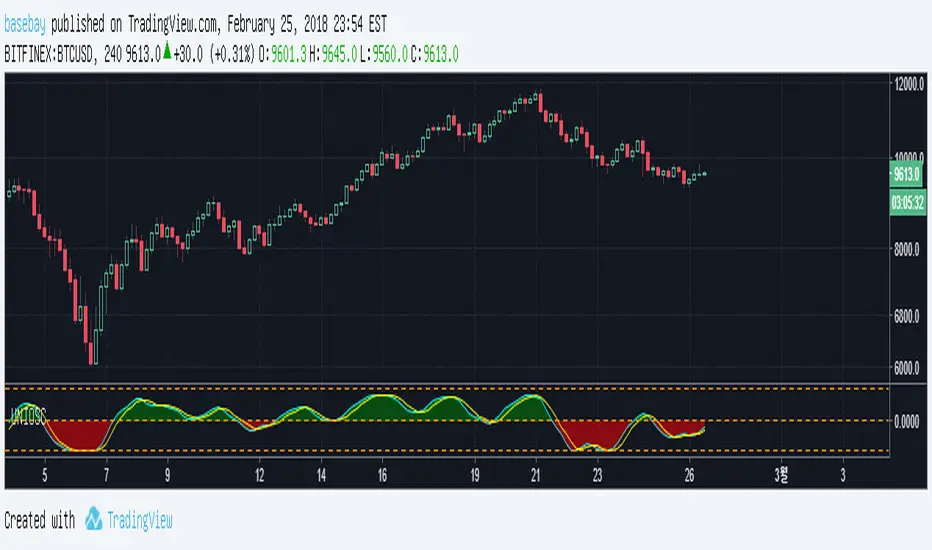
Universal Oscillator by John EhlersOriginal idea from Lazybear's script. I changed value degree to radian in TradingView And I added values ( hline : 1 and -1 ) It is important value from John Ehlers's article. If I have mistake you comment me.Chỉ báo Pine Script®của basebay2272
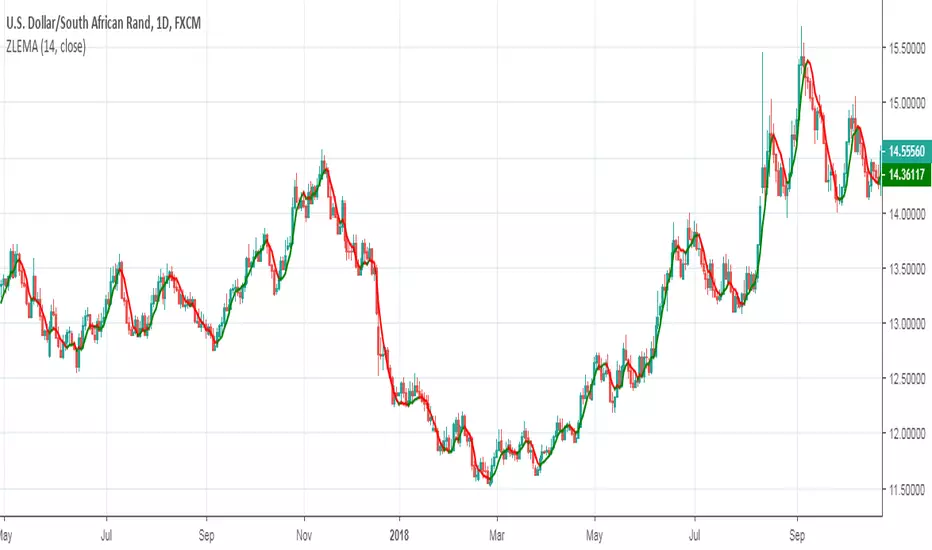
Zero Lag Exponential Moving AverageZero Lag Exponential Moving Average indicator script based on the original version by John Ehlers and Ric WayChỉ báo Pine Script®của evergetCập nhật 1717 1.2 K
Universal Oscillator by John EhlersUniversal Oscillator by John EhlersChỉ báo Pine Script®của basebayCập nhật 52
Fractal Adaptive Moving AverageFractal Adaptive Moving Average indicator scriptChỉ báo Pine Script®của evergetCập nhật 398
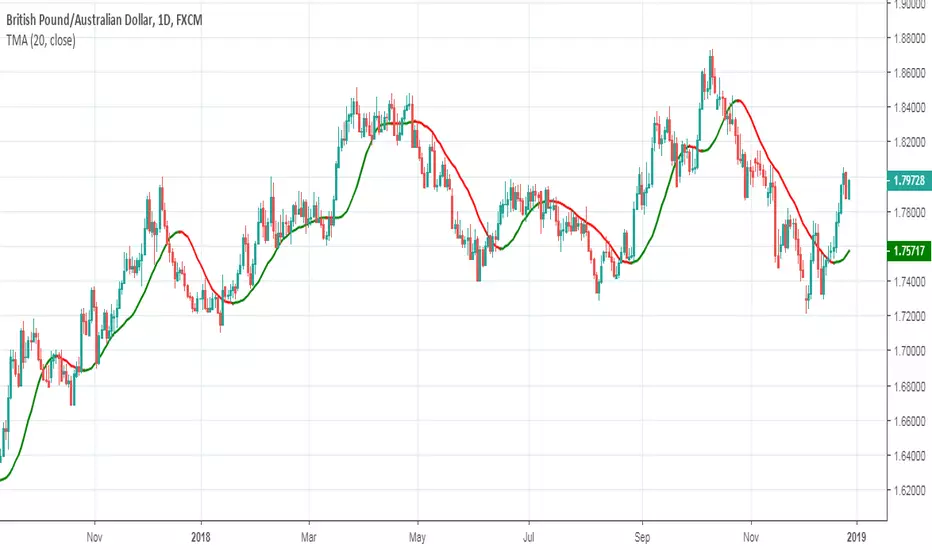
Triangular Moving AverageTriangular Moving Average indicator scriptChỉ báo Pine Script®của evergetCập nhật 1010715
Inverse Fisher Transform COMBO STO+RSI+CCIv2 by KIVANÇ fr3762A combined 3in1 version of pre shared INVERSE FISHER TRANSFORM indicators on RSI , on STOCHASTIC and on CCIv2 to provide space for 2 more indicators for users... About John EHLERS: From California, USA, John is a veteran trader. With 35 years trading experience he has seen it all. John has an engineering background that led to his technical approach to trading ignoring fundamental analysis (with one important exception). John strongly believes in cycles. He’d rather exit a trade when the cycle ends or a new one starts. He uses the MESA principle to make predictions about cycles in the market and trades one hundred percent automatically. In the show John reveals: • What is more appropriate than trading individual stocks • The one thing he relies upon in his approach to the market • The detail surrounding his unique trading style • What important thing underpins the market and gives every trader an edge About INVERSE FISHER TRANSFORM: The purpose of technical indicators is to help with your timing decisions to buy or sell. Hopefully, the signals are clear and unequivocal. However, more often than not your decision to pull the trigger is accompanied by crossing your fingers. Even if you have placed only a few trades you know the drill. In this article I will show you a way to make your oscillator-type indicators make clear black-or-white indication of the time to buy or sell. I will do this by using the Inverse Fisher Transform to alter the Probability Distribution Function ( PDF ) of your indicators. In the past12 I have noted that the PDF of price and indicators do not have a Gaussian, or Normal, probability distribution. A Gaussian PDF is the familiar bell-shaped curve where the long “tails” mean that wide deviations from the mean occur with relatively low probability. The Fisher Transform can be applied to almost any normalized data set to make the resulting PDF nearly Gaussian, with the result that the turning points are sharply peaked and easy to identify. The Fisher Transform is defined by the equation 1) Whereas the Fisher Transform is expansive, the Inverse Fisher Transform is compressive. The Inverse Fisher Transform is found by solving equation 1 for x in terms of y. The Inverse Fisher Transform is: 2) The transfer response of the Inverse Fisher Transform is shown in Figure 1. If the input falls between –0.5 and +0.5, the output is nearly the same as the input. For larger absolute values (say, larger than 2), the output is compressed to be no larger than unity . The result of using the Inverse Fisher Transform is that the output has a very high probability of being either +1 or –1. This bipolar probability distribution makes the Inverse Fisher Transform ideal for generating an indicator that provides clear buy and sell signals. Creator: John EHLERSChỉ báo Pine Script®của KivancOzbilgicCập nhật 2929 6.2 K
Zero Lag EMA v2 by KIVANÇ fr3762A different version of ZERO LAG EMA indicator by John Ehlers and Ric Way... In this cover, Zero Lag EMA is calculated without using the PREV function. The main purpose is that to provide BUY/SELL signals earlier than classical EMA's. You can see the difference of conventional and Zero Lag EMA in the chart. The red line is classical EMA and the blue colored line is ZEMA ( Zero Lag Ema ). Turkish Explanation: Ehlers ve Way'in ZERO LAG ,ndikatörünün Prev (previous value) kullanılmadan yorumlanarak hesaplanmış hali. Amaç klasik Üssel Ortalamaya göre daha hızlı tepki verip, Al/Sat sinyallerini daha erken alabilmek. Grafikte kırmızı renkle görülen normal Üssel HO ve mavi renkli olan Zero Lag (gecikmesiz) Üssel HO Chỉ báo Pine Script®của KivancOzbilgic1111 2.4 K
Super Smoothed MACD for STOCKS by KIVANÇ fr3762THIS INDICATOR IS DESIGNED USING EHLERS' SUPER SMOOTHER FILTER DESIGNED FOR STOCKS (another version available for CRYPTO TRADE: Super Smoothed MACD for CRYPTO by KIVANÇ fr3762) Instead of EXPONENTIAL MOVING AVERAGES in traditional MACD calculation, Super Smoothed prices are used. The default values of BAND EDGE's (periods) of these Super Smoothed Prices are 13,8, and 3 (Fibonacci numbers) which pretty work well for daily trade users can change these values 13,8,5 or 21,13,5 or 21,13,8 and so on to have optimum trade productivityChỉ báo Pine Script®của KivancOzbilgic1212 3.1 K