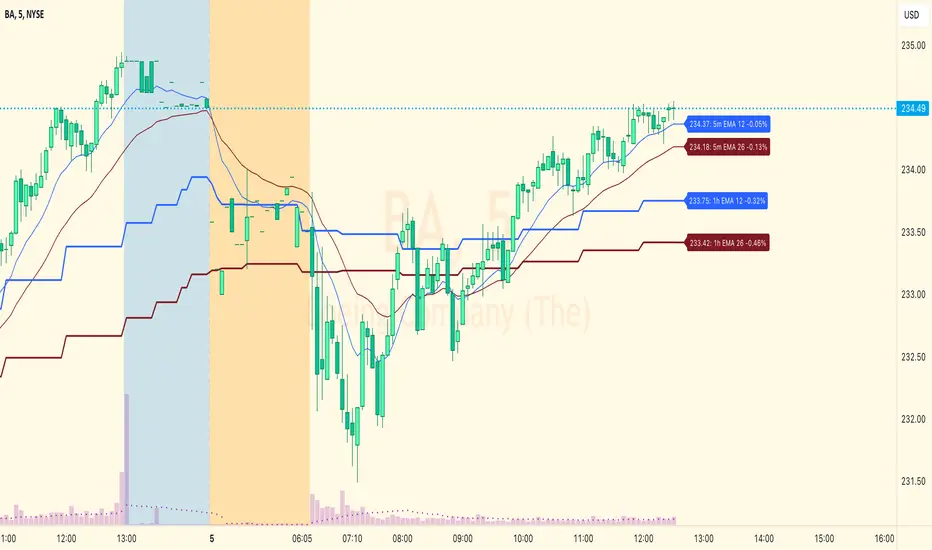
EMA Levels, Multi-TimeframeThe exponential moving average (EMA) tracks price over time, giving more importance to recent price data than simple moving average (SMA). EMAs for larger timeframes are generally considered to be stronger supports/resistances for price to move through than smaller timeframes. This indicator allows you to specify two different EMA lengths that you want to track. Additionally, this indicator allows you to display not just the EMA levels of your currently viewed timeframe on the chart, but also shows the EMA levels of up to 4 different timeframes on the same chart. This allows you to quickly see if multiple EMA levels are aligning across different timeframes, which is an even stronger indication that price is going to meet support or resistance when it meets those levels on the chart. There are a lot of nice configuration options, like:
Ability to customize the EMA lengths you want to track
Style customization (color, thickness, size)
Hide any timeframes/levels you aren't interested in
Labels on the chart so you can tell which plots are the EMA levels
Optionally display the plot as a horizontal line if all you care about is the EMA level right now
Đường Trung bình trượt Hàm mũ (EMA)
3 Moving Average Exponential with multi TFThis is a simple Exponential Moving Average indicator. It allows you to have 3 Exponential Moving Averages and set a specific TimeFrame for each. Feel free to cope code LOL!

Price Action [Morty]This price action indicator uses the higher timeframe SSL channel to identify trends.
The long entry signal is a bullish candlestick pattern when the price retraces to EMA20 in an uptrend.
The short entry signal is a bearish candlestick pattern when the price retraces to the EMA20 in a downrend.
Currently, this indicator shows engulfing patterns, pin bar patterns, 2 bar reversal patterns and harami patterns.
It also shows a volatility squeeze signal when the Bollinger bands is within the Kelter channels.
The buy and sell signal can also be filter by the ADX indicator greater than a threshold.
You can set your stoploss to the previous low/high when you go long/short.
The risk/reward ratio could be 1 to 1.5.
This indicator can be used in any market.

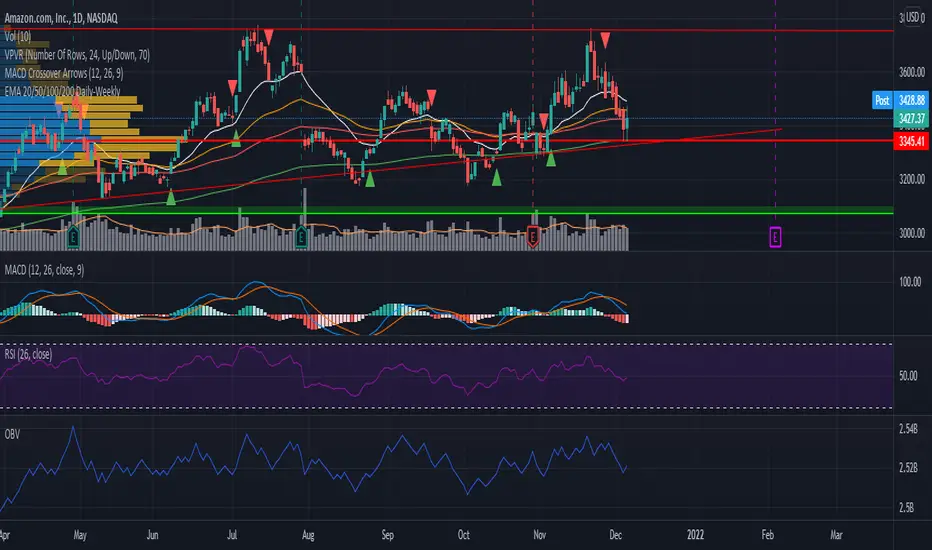
EMA 20/50/100/200 Daily-WeeklyHello!
In case this helps others when using EMA's on multiple timeframes, I decided to publish this script I modified.
It adds the EMA for 20/50/100/200 timeframes and gives them the color white, orange, red, green respectively.
The weekly timeframe will get the corresponding weekly EMA.
The monthly timeframe will get the corresponding monthly EMA.
The daily timeframe, and all timeframes below this, will get the daily timeframe. The idea that that a ticker symbol might respect with strength the daily EMA's - you'll be able to move to a smaller timeframe and still view the daily EMA's in an effort to better view how close the ticker came to taking a specific EMA.
Média 8, 21, 56, 200 SEMANAL - Augusto BackesFique tranquilo, aqui tem todas as médias que o Backes utiliza dentro de um indicador só, aproveite :)

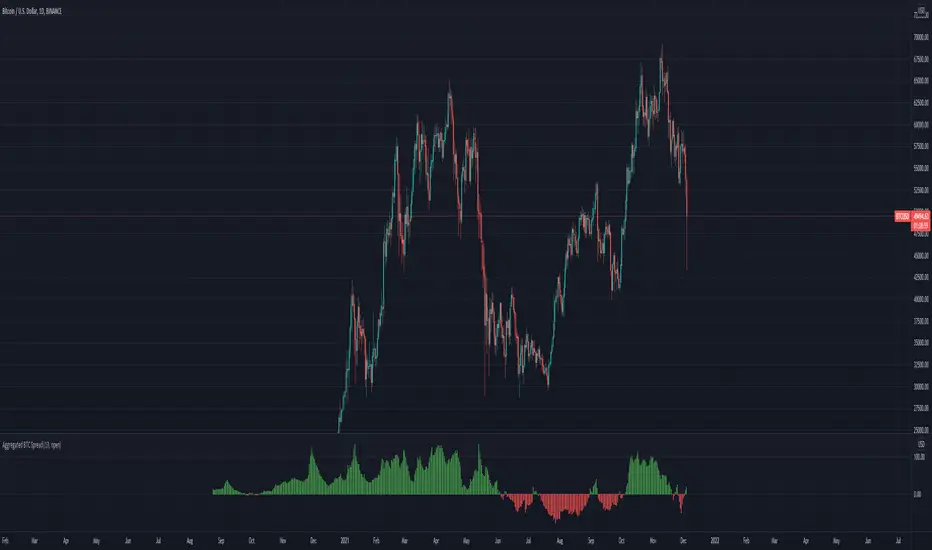
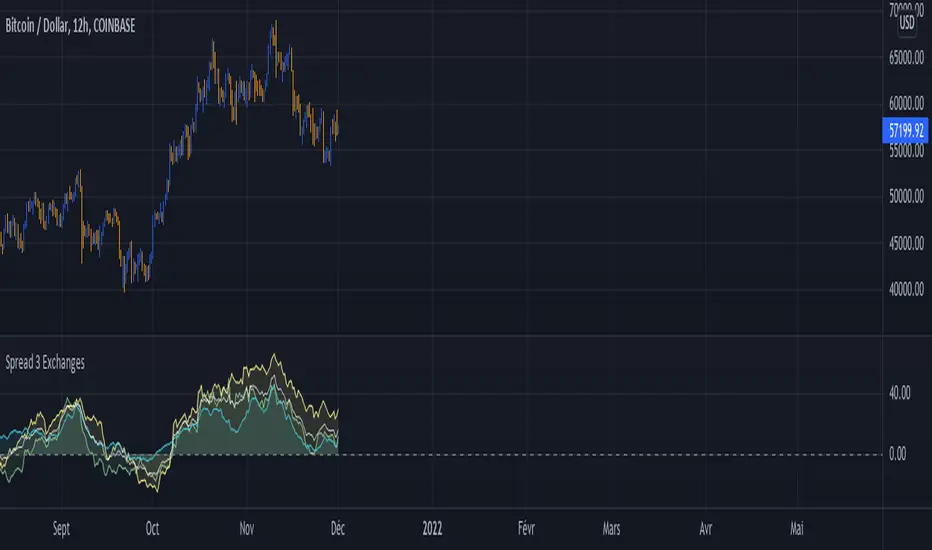
Aggregated BTC SpreadThis script is used to aggregate the bitcoin spread on futures contracts on different platforms.
It works by averaging the for every selected exchange, and apply an EMA of .
It is supporting
Binance (USD / USDT)
Okex
FTX
Huobi
Deribit
Ascendex
CME (BTC1!)
Cloud Ribbon ++ by [JohnnySnow]Inspired by my favorite EMA ribbon - "EMA Ribbon " by fskrypt.
This Ribbon ADD the option to choose the avarage algorithm of the ribbon .
Created also to be more friendly to read along with trendlines and Fibonacci retracements.
For those like me that NOT use this ribbon to find exact price action but instead, to have a grasp of possible Support/Resistance strenght ahead.
High transparency lines and a configurable color palette for filling the background give the ribbon a look of support/ Resistance cloud Strenght.
Each MA length, line, and background color can be easily configured.

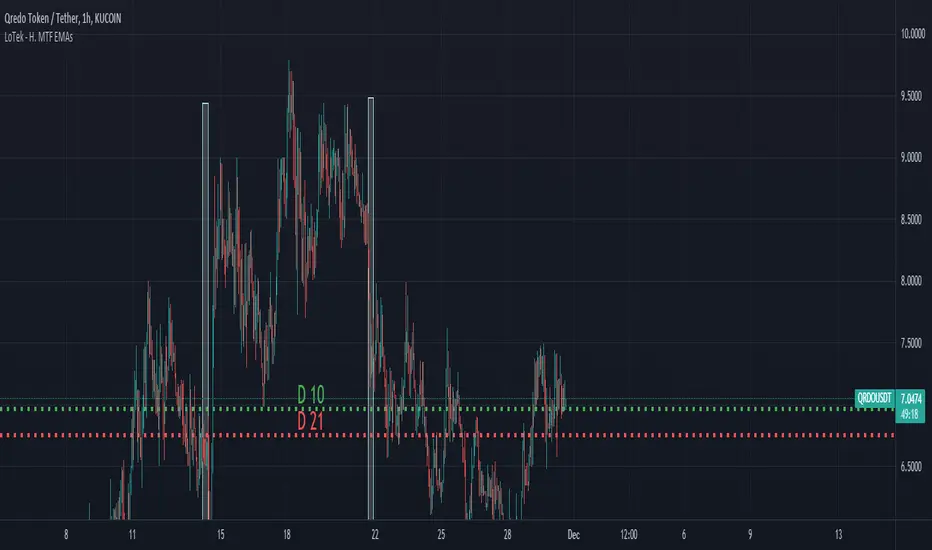
LoTek - Horizontal Multi Time-Frame EMAsThis script retrieves user definable EMA values from different timeframes and plots a Horizontal Line on the chart for the corresponding timeframe. Labels are switchable as well. This can help you identify an EMA squeeze on lower time frames quickly. In this image, I'm viewing QRDO on 1HR and can tell that the price is just above the D10.
Indicator Functions with Factor and HeikinAshiHello all,
This indicator returns below selected indicators values with entered parameters.
Also you can add factorization, functions candles, function HeikinAshi and more to the plot.
VERSION:
Version 1: returns series only source and Length with already defined default values
Version 2: returns series with source, Length, p1 and p2 parameters according to the indicator definition (ex: )
PARAMETERS p1 p2
for defining multi arguments (See indicators list) indicator input value usable with verison=V2 selected.. ex: for alma( src , len ,offset=0.85,sigma=6), set source=source, len=length, p1=0.85 an p2=6
FACTOR:
Add double triple, Quadruple factors to selected indicator (like converting EMA to 2-DEMA, 3-TEMA, 4-QEMA...)
1-Original
2-Double
3-Triple
4-Quadruple
LOG
Log: Use log, log10 on function entries
PLOTTING:
PType: Plotting type of the function on the screen
Original :use original values
Org. Range (-1,1): usable for indicators between range -1 and 1
Stochastic: Convert indicator values by using stochastic calculation between -1 & 1. (use AT/% length to better view)
PercentRank: Convert indicator values by using Percent Rank calculation between -1 & 1. (use AT/% length to better view)
ST/%: length for plotting Type for stochastic and Percent Rank options
Smooth: Use SWMA for smoothing the function
DISPLAY TYPES
Plot Candles: Display the selected indicator as candle by implementing values
Plot Ind: Display result of indicator with selected source
HeikinAshi: Display Selected indicator candles with Heikin Ashi calculation
INDICATOR LIST:
hide = 'DONT DISPLAY', //Dont display & calculate the indicator. (For my framework usage)
alma = 'alma( src , len ,offset=0.85,sigma=6)', // Arnaud Legoux Moving Average
ama = 'ama( src , len ,fast=14,slow=100)', //Adjusted Moving Average
acdst = 'accdist()', // Accumulation/distribution index.
cma = 'cma( src , len )', //Corrective Moving average
dema = 'dema( src , len )', // Double EMA (Same as EMA with 2 factor)
ema = 'ema( src , len )', // Exponential Moving Average
gmma = 'gmma( src , len )', //Geometric Mean Moving Average
hghst = 'highest( src , len )', //Highest value for a given number of bars back.
hl2ma = 'hl2ma( src , len )', //higest lowest moving average
hma = 'hma( src , len )', // Hull Moving Average .
lgAdt = 'lagAdapt( src , len ,perclen=5,fperc=50)', //Ehler's Adaptive Laguerre filter
lgAdV = 'lagAdaptV( src , len ,perclen=5,fperc=50)', //Ehler's Adaptive Laguerre filter variation
lguer = 'laguerre( src , len )', //Ehler's Laguerre filter
lsrcp = 'lesrcp( src , len )', //lowest exponential esrcpanding moving line
lexp = 'lexp( src , len )', //lowest exponential expanding moving line
linrg = 'linreg( src , len ,loffset=1)', // Linear regression
lowst = 'lowest( src , len )', //Lovest value for a given number of bars back.
pcnl = 'percntl( src , len )', //percentile nearest rank. Calculates percentile using method of Nearest Rank.
pcnli = 'percntli( src , len )', //percentile linear interpolation. Calculates percentile using method of linear interpolation between the two nearest ranks.
rema = 'rema( src , len )', //Range EMA (REMA)
rma = 'rma( src , len )', //Moving average used in RSI . It is the exponentially weighted moving average with alpha = 1 / length.
sma = 'sma( src , len )', // Smoothed Moving Average
smma = 'smma( src , len )', // Smoothed Moving Average
supr2 = 'super2( src , len )', //Ehler's super smoother, 2 pole
supr3 = 'super3( src , len )', //Ehler's super smoother, 3 pole
strnd = 'supertrend( src , len ,period=3)', //Supertrend indicator
swma = 'swma( src , len )', //Sine-Weighted Moving Average
tema = 'tema( src , len )', // Triple EMA (Same as EMA with 3 factor)
tma = 'tma( src , len )', //Triangular Moving Average
vida = 'vida( src , len )', // Variable Index Dynamic Average
vwma = 'vwma( src , len )', // Volume Weigted Moving Average
wma = 'wma( src , len )', //Weigted Moving Average
angle = 'angle( src , len )', //angle of the series (Use its Input as another indicator output)
atr = 'atr( src , len )', // average true range . RMA of true range.
bbr = 'bbr( src , len ,mult=1)', // bollinger %%
bbw = 'bbw( src , len ,mult=2)', // Bollinger Bands Width . The Bollinger Band Width is the difference between the upper and the lower Bollinger Bands divided by the middle band.
cci = 'cci( src , len )', // commodity channel index
cctbb = 'cctbbo( src , len )', // CCT Bollinger Band Oscilator
chng = 'change( src , len )', //Difference between current value and previous, source - source.
cmo = 'cmo( src , len )', // Chande Momentum Oscillator . Calculates the difference between the sum of recent gains and the sum of recent losses and then divides the result by the sum of all price movement over the same period.
cog = 'cog( src , len )', //The cog (center of gravity ) is an indicator based on statistics and the Fibonacci golden ratio.
cpcrv = 'copcurve( src , len )', // Coppock Curve. was originally developed by Edwin "Sedge" Coppock (Barron's Magazine, October 1962).
corrl = 'correl( src , len )', // Correlation coefficient . Describes the degree to which two series tend to deviate from their ta. sma values.
count = 'count( src , len )', //green avg - red avg
dev = 'dev( src , len )', //ta.dev() Measure of difference between the series and it's ta. sma
fall = 'falling( src , len )', //ta.falling() Test if the `source` series is now falling for `length` bars long. (Use its Input as another indicator output)
kcr = 'kcr( src , len ,mult=2)', // Keltner Channels Range
kcw = 'kcw( src , len ,mult=2)', //ta.kcw(). Keltner Channels Width. The Keltner Channels Width is the difference between the upper and the lower Keltner Channels divided by the middle channel.
macd = 'macd( src , len )', // macd
mfi = 'mfi( src , len )', // Money Flow Index
nvi = 'nvi()', // Negative Volume Index
obv = 'obv()', // On Balance Volume
pvi = 'pvi()', // Positive Volume Index
pvt = 'pvt()', // Price Volume Trend
rise = 'rising( src , len )', //ta.rising() Test if the `source` series is now rising for `length` bars long. (Use its Input as another indicator output)
roc = 'roc( src , len )', // Rate of Change
rsi = 'rsi( src , len )', // Relative strength Index
smosc = 'smi_osc( src , len ,fast=5, slow=34)', //smi Oscillator
smsig = 'smi_sig( src , len ,fast=5, slow=34)', //smi Signal
stdev = 'stdev( src , len )', //Standart deviation
trix = 'trix( src , len )' , //the rate of change of a triple exponentially smoothed moving average .
tsi = 'tsi( src , len )', //True Strength Index
vari = 'variance( src , len )', //ta.variance(). Variance is the expectation of the squared deviation of a series from its mean (ta. sma ), and it informally measures how far a set of numbers are spread out from their mean.
wilpc = 'willprc( src , len )', // Williams %R
wad = 'wad()', // Williams Accumulation/Distribution .
wvad = 'wvad()' //Williams Variable Accumulation/Distribution
I will update the indicator list when I will update the library
Thanks to tradingview, @RodrigoKazuma for their open source indicators

+ Donchian ChannelsThis version of Donchian Channels uses two source options so that one can create a channel using highs and lows rather than one or the other or closes. My thinking was that this would create a more accurate portrayal of price action (or at least contain the greatest scope of it) as seen through the lens of a Donchian Channel. This was actually part of the genesis of my idea around my Ultimate Moving Average.
Besides the single top and bottom plot for the DC's extremities, I've enabled the ability to create outer bands with a variable width that the user can adjust to their preference. I think it's quite nice. I use it in the DC in my other non-overlay indicators.
Besides this additional functionality, the indicator has options to plot lines between the basis and the upper and lower bands, so, basically, splitting the upper and lower channel in half.
There is no magic number to the lookback. I chose 233 as default because it's a fibonacci sequence number and I'm more interested in using the DC like a very long period bias indicator, and the longer lookback gives a much wider window (because highs and lows are so spread apart) with which other faster indicators (supertrend, shorter period moving averages, etc.) can work without making the screen a clutter.
The color of the basis may also be made relevant to higher timeframe information. What I mean by this is that you can set it so that the basis of the current timeframe is colored based on the candle close of the higher timeframe of your choosing. If you're looking at an hourly chart, and you set the color to Daily, the basis will be colored based on the candle close (above or below the basis) of the previous day. If the previous daily close was above the basis, that positive color will be reflected in the basis, even if the current hourly candle closes are below the hourly basis. This could potentially be useful for setting a higher timeframe directional bias and reacting off price crossing the lower timeframe basis (or whatever your trigger for entering a trade might be). This is also optional in my Ultimate Moving Average indicator.
You can also set the entire indicator to whatever time frame you want if you want to see where the actual basis, or other levels are on that higher timeframe.
Further additions include fibonacci retracement levels. These are calculated off the high and the low of the Donchian Channels themselves.
You will see that there are only three retracement levels (.786, .705, .382), one of which is not a fib level, but what some people call the 'OTE,' or optimal trade entry. If you want more info on the OTE just web search it. So, why no .618 or .236? Reason being that the .618 overlaps the .382, and the .236 is extremely close to the .786. This sounds confusing, but the retracement levels I'm using are derived from the high and low, so it was unnecessary to have all five levels from each. I could have just calculated from the high, or just from the low, and used all the levels, but I chose to just calculate three levels from the high and three from the low because that gives a sort of mirror image balance, and that appeals to me, and the utility of the indicator is the same.
The plot lines are all colored, and I've filled certain zones between them. There is a center zone filled between both .382 levels, and an upper and lower zone filled between the .786 and either the high or the low.
If you like the colored zones, but don't like the plots because they cause screen compression, turn off the plots under the "style" tab.
There are alerts for candle closes across every line.
I should state that, regarding the fibs, obviously the length of the Channels is going to affect to what levels price retraces to. A shorter lookback means you will see more changes in highs and lows, and therefore retraces are often going to be full retraces within the bands unless price is trending hard. A longer lookback means you will see smaller retraces. Using this in conjunction with key high timeframe levels and/or a moving average can give great confidence in a trade entry. Additionally, if you have a short bias it may help in finding levels or entering a trade on a pullback. It could also be good for trade targets. But again, the lookback you choose for this indicator is going to dictate its use in the system you're building or already have. A 9 EMA and a 200 EMA, while fundamentally the same, are going to be used somewhat differently while doing your chart analysis.
Additional images below.
Same image as main, but with supertrend and my +UMA to help with chart analysis.
Image with the fib stuff turned on.
Zoomed out image with the same.
Shorter lookback period.
Zoomed in image of shorter lookback.

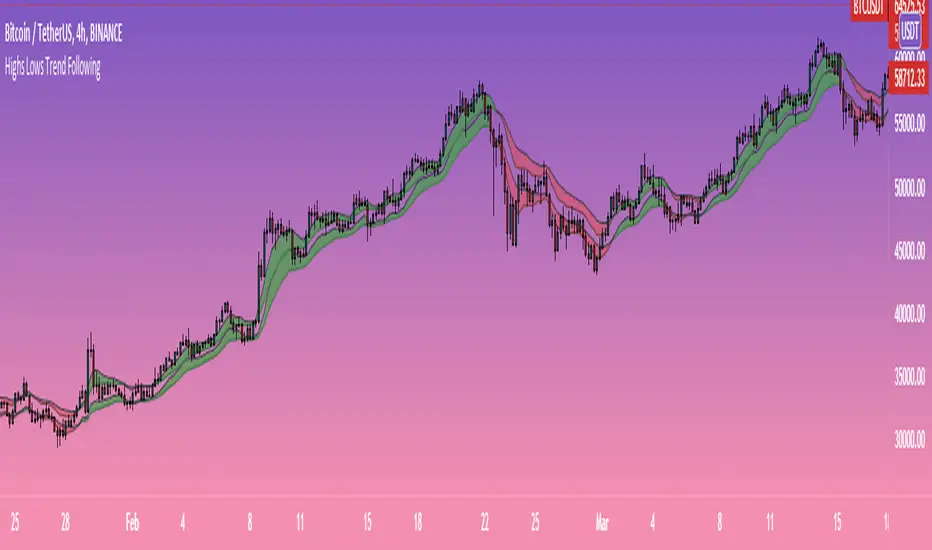
Highs-Lows Bands Trend FollowingTwo bands formed by moving averages of highs and lows.
The lower band should provide zone of support in uptrends while the upper band should provide zone of resistance during downtrends.
Bands that turn green in bullish trends should provide buy signals while bands that turn red in bearish trends should provide sell signals.
EneX SignalEneX is signal that give recommendation signals for entry and exit on spot market. This indicators not suitable for leverage trading in futures market.
EneX signal consider several indicators and has entry and exit rules.
EneX signal is suitable for investors who believe in trend following strategy (disclaimer on).
This script composed by Yohan Naftali for educational purpose only. Reader who will use this signal must do own research.
Indicator and Plot Involved
1. Williams Fractals with default periods = 2
2. William Alligator Indicators with default simple moving average 8, 13, and 21
3. Exponential Moving Averages with default value EMA 50, 100, and 200
4. Relative Strength Index with default overbought level = 80 and oversold level = 20
5. Williams Fractals are joined to create support and resistance line and fill area between support and resistance lines.
Entry signal conditions
1. Entry on Weakness when bullish fractal appear on n/2 period
2. Entry when price break resistance line
All entry condition must above EMA and alligator signal and not in overbought RSI
Exit signal conditions
1. Lowest price is below Exponential Moving Average
2. Lowest price is below William alligator lines
You can easily find entry and exit points by using Entry (E), Exit(X) signals
How to use
1. Monitor chart and wait until E or X signals
2. Entry if Entry Signal (E) appear (green colored label)
3. Exit if Exit Signal (X) appear (red colored label)
4. Change indicators setting when necessary
Best Practice
1. Entry only when entry signal (E) appear
2. Never entry when price below William alligator signal
3. Exit when exit signal (X) appear
4. Not exit when exit signal appear when you believe or you have information that price will be rebound
5. Exit if you believe that current price meet your target price
6. Always wise when use EneX signals
Disclaimer
Do your own research and consider fundamental price of asset.
The indicators provided on this script is for educational purposes only.
Author does not offer advisory or brokerage services, nor does it recommend or advise users to buy or sell particular stocks or securities.
Please examined script and give feedback for further improvement.

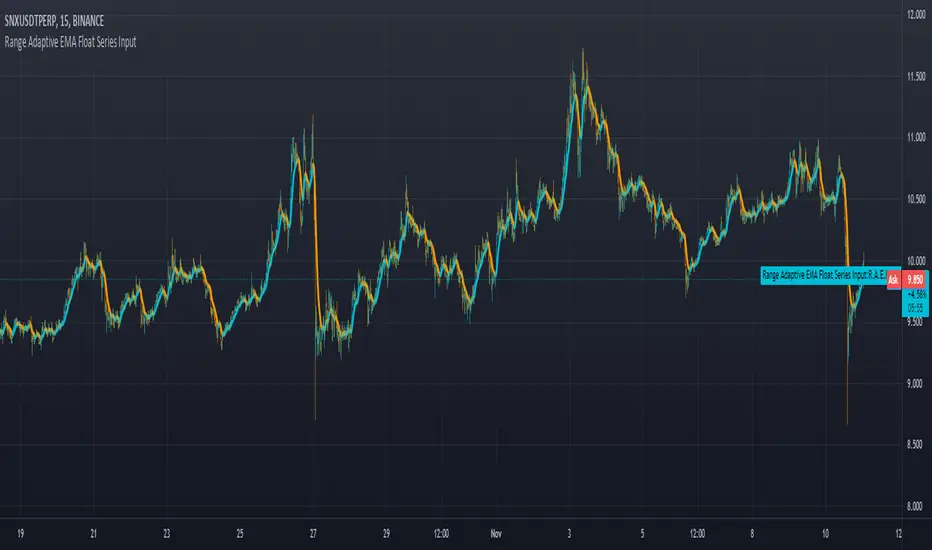
Range Adaptive EMA Float Series Inputuses range and change distance on arrays to allow for more control as well as any choice of input value as a controller for how tightly it grips the input signal.
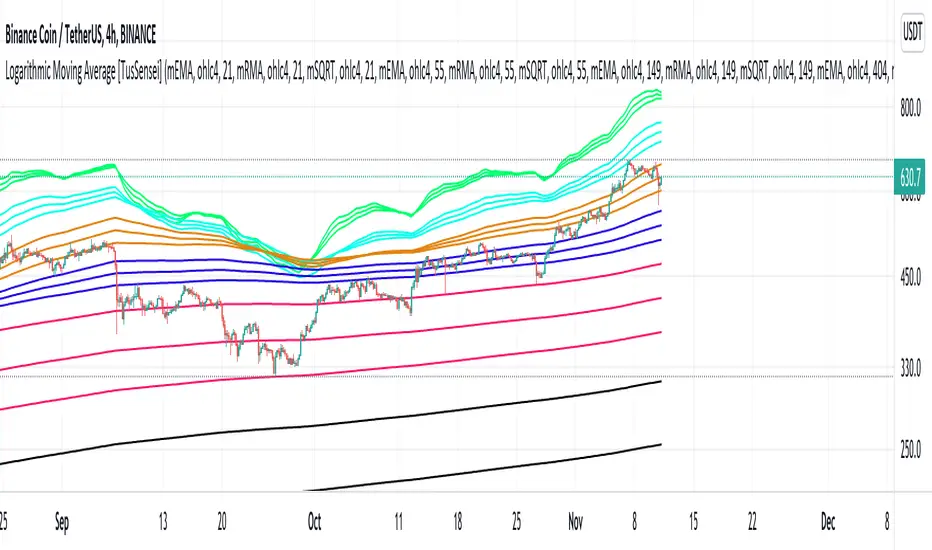
Logarithmic Moving Average [TusSensei]Logarithmic moving averages involve mathematical modification of classical moving averages(EMA-RMA-SMA). Logarithmic modified averages deviate high over short time periods. For long time periods, it behaves exactly like the original moving averages. Its basic formulation is (MovingAverage x (1 + (1 / log(length))).
The most important reason for the operability of logarithmic moving averages is the time periods they use. The values used are 21-55-149-404-1098-2981. These numbers are the consecutive powers of the number "e", which is the base of the natural logarithm (rounded up to an integer).
In this script you will also see another moving average called SQRT. This moving average is equal to the square root of the product of the EMA and the RMA. In other words, it is a moving average that is the geometric mean of two averages. In this script, you can use all of the EMA-RMA-SQRT and SMA averages in the classical and modified way. For formulaic modification, it is sufficient to select "mEMA", "mRMA" forms from the setting section.
Thanks everyone!

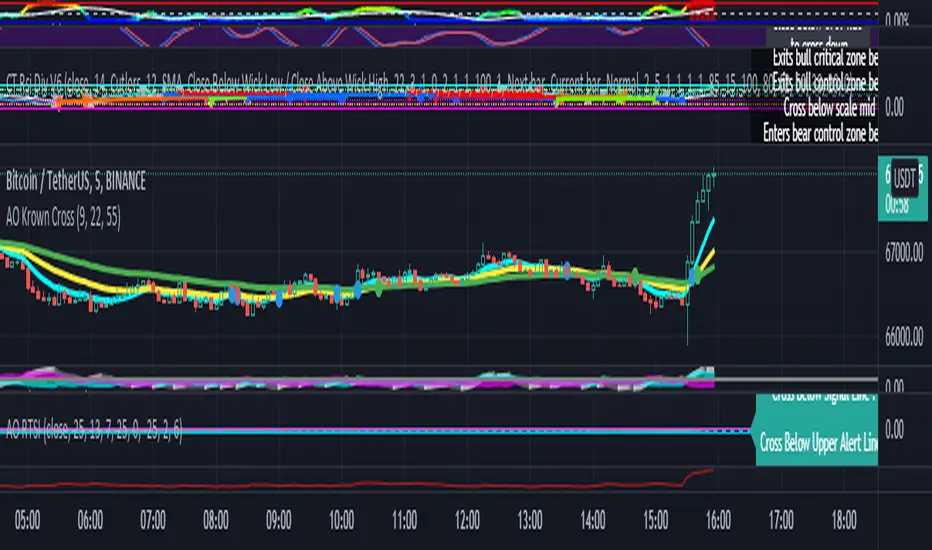
AO Krown Cross
This is a simple script to add alerts to 3 EMA's ie 9,21,55 based on the Krowns Cross Strategy
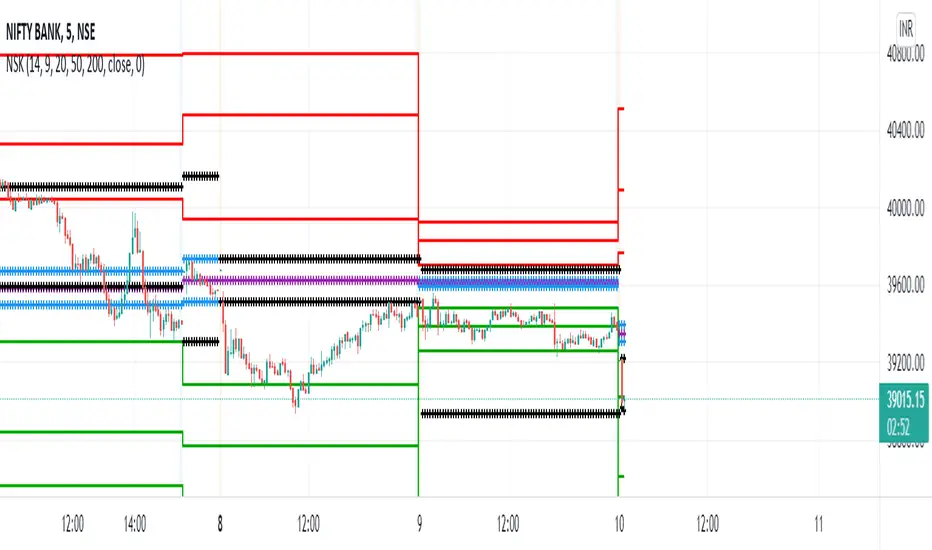
NSK CRPIndicator Daily CPR, daily/weekly/monthly Pivot points, daily/weekly/monthly high and low and EMA for self use prepared by picking up stuff from collaborators here. Thanks for the community.
BBW EMA RIBBON+BB%B+EMA BUY/SELL SignalsBINANCE:BTCUSDT
* * * TESTED ON BTCUSDT 4H CHART * * *
The indicator gives signals based on possible ENTRY/EXIT zones (calculated using an ema ribbon of the BBW) and BB%B oversold/overbought conditions, also a 200 EMA filter is used to trade following the major trend.
ENTRY/EXIT zones can be used as a confirmation on other strategies (green zones suggest a possible entry for a long in an uptrend and for a short in a downtrend, red zones suggest a possible exit for long & short)
Only LONG signals are given.
Signals are divided in 3 categories based on their strenght:
- Weak BUY/SELL (green/red circles on chart)
- normal BUY/SELL (green/red triangles with "BUY" or "SELL" text on chart)
- strong BUY/SELL (green/red labels with "STRONG BUY" or "STRONG SELL" text on chart)
You can use signals from the same category as triggers for entering or exiting a trade or you can try using signals from different categories
All indicators settings can be costumized
Possible EXTRY/EXIT zones can be turned ON/OFF
Every signal label can be turned ON/OFF
EMA that changes color based on last candle close can be turned ON/OFF
Alerts can be set for:
- General Signals (every signal will trigger it)
- Weak Signals (only weak signals will trigger it)
- Normal Signals (only normal signals will trigger it)
- Strong Signals (only strong signals will trigger it)
There are 3 BB%B Oversold & 3 BB%B Overbought value presets:
- BASIC (default values)
- LOW (slightly lower values from default)
- HIGH (slightly higher values from default)
Tips:
Use BB%B OS LOW preset to find entries at a better price
Use BB%B OS HIGH preset to find entries faster
Use BB%B OB LOW preset to find exits faster
Use BB%B OB HIGH preset to find exits at a better price
There are 3 Filters already included:
- A checkbox to toggle ON/OFF the use of Heikin Ashi candels to detect trades
- A checkbox to toggle ON/OFF the use of an ema filter for the ribbon that tries to reduce the number of false signals on over-extended price movements
- A checkbox to toggle ON/OFF the use of an ema filter that tries to reduce the number of false signals when price crosses the moving average many times consecutively

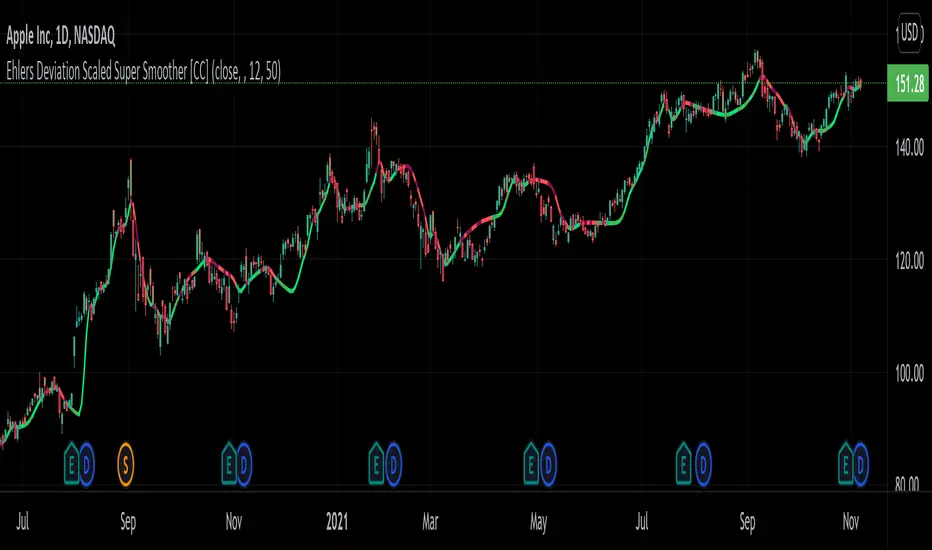
Ehlers Deviation Scaled Super Smoother [CC]The Deviation Scaled Super Smoother was created by John Ehlers and this is an excellent moving average that changes direction very quickly and can keep up with the current underlying trend. This indicator works by applying a Hann Windowed Moving Average to the stock's momentum and scaling that by the Root Mean Square and then using that value in the input for a Super Smoother . I have included strong buy and sell signals in addition to normal ones so lighter colors are normal signals and darker colors are strong ones. Buy when the line turns green and sell when it turns red.
Let me know if there are any other scripts you would like to see me publish!
BB+RSI+EMA BUY/SELL SignalsBINANCE:BTCUSDT
* * * TESTED ON BTCUSDT 4H CHART * * *
The indicator gives signals based on candles touching BB lines and RSI oversold/overbought conditions, also a 200 EMA filter is used to trade following the major trend.
Only LONG signals are given.
Signals are divided in 3 categories based on their strenght:
- Weak BUY/SELL (green/red circles on chart)
- normal BUY/SELL (green/red triangles with "BUY" or "SELL" text on chart)
- strong BUY/SELL (green/red labels with "STRONG BUY" or "STRONG SELL" text on chart)
You can use signals from the same category as triggers for entering or exiting a trade or you can try using signals from different categories
All indicators settings can be costumized
Every signal label can be turned ON/OFF
EMA that changes color based on last candle close can be turned ON/OFF
Alerts can be set for:
- General Signals (every signal will trigger it)
- Weak Signals (only weak signals will trigger it)
- Normal Signals (only normal signals will trigger it)
- Strong Signals (only strong signals will trigger it)

CDC ActionZone Multi-TF,Mult-Ticker with alert() [P-O-Concept]This is proof-of-concept for using single screen displaying triggering signal of multiple stock/crypto
This source code is subject to the terms of the Mozilla Public License 2.0 at mozilla.org
1. Original CDC Action Zone v3 2020 by © piriya33
Source of original indicator :
2. Table concept/part of code is pulled from Portfolio Tracker
***************************************************************************
CDC Action Zone is based on a simple EMA crossover between EMA12 and EMA26
The zones are defined by the relative position of price in relation to the two EMA lines
Different zones can be use to activate / deactivate other trading strategies
The strategy can also be used on its own with acceptable result, buy on the first green candle
and sell on the first red candle
***************************************************************************
Hint Color Meaning :
Green = FastMA > SlowMA and Price is above FastMA
Blue = FastMA < SlowMA and Price is above both MA
LightBlue = FastMA < SlowMA and Price is between both MA
Red = FastMA < SlowMA and Price is below FastMA
Orange = FastMA > SlowMA and Price is below both MA
Yellow = FastMA > SlowMA and Price is between both MA
Blue/LightBlue/Orange/Yellow should be used with another indicator (such as divergent or so)
Cautions:
- This indicator is not meant to be used as "Signal" or "Trading System"
- This indicator provide a quick-glimpse to multiple ticker in same screen. You'll still have to see indications using original CDC Action Zone (If you're using with CDC System), or combining with another indicator (For shorter tf or scalping, or short/long cover)
- Up to 10 Tickers / Timeframe + Current ticker
Alert Creation Guideline
If this indicator will be used as alert. The timeframe for ticker should be set to "same as" the chart you're using, ie, to set alert on 4h, it should be created in 4h-timeframe (Alert is fired on bar close, using 1D-TABLE in 4H-CHART may trigger alert up to 6 times. else if using in 4H-TABLE in 1D-CHART the alert may not trigger at all)
Considering using ohlc4, hlc3, hl2 for market with no session
PS. Send me a message if you see any bug. (especially if using JSON, I have no chance to test with multiple alert at same tick.)
