SPX Fair Value Bands V2An updated version of the SPX Fair Value Bands script from dharmatech and based on the net liquidity concept by MaxJAnderson .
Now with full customization of parameters through the settings (Dialog Box) and allowing the options to the use of
1) Standard Bands based on Offsets of the Fair Value
2) Bollinger Bands
3) Keltner Channels
to better capture buy/sell areas rather than relying on noisy unreliably (and unevenly) updated data from the Treasury/Fed.
==================================
Net Liquidity's importance in the new post-COVID QE to QT regime as described MaxJAnderson
----------------
" In past cycles, size of Fed's balance sheet changed a lot, while TGA and RRP changed relatively little. So size of balance sheet roughly equated Net Liquidity.
(The Treasury General Account) TGA and (Reverse Repo) RRP didn't matter. They were rounding errors by comparison.
But starting in 2020, relative changes in TGA and RRP have been THREE TIMES LARGER than the change in size of the Fed's balance sheet. As result, changes in TGA and RRP have taken over as the primary drivers Net Liquidity.
This is new, and changes the game significantly. Again - the size of the Fed's balance sheet doesn't matter.
What matters is the portion of it that's available to circulate in the economy (Net Liquidity).
And ever since 2020, the Treasury and Reverse Repo have become what controls that. Not the size of Fed's balance sheet.
----------------
The idea that follows is simple,short when $SPX reaches extreme levels of overvaluation, and close out when SPX returns to being undervalued. Here's the formulas I currently use to determine fair value:
Fair Value = (Fed Bal Sheet - TGA - RRP)/1.1 - 1625
And here's the trading rules I currently follow:
Short when diff of $SPX - Fair Value > 350
Close when diff of $SPX - Fair Value < 150
When one of these rules is triggered upon market close on a given day, trades are entered at open of the following day "
Fed

Fed Net Liquidity Indicator v2Updated script for jlb05013's original Fed Net Liquidity Indicator. TradingView was bringing in the FRED data in different units than they used to. This code fixes it.
This indicator aims to present a "Net Liquidity" indicator comprised of the Fed Balance sheet , less the TGA account and Overnight Reverse REPO agreements.
Net Liquidity = Fed Balance Sheet - ( TGA + Reverse REPO)
This is an overlay that can be added to stock or other charts (like SPY ) to see how the market may appear correlated to Net Liquidity - injection of liquidity into the markets.
This was hypothesized by Max Anderson, this is just a script realizing that posting.
New updates include a resolution feature, and an option to offset backwards by 2 days per original intent.

Fed Funds Rate ProjectionsThis script makes projections via drawing boxes based upon changes in the fed funds rate (FRED:EFFR).
It works by turning the change in the fed funds rate into a user defined percentage (using a multiplier, by default a 1% rate of change implies a 10% change in the chart) and then drawing a box that distance away depending on the direction of the rate of change.
The size of the multiplier should depend on the duration of the asset which this is being applied to, for example, a long duration asset such as a high beta growth stock should use a larger multiplier.

Fed Net Liquidity IndicatorThis indicator aims to present a "Net Liquidity" indicator comprised of the Fed Balance sheet , less the TGA account and Overnight Reverse REPO agreements.
Net Liquidity = Fed Balance Sheet - ( TGA + Reverse REPO)
This is an overlay that can be added to stock or other charts (like SPY ) to see how the market may appear correlated to Net Liquidity - injection of liquidity into the markets.
This was hypothesized by Max Anderson, this is just a script realizing that posting.
New updates include a resolution feature, and an option to offset backwards by 2 days per original intent.

FOMC AnnouncementsThis indicator plots vertical lines at the scheduled times of US Federal Reserve's FOMC Meeting Announcements. Usually, that time or the 24 hours before and after could see big moves in markets. You can change those dates and times in the settings, and could use the indicator option "Add this indicator to entire layout" if you want to easily reflect that across all panes of a layout. Those lines will show on any symbol you switch to, saving you time and effort of drawing them manually.

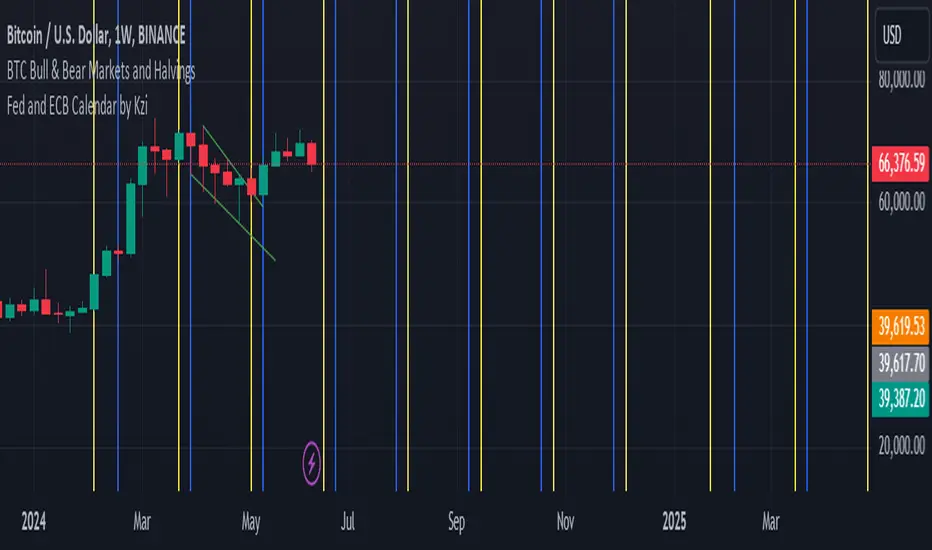
Fed and ECB Calendar by KziHello traders,
Here is a script that i've done for testing the timestamp and the input.time fonction.
You can see verticals lines blue and yellow.
The blue are the ECB meeting date (7 dates)
The yellow are the FED meeting date. (10 Dates)
// In the parameter you can enter the next rolling month date for ECB and FED
// I don't figure out how to add label / Txt on the lines
// And be carreful i don't put the real hours of the meeting.
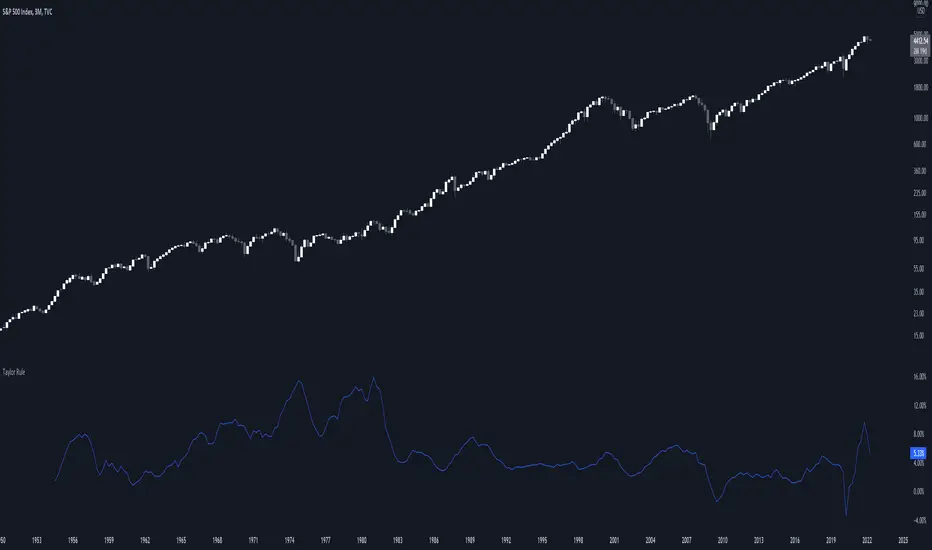
Taylor RuleThe Taylor rule is a simple formula that John Taylor devised to guide policymakers. It calculates what the federal funds rate should be, as a function of the output gap and current inflation. Here, we measure the output gap as the difference between potential output and real GDP. Inflation is measured by changes in the CPI, and we use a target inflation rate of 2%. We also assume a steady-state real interest rate of 2%.
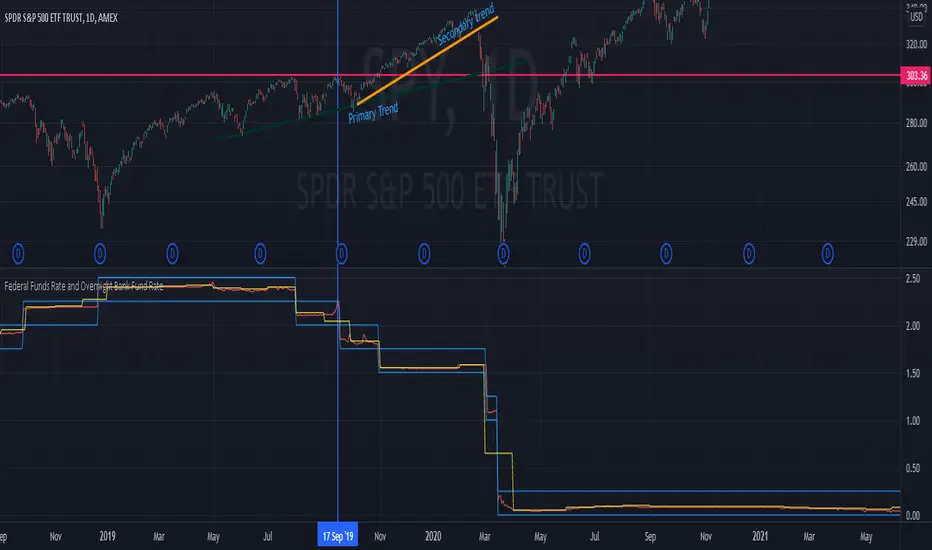
Federal Funds Rate and Overnight Bank Fund RateAMEX:SPY
Comparison of the Overnight Bank Fund Rate and the Effective Federal Funds Rate.
The Fed sets a discount rate of 100 basis points above the effective federal funds rate to discourage ("penalize") banks from borrowing from its reserves. If lending banks have excess in their reserves, the borrowing banks have ease in negotiating a lower rate overnight to maintain its requirements. For this reason its a good indicator of the economy. If it becomes more difficult for banks to maintain the required reserve amount they may charge borrowing banks higher rates.
Both the Effective Federal Funds Rate and Overnight Bank Fund Rate use the same data. Except, the OBFR includes overnight Eurodollar transaction data and certain overnight “selected deposit” transactions that are placed at domestic bank branches controlled by a U.S. banking office.
The indicator includes the lower and upper bound target rate set by the Federal Reserve.
An interesting note:
Notice the jump in the Overnight Bank Rate followed by Fed buying to provide liquidity and lower rates in Sept 2019.
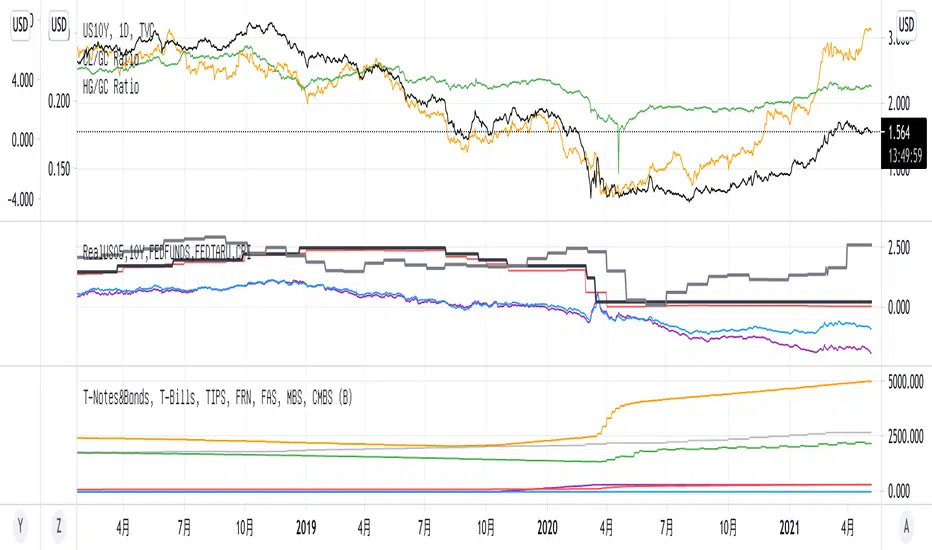
Gov Bonds Real Rates 10/05Y, FED RATEs, CPIGov Bonds Real Rates 10/05Y, FED RATEs, CPI。美国经济数据10年债和5年债实际收益率,美国目标利率和实际利率,CPI消费者物价指数

US Inflation Rate [nb]This is the United States inflation rate, based on the total Consumer Price Index published by the U.S. Bureau of Labor Statistics.
Option to toggle:
A line to display the inflation rate in December. It does not change until the next December.
What the color change to red is indicative of:
According to the Federal Open Market Committee (FOMC) regarding inflation rate, "2% is a bae number to be around". This does not imply a strict 2% inflation for success and allows room for federal rate cuts should they be needed.
Although FOMC declared 2% to be "bae" in 2012, James Bullard, of federal banking fame, claims that started to become the norm in 1995. Therefore the inflation rate line will only turn red 1995 onwards, and serves as a friendly reminder that inflation has been over at or over 2% for more than one month.
Sources:
www.bls.gov
www.federalreserve.gov
www.stlouisfed.org

Macroeconomic Artificial Neural Networks
This script was created by training 20 selected macroeconomic data to construct artificial neural networks on the S&P 500 index.
No technical analysis data were used.
The average error rate is 0.01.
In this respect, there is a strong relationship between the index and macroeconomic data.
Although it affects the whole world,I personally recommend using it under the following conditions: S&P 500 and related ETFs in 1W time-frame (TF = 1W SPX500USD, SP1!, SPY, SPX etc. )
Macroeconomic Parameters
Effective Federal Funds Rate (FEDFUNDS)
Initial Claims (ICSA)
Civilian Unemployment Rate (UNRATE)
10 Year Treasury Constant Maturity Rate (DGS10)
Gross Domestic Product , 1 Decimal (GDP)
Trade Weighted US Dollar Index : Major Currencies (DTWEXM)
Consumer Price Index For All Urban Consumers (CPIAUCSL)
M1 Money Stock (M1)
M2 Money Stock (M2)
2 - Year Treasury Constant Maturity Rate (DGS2)
30 Year Treasury Constant Maturity Rate (DGS30)
Industrial Production Index (INDPRO)
5-Year Treasury Constant Maturity Rate (FRED : DGS5)
Light Weight Vehicle Sales: Autos and Light Trucks (ALTSALES)
Civilian Employment Population Ratio (EMRATIO)
Capacity Utilization (TOTAL INDUSTRY) (TCU)
Average (Mean) Duration Of Unemployment (UEMPMEAN)
Manufacturing Employment Index (MAN_EMPL)
Manufacturers' New Orders (NEWORDER)
ISM Manufacturing Index (MAN : PMI)
Artificial Neural Network (ANN) Training Details :
Learning cycles: 16231
AutoSave cycles: 100
Grid
Input columns: 19
Output columns: 1
Excluded columns: 0
Training example rows: 998
Validating example rows: 0
Querying example rows: 0
Excluded example rows: 0
Duplicated example rows: 0
Network
Input nodes connected: 19
Hidden layer 1 nodes: 2
Hidden layer 2 nodes: 0
Hidden layer 3 nodes: 0
Output nodes: 1
Controls
Learning rate: 0.1000
Momentum: 0.8000 (Optimized)
Target error: 0.0100
Training error: 0.010000
NOTE : Alerts added . The red histogram represents the bear market and the green histogram represents the bull market.
Bars subject to region changes are shown as background colors. (Teal = Bull , Maroon = Bear Market )
I hope it will be useful in your studies and analysis, regards.
