Combined SmartComment & Dynamic S/R LevelsDescription:
The Combined SmartComment & Dynamic S/R Levels script is designed to provide valuable insights for traders using TradingView. It integrates dynamic support and resistance levels with a powerful Intelligent Comment system to enhance decision-making. The Intelligent Comment feature generates market commentary based on key technical indicators, delivering real-time actionable feedback that helps optimize trading strategies.
Intelligent Comment Feature:
The Intelligent Comment function continuously analyzes market conditions and offers relevant insights based on combinations of various technical indicators such as RSI, ATR, MACD, WMA, and others. These comments help traders identify potential price movements, highlighting opportunities to buy, sell, or wait.
Examples of the insights provided by the system include:
RSI in overbought/oversold and price near resistance/support: Indicates potential price reversal points.
Price above VAH and volume increasing: Suggests a strengthening uptrend.
Price near dynamic support/resistance: Alerts when price approaches critical support or resistance zones.
MACD crossovers and RSI movements: Provide signals for potential trend shifts or continuations.
Indicators Used:
RSI (Relative Strength Index)
ATR (Average True Range)
MACD (Moving Average Convergence Divergence)
WMA (Weighted Moving Average)
POC (Point of Control)
Bollinger Bands
SuperSignal
Volume
EMA (Exponential Moving Average)
Dynamic Support/Resistance Levels
How It Works:
The script performs real-time market analysis, assessing multiple technical indicators to generate Intelligent Comments. These comments provide traders with timely guidance on potential market movements, assisting with decision-making in a dynamic market environment. The script also integrates dynamic support and resistance levels to further enhance trading accuracy.
Forecasting

Dynamic 200 EMA with Trend-Based ColoringDescription:
This script plots the 200-period Exponential Moving Average (EMA) and dynamically changes its color based on the trend direction. The script helps traders quickly identify whether the price is above or below the 200 EMA, which is widely used as a long-term trend indicator.
How It Works:
The script calculates the 200 EMA based on the closing price.
If the price is above the EMA, it suggests a bullish trend, and the EMA line turns green.
If the price is below the EMA, it suggests a bearish trend, and the EMA line turns red.
An optional background color is added to enhance visual clarity, highlighting the current trend direction.
Use Cases:
Trend Confirmation: Helps traders determine if the overall trend is bullish or bearish.
Support and Resistance: The 200 EMA is often used as dynamic support/resistance.
Entry & Exit Signals: Traders can use crossovers with the 200 EMA as potential trade signals.
This script is designed for traders looking for a simple yet effective way to incorporate trend visualization into their charts. It is fully open-source and can be customized to fit individual trading strategies.

RSI XTR with selective candle color by Edwin KThis tradingView indicator named "RSI XTR with selective candle color", which modifies the candle colors on the chart based on RSI (Relative Strength Index) conditions. Here's how it works:
- rsiPeriod: Defines the RSI calculation period (default = 5).
- rsiOverbought: RSI level considered overbought (default = 70).
- rsiOversold: RSI level considered oversold (default = 30).
- These values can be modified by the user in the settings.
RSI Calculation
- Computes the RSI value using the ta.rsi() function on the closing price (close).
- The RSI is a momentum indicator that measures the magnitude of recent price changes.
Conditions for Candle Coloring
- when the RSI is above the overbought level.
- when the RSI is below the oversold level.
How It Works in Practice
- When the RSI is above 70 (overbought) → Candles turn red.
- When the RSI is below 30 (oversold) → Candles turn green.
- If the RSI is between 30 and 70, the candle keeps its default color.
This helps traders quickly spot potential reversal zones based on RSI momentum.
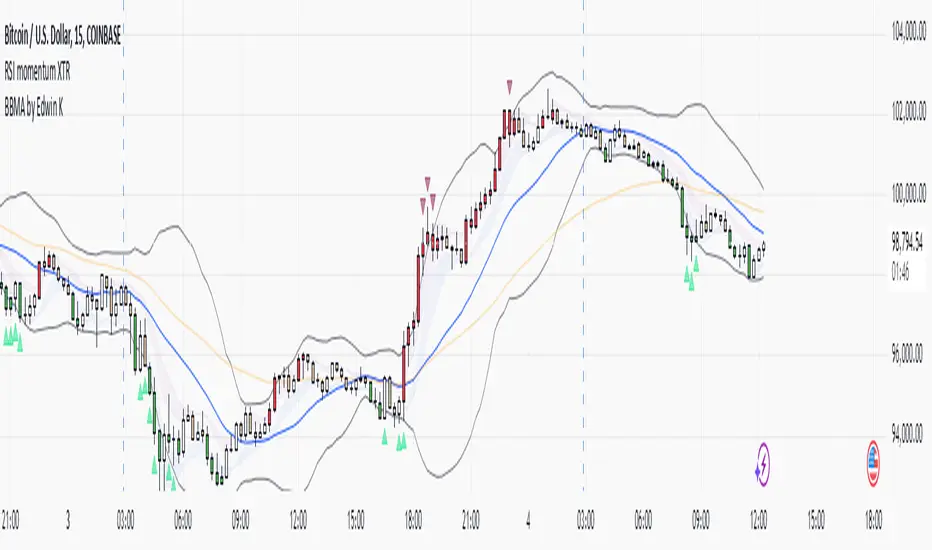
EMA & Bollinger BandsThis indicator combines three main functionalities into a single script:
1. Exponential Moving Average (EMA):
- Purpose: Calculates and plots the EMA of a chosen price source.
- Inputs:
- EMA Length: The period for the EMA calculation.
- EMA Source: The price series (such as close) used for the EMA.
- EMA Offset: Allows shifting the EMA line left or right on the chart.
- Output: A blue-colored EMA line plotted on the chart.
2. Smoothing MA on EMA:
- Purpose: Applies a secondary moving average (MA) on the previously calculated EMA. There is also an option to overlay Bollinger Bands on this smoothed MA.
- Inputs:
- Smoothing MA Type: Options include "None", "SMA", "SMA + Bollinger Bands", "EMA", "SMMA (RMA)", "WMA", and "VWMA".
- Selecting "None" disables this feature.
- Choosing "SMA + Bollinger Bands" will additionally plot Bollinger Bands around the smoothed MA.
- Smoothing MA Length: The period used to calculate the smoothing MA.
- BB StdDev for Smoothing MA: The standard deviation multiplier for the Bollinger Bands (applies only when "SMA + Bollinger Bands" is selected).
- Calculation Details:
- The chosen MA type is applied to the EMA value.
- If Bollinger Bands are enabled, the script computes the standard deviation of the EMA over the smoothing period, multiplies it by the specified multiplier, and then plots an upper and lower band around the smoothing MA.
- Output:
- A yellow-colored smoothing MA line.
- Optionally, green-colored upper and lower Bollinger Bands with a filled background if the "SMA + Bollinger Bands" option is selected.
3. Bollinger Bands on Price:
- Purpose: Independently calculates and plots traditional Bollinger Bands based on a moving average of a selected price source.
- Inputs:
- BB Length: The period for calculating the moving average that serves as the basis of the Bollinger Bands.
- BB Basis MA Type: The type of moving average to use (options include SMA, EMA, SMMA (RMA), WMA, and VWMA).
- BB Source: The price series (such as close) used for the Bollinger Bands calculation.
- BB StdDev: The multiplier for the standard deviation used to calculate the upper and lower bands.
- BB Offset: Allows shifting the Bollinger Bands left or right on the chart.
- Calculation Details:
- The script computes a basis line using the selected MA type on the chosen price source.
- The standard deviation of the price over the specified period is then multiplied by the provided multiplier to determine the distance for the upper and lower bands.
- Output:
- A basis line (typically drawn in a blue tone), an upper band (red), and a lower band (teal).
- The area between the upper and lower bands is filled with a semi-transparent blue background for easier visualization.
---
How It Works Together
- Integration:
The script is divided into clearly labeled sections for each functionality. All parts are drawn on the same chart (overlay mode enabled), providing a comprehensive view of market trends.
- Customization:
Users can adjust parameters for the EMA, the smoothing MA (and its optional Bollinger Bands), as well as the traditional Bollinger Bands independently. This allows for flexible customization depending on the trader's strategy or visual preference.
- Utility:
Combining these three analyses into one indicator enables traders to view:
- The immediate trend via the EMA.
- A secondary smoothed trend that might help reduce noise.
- A volatility measure through Bollinger Bands on both the price and the smoothed EMA.
---
This combined indicator is useful for technical analysis by providing both trend-following (EMA and smoothing MA) and volatility indicators (Bollinger Bands) in one streamlined tool.

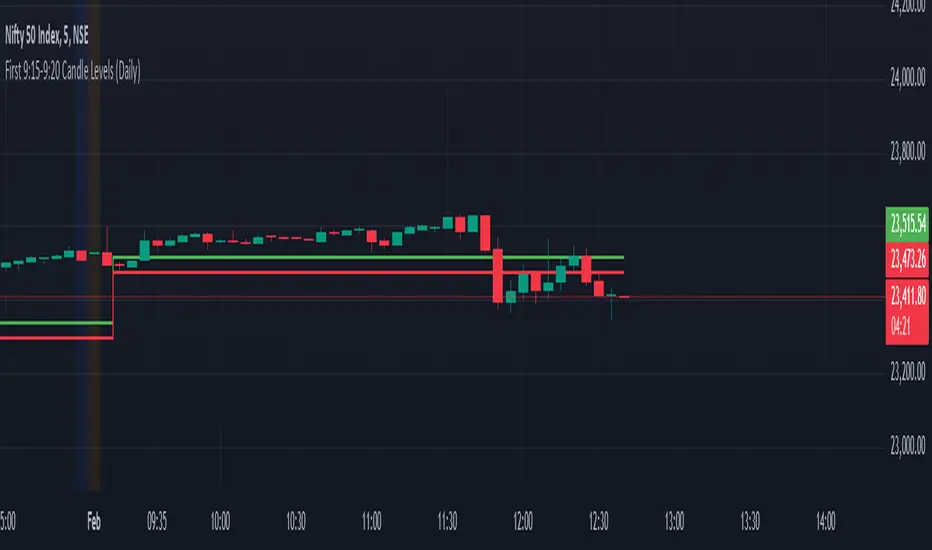
First 9:15-9:20 Candle Levels (Daily)This indicator captures the closing price of the first 5-minute candle (9:15 - 9:20 AM) every trading day. It then calculates 0.09% above and below this closing price and plots horizontal lines. The indicator resets daily at 9:15 AM, ensuring it always tracks the latest market open. After 9:20 AM, the calculated levels remain visible throughout the day. The upper level is displayed in green, while the lower level is in red. This tool helps traders identify key price levels early in the session, useful for setting stop-losses, take-profit zones, or identifying potential breakout points.
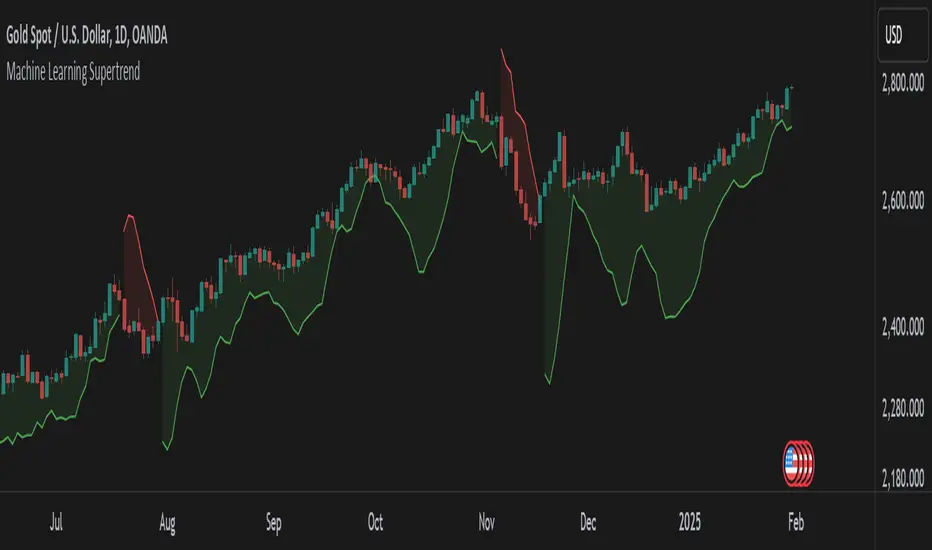
Machine Learning SupertrendThe Machine Learning Supertrend is an advanced trend-following indicator that enhances the traditional Supertrend with Gaussian Process Regression (GPR) and kernel-based learning. Unlike conventional methods that rely purely on historical ATR values, this indicator integrates machine learning techniques to dynamically estimate volatility and forecast future price movements, resulting in a more adaptive and robust trend detection system.
At the core of this indicator lies Gaussian Process Regression (GPR), which utilizes a Radial Basis Function (RBF) kernel to model price distributions and anticipate future trends. Instead of simply looking at past price action, it constructs a kernel matrix, enabling a probabilistic approach to price forecasting. This allows the indicator to not only detect current trends but also project potential trend reversals with greater accuracy.
By applying machine learning to ATR estimation, the ML Supertrend dynamically adjusts its thresholds based on predicted values rather than a fixed multiplier. This makes the trend signals more responsive to market conditions, reducing false signals and minimizing whipsaws often seen with traditional Supertrend indicators. The upper and lower bands are no longer static but evolve based on the underlying price structure, improving the reliability of trend shifts.
When the price crosses these adaptive levels, the indicator detects a trend change and plots it accordingly. Green signifies a bullish trend, while red indicates a bearish one. Alerts can also be triggered when the trend shifts, allowing traders to react quickly to potential reversals.
What makes this approach powerful is its ability to adapt to different market conditions. Traditional ATR-based methods use fixed parameters that might not always be optimal, whereas this ML-driven Supertrend continuously refines its estimations based on real-time data. The result is a more intelligent, less lagging, and highly adaptive trend-following tool.
This indicator is particularly useful for traders looking to enhance trend-following strategies with AI-driven insights. It reduces noise, improves signal reliability, and even offers a degree of trend forecasting, making it ideal for those who want a more advanced and dynamic alternative to standard Supertrend indicators.
This indicator is provided for educational and informational purposes only. It does not constitute financial advice, and past performance is not indicative of future results. Trading involves risk, and users should conduct their own research and use proper risk management before making investment decisions.
SASDv2rSensitive Altcoin Season Detector V2
This Pine Script™ code, titled "SASDv2r" (Sensitive Altcoin Season Detector version 2 revised), is designed for cryptocurrency trading analysis on the TradingView platform and tailored for those interested in tracking when altcoins might be outperforming Bitcoin, potentially indicating a market shift towards altcoins.
Feel free to use and modify. If you made it better, please let me know. Intention was to help the community with a tool for retail traders have no access to advanced, MV indicators. Solution uses classic TA only.
Use it witl TOTAL3/BTC indicator.
Please check: it gave signal just before last alt season % rose more than 250%.
Market Cap Data Fetching: The script fetches market capitalization data for Bitcoin, Ethereum, and all other altcoins (excluding Bitcoin and Ethereum) using request.security function.
Altcoin to Bitcoin Ratio: It calculates the ratio of total market cap of altcoins to Bitcoin's market cap (altToBtcRatio), which is central to identifying an "altcoin season."
Moving Averages: Several moving averages are computed for different time frames (50-day SMA, 200-day SMA, 20-day SMA, and 10-day EMA) to analyze trends in the altcoin to Bitcoin ratio.
Momentum Indicators: The script uses RSI (Relative Strength Index) and MACD (Moving Average Convergence Divergence) to gauge momentum and potential reversal points in the market.
Custom Indicators: It includes Volume Weighted Moving Average (VWMA) and a custom momentum indicator (altMomentum and altMomentumAvg) to provide additional insights into market movements.
Volatility Measurement: Bollinger Bands are calculated to assess volatility in the altcoin to Bitcoin ratio, which helps identify periods of high or low market activity.
Visual Analysis: Various plots are added to the chart for visual interpretation, including the altcoin to Bitcoin ratio, different moving averages, and Bollinger Bands.
Alt Season Detection: The script defines conditions for detecting when an "altcoin season" might be starting, based on crossovers of moving averages, RSI levels, MACD signals, and other custom criteria.
Performance Tracking: After signaling an alt season, the script evaluates the performance over the next 30 days by checking if there's been an increase in the altcoin to Bitcoin ratio, adding labels for positive or negative trends.(this one is in progress). Logic still gives false signals and aim is to identify failed signals.
Visual Signals: Labels are placed on the chart to visually indicate the beginning of a potential alt season or the performance outcome after a signal, aiding traders in making informed decisions.

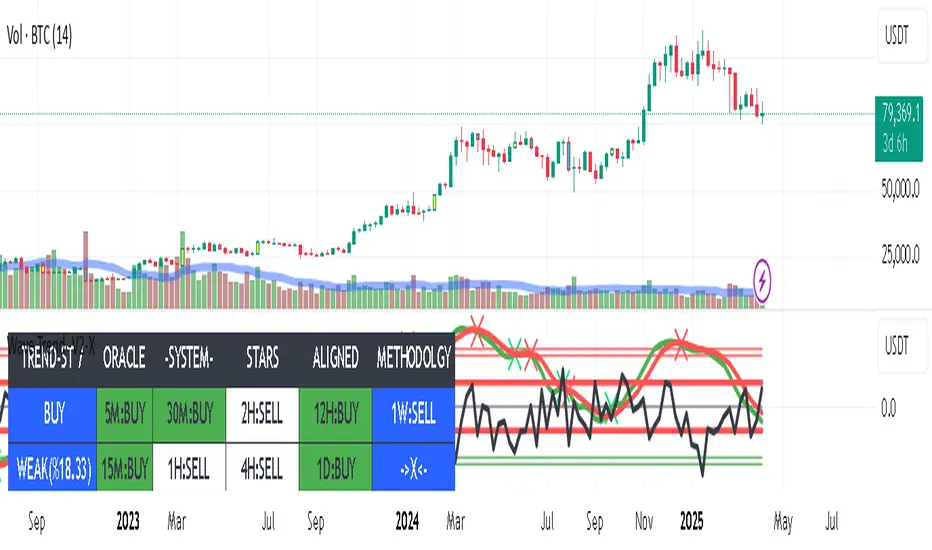
TrendMasterPro_FekonomiTrend Change and Start Signals with Weighted Conditions
The Trend Change and Start Signals with Weighted Conditions indicator leverages various technical analysis tools to generate reliable buy and sell signals. This indicator helps investors more accurately identify trend changes and start signals in the market.
Features:
Utilizes popular technical analysis tools such as MACD, RSI, EMA, and Ichimoku Cloud.
Enhances signal accuracy with additional indicators like ADX and Volume Increase.
Allows users to adjust the weights of each condition to set their importance.
The Confidence Level parameter lets you adjust the accuracy rate of the signals.
Visual Signals make it easy to track buy and sell points directly on the chart.
How It Works:
Condition Weights: Users assign weights to indicators like MACD, RSI, EMA, and Ichimoku Cloud. If you have no idea, use default settings.
Condition Fulfillment: Checks if the conditions for each indicator are met.
Confidence Level: The total weight of the fulfilled conditions must exceed the user-defined confidence level.
Signal Generation: When these conditions are met, a buy or sell signal is generated and visually displayed on the chart.
Customization:
Personalize Signals: By adjusting the weights of the indicators used, you can personalize the signals to match your trading strategy and preferences.
Use Cases:
Short-Term Investments: Identify quick trend changes for short-term trading decisions.
Long-Term Investments: Detect long-term trend starts and changes for strategic investment decisions.
Technical Analysis: Combine different technical analysis tools for more comprehensive and reliable analyses.
With this indicator, you can better understand market movements and make more informed investment decisions. Try it now and enhance your trading strategy!
by Fekonomi

Institutional Moves DetectorIndicator Name: Institutional Pattern Detector
What It Does:
Trend Following: It uses a Moving Average (MA) to understand the general direction of the price. The MA is like a smoothed-out line of the price over time, showing if the price trend is going up or down.
Volatility Measurement: The script employs Bollinger Bands (BB) to see how much the price is fluctuating. Bollinger Bands create an upper and lower "channel" around the price, which gets wider or narrower based on how volatile the price is.
Volume Check: It looks at trading volume to find times when there's unusually high activity, which could mean big players (institutions like banks or funds) are trading. It flags this when the volume is 1.5 times more than the average volume of the last 100 bars.
Pattern Detection for Trading Signals:
Entry Signal ("IN"): When there's high volume and the price is above the upper Bollinger Band, it suggests there might be strong buying from big institutions. This could mean the price might keep going up.
EXIT Signal ("OUT"): If there's high volume and the price falls below the lower Bollinger Band, it indicates possible strong selling pressure from institutions, suggesting the price might go down.
Visual Cues:
An orange label "IN" appears below the price bar for entry signals.
A red label "OUT" appears above the price bar for exit signals.
The moving average line is plotted on the chart in orange to help you see the trend.
Alerts: The script can alert you when these entry or exit signals occur, so you can get notifications without needing to stare at the chart all day.
For New Traders:
This indicator helps you spot when big traders might be influencing the market, potentially giving you a clue about when to enter or exit.
Remember, this is one tool among many. You should not base your trading solely on this; combine it with other analysis methods.
It's always wise to practice with a demo account before using real money to get a feel for how these signals work in actual market conditions.
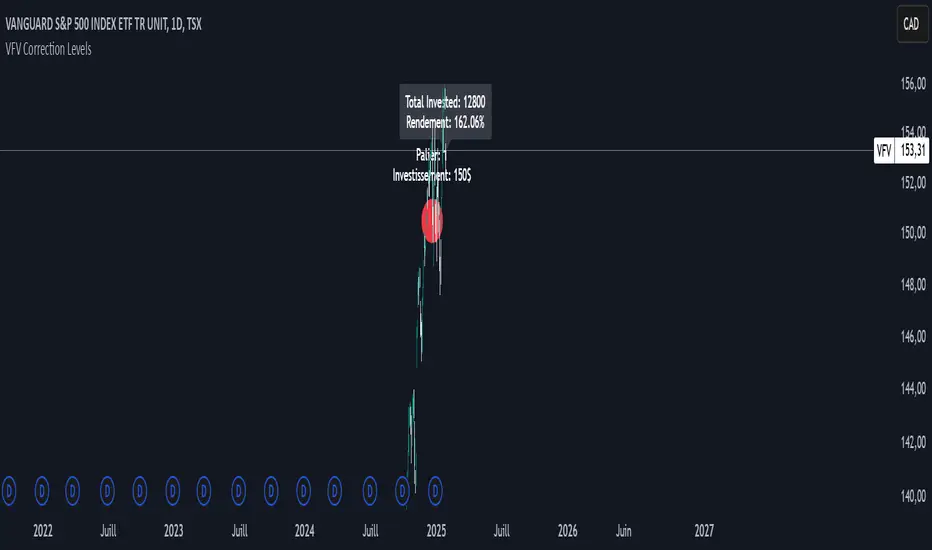
VFV Correction Levels
This Pine Script, "VFV Correction Levels," identifies significant daily price corrections and calculates corresponding investments based on fixed thresholds (paliers). Key features include:
Six predefined correction levels trigger investments between $150 and $600 based on the percentage drop.
Larger corrections correspond to higher investment amounts.
Graphical Indicators:
Visual labels mark correction levels and display investment amounts directly on the chart.
Investment Tracking:
Calculates total invested and tracks performance (yield percentage) relative to the initial correction price.
Combo The "Combo" Indicator is a visual tool for TradingView that allows traders to clearly display their analysis based on OrderBloque concepts.
Key points to understand:
The indicator does NOT perform automatic market analysis
It serves as a configurable visualization tool for your personal analysis
Key Features:
Manual Configuration: You select a timeframe and function for each variable (V1 to V4)
Function Options:
VC (Volume Confirmation)
FP (Fractal Point)
LI (Liquidity)
EX (Execution)
Combinations like VC, VC, VC (EX)
Timeframe Range: Selectable from 5 minutes to 1 month
Tabular Display: Shows your inputs in a clear table on the chart
Customizable Appearance: Adjustable table position, colors, and text size

Auto Fibonacci Extension and Retracement with Visual AlertsThis indicator automatically calculates and plots Fibonacci retracement and extension levels based on recent swing highs and lows, making it a powerful tool for traders who use Fibonacci analysis in their strategies.
Key Features:
• Dynamic Fibonacci Levels: Automatically detects swing highs and lows over a user-defined lookback period to calculate key Fibonacci retracement (e.g., 0.236, 0.382, 0.618, etc.) and extension (e.g., 1.618, 2.618, etc.) levels.
• Visual Alerts: Displays intuitive visual alerts when the price crosses important Fibonacci levels.
• Blue dashed lines for retracement levels.
• Green dashed lines for extension levels.
• Labels with up or down arrows indicating price interactions with these levels.
• Swing High/Low Visualization: Marks recent swing highs and lows with crosses for better clarity.
• Customizable: Adjust the lookback period and Fibonacci levels to suit your trading style.
Who is it for?
This indicator is perfect for:
• Swing Traders: To identify potential reversal or continuation zones.
• Day Traders: For short-term setups based on Fibonacci levels.
• Fibonacci Enthusiasts: To automate the time-consuming process of manually plotting levels.
Usage Ideas:
1. Use retracement levels (e.g., 0.618) to identify areas of potential support or resistance.
2. Use extension levels (e.g., 1.618) to target potential breakout or continuation zones.
3. Combine this indicator with candlestick patterns, volume analysis, or other tools for confirmation.
Limitations:
• This is a standalone indicator and does not provide buy/sell signals. It’s recommended to combine it with other technical analysis tools for best results.
• The lookback period and swing detection rely on past data, so adjustments may be needed based on the asset or timeframe.
Whether you’re looking to streamline your Fibonacci analysis or explore new opportunities in your trading, this indicator is designed to save time, increase accuracy, and enhance your overall trading experience.

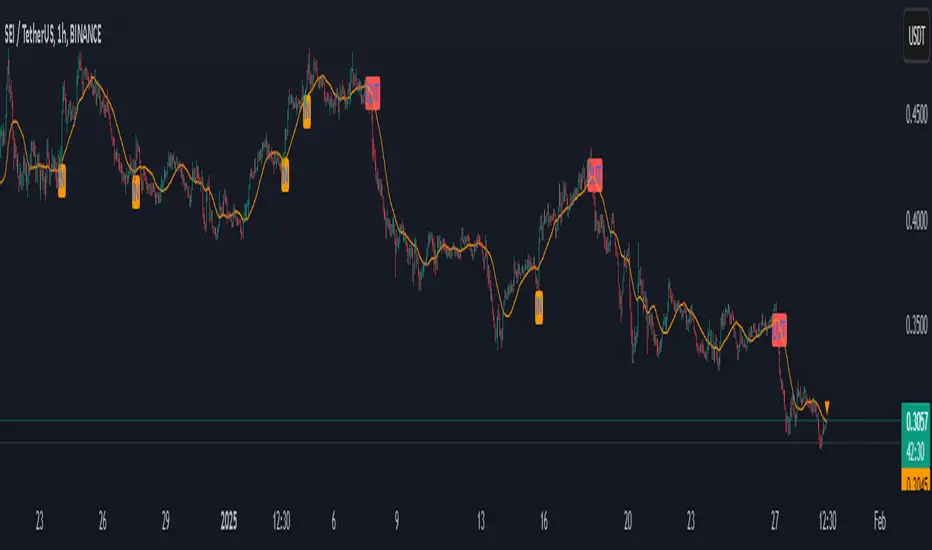
TOL LANGIT ATR v7 - AI EnhancedThe TOL LANGIT ATR v7 is an adaptive technical indicator designed to identify market trends, support and resistance levels, and breakout points. It uses the Average True Range (ATR) and volatility to dynamically adjust trend bands, with visual markers for buy and sell signals. The indicator also highlights key support (blue) and resistance (orange) levels, and alerts users when these levels are broken. It’s perfect for trend following, breakout trading, and reversal strategies, and includes easy-to-set alerts for key market changes.

Justice GameplanFibonacci Playbook: The Gridiron Indicator
This indicator doesn’t just mark levels—it’s your head coach, calling plays straight from the Fibonacci playbook to keep you ahead of the market’s defense. Here’s the game plan:
1. Scouting the Field:
It analyzes the last 180 bars like a seasoned scout, finding the *high-price MVP* and *low-price underdog* to set the boundaries of the game. This is your field—own it.
2. The Playbook:
- 50% Retracement (The Midfield Handoff):** The classic “let’s regroup and push forward” zone. Price often makes its comeback play here.
- 61.8% Retracement (The Sideline Route):** A tighter play—when price hits this zone, it’s like a running back juking defenders, setting up for a breakout move.
- 1.618 and 2.618 Extensions (Hail Mary Territory):** These are your end zones—when price reaches here, it’s all or nothing. You’re either scoring big or heading back to the locker room.
3. Game-Day Colors:
- Green Lines: Your offensive line—protecting your buy zones. Calm, calculated, and ready for a push.
- Red Lines: The defensive blitz—these levels warn, “You’ve hit resistance, time to adjust before you fumble.”
4. Signal Flags:
- Green Triangles (The Snap):The market signals a buy opportunity like a quarterback calling the perfect audible. It’s your chance to get in before the defense reacts.
- Red Triangles (The Sack): The market’s pressure is on—time to exit before the price gets tackled back to where it started.
5. End-to-End Game Vision:
The horizontal lines stretch across the chart like yard markers, setting the stage for price to march down the field—or get stopped cold by Fibonacci resistance.
This indicator is your ultimate play-caller, marking the critical zones where the market makes its big plays. Whether you’re running a steady offense or pulling off a last-minute Hail Mary, Fibonacci’s got your back. Time to suit up and dominate the trading field. 🏈

Wave Trend -V2Wave Trend -V2 is here to give you a serious edge.
This upgraded version of the popular LazyBear script takes wave trend analysis to the next level.
Here's the deal:
Multi-Timeframe Analysis: Beyond Short-Term Noise:
Novice traders often focus solely on the current timeframe (let's say, the 5-minute chart).
Wave Trend -V2 breaks free from this limitation by analyzing price action across multiple timeframes (1-minute to 1-week).
---This holistic view helps you:
Identify larger trends: Are we in a bullish uptrend on the daily chart, even if the hourly chart is showing some short-term weakness? Wave Trend -V2 helps you see the bigger picture.
Avoid false breakouts: Short-term price spikes can create false signals. By looking at higher timeframes, you can filter out these "noise" and focus on sustainable trends.
---Pressure Analysis: Gauging Market Strength:
Wave Trend -V2 goes beyond simple trend identification.
It incorporates "pressure" analysis to gauge the strength and direction of the current market trend.
This helps you:
Enter trades with confidence: When the trend is strong and the pressure is high, you can enter trades with greater conviction.
Minimize risk: If the pressure is waning or conflicting signals arise, you can avoid entering trades or adjust your risk parameters accordingly.
Impact Point Analysis: Predicting Future Price Moves:
Wave Trend -V2 analyzes the price impact of the last four wave trend crossovers.
Let's say the last impact point was "X", the previous one "X-1", the one before that "X-2", and so on.
The indicator calculates the average price movement between these points using the following simplified formula:
Average Impact = (X - X-1) + (X-1 - X-2) + (X-2 - X-3) / 3
This average provides a valuable estimate of the potential price movement of the next crossover.
Multiple Take Profit Levels: Setting Strategic Targets:
Wave Trend -V2 offers three dynamic take profit levels (TP1, TP2, TP3).
TP1: Based on the estimated average impact.
TP2: Twice the estimated average impact.
TP3: Three times the estimated average impact.
This allows you to set your profit targets strategically, maximizing potential gains while managing risk effectively.
Why don't use the Estmated impact point to stop the trade?
In order to eliminated the WHIPSAW effect! There is no other way...
Wave Trend -V2 is designed for traders who seek a deeper understanding of trend dynamics and desire a more sophisticated approach to trading. By combining multi-timeframe analysis, pressure assessment, and advanced impact point calculations, this indicator empowers you to make more informed trading decisions and potentially improve your trading outcomes.
The indicator work best with combination of other trend type indicators.
Please dont forget that indicators are not miracle medicines , it cannot give you exact results , market was always volative , use at your own discretion.
Quarterly Divider The "Quarterly Divider" script draws vertical lines at the start of each quarter (January, April, July, October) on the Trading View chart. It also labels each line with the corresponding quarter (Q1, Q2, Q3, Q4) at the bottom of the line, making it easy to visualize the start of each trading quarter. The color and thickness of the lines are customizable
NB. works effectively is used on the weekly timeframe
