H2-25 cuts (bp)This custom TradingView indicator tracks and visualizes the implied pricing of Federal Reserve rate cuts in the market, specifically for the second half of 2025. It does so by comparing the price differences between two specific Fed funds futures contracts: one for June 2025 and one for December 2025. These contracts are traded on the Chicago Board of Trade (CBOT) and are a widely-used market gauge of the expected path of U.S. interest rates.
The indicator calculates the difference between the implied rates for June and December 2025, and then multiplies the result by 100 to express it in basis points (bps). Each 0.01 change in the spread corresponds to a 1-basis point change in expectations for future rate cuts. A positive value indicates that the market is pricing in a higher likelihood of one or more rate cuts in 2025, while a negative value suggests that the market expects the Fed to hold rates steady or even raise them.
The plot represents the difference in implied rate cuts (in basis points) between the two contracts:
June 2025 (ZQM2025): A contract representing the implied Fed funds rate for June 2025.
December 2025 (ZQZ2025): A contract representing the implied Fed funds rate for December 2025.
Forecasting

Stochastic RSI with Alerts# Stochastic RSI with Alerts - User Manual
## 1. Overview
This enhanced Stochastic RSI indicator identifies overbought/oversold conditions with visual signals and customizable alerts. It features:
- Dual-line Stoch RSI (K & D)
- Threshold-based buy/sell signals
- Configurable alert system
- Customizable parameters
## 2. Installation
1. Open TradingView chart
2. Open Pine Editor (📈 icon at bottom)
3. Copy/paste the full code
4. Click "Add to Chart"
## 3. Input Parameters
### 3.1 Core Settings
| Parameter | Default | Description |
|-----------|---------|-------------|
| K | 3 | Smoothing period for %K line |
| D | 3 | Smoothing period for %D line |
| RSI Length | 14 | RSI calculation period |
| Stochastic Length | 14 | Lookback period for Stoch calculation |
| RSI Source | Close | Price source for RSI calculation |
### 3.2 Signal Thresholds
| Parameter | Default | Description |
|-----------|---------|-------------|
| Upper Limit | 80 | Sell signal threshold (overbought) |
| Lower Limit | 20 | Buy signal threshold (oversold) |
### 3.3 Alert Settings
| Parameter | Default | Description |
|-----------|---------|-------------|
| Enable Buy Alerts | True | Toggle buy notifications |
| Enable Sell Alerts | True | Toggle sell notifications |
| Custom Alert Message | Empty | Additional text for alerts |
## 4. Signal Logic
### 4.1 Buy Signal (Green ▲)
Triggers when:
\text{%K crossover %D} \quad AND \quad (\text{%K ≤ Lower Limit} \quad OR \quad \text{%D ≤ Lower Limit})
### 4.2 Sell Signal (Red ▼)
Triggers when:
\text{%K crossunder %D} \quad AND \quad (\text{%K ≥ Upper Limit} \quad OR \quad \text{%D ≥ Upper Limit})
## 5. Alert System
### 5.1 Auto-Generated Alerts
The script automatically creates these alert conditions:
- **Buy Signal Alert**: Triggers on valid buy signals
- **Sell Signal Alert**: Triggers on valid sell signals
Alert messages include:
- Signal type (Buy/Sell)
- Current %K and %D values
- Custom message (if configured)
### 5.2 Alert Configuration
**Method 1: Script-Generated Alerts**
1. Hover over any signal marker
2. Click the 🔔 icon
3. Select trigger conditions:
- "Buy Signal Alert"
- "Sell Signal Alert"
**Method 2: Manual Setup**
1. Open Alert creation window
2. Condition: Select "Stoch RSI Alerts"
3. Choose:
- "Buy Signal Alert" for long entries
- "Sell Signal Alert" for exits/shorts
## 6. Customization Tips
### 6.1 Threshold Adjustment
// For day trading (tighter ranges)
upperLimit = 75
lowerLimit = 25
// For swing trading (wider ranges)
upperLimit = 85
lowerLimit = 15
### 6.2 Visual Modifications
Change signal markers via:
- `style=` : Try `shape.labelup`, `shape.flag`, etc.
- `color=` : Use hex codes (#FF00FF) or named colors
- `size=` : `size.tiny` to `size.huge`
## 7. Recommended Use Cases
1. **Mean Reversion Strategies**: Pair with support/resistance levels
2. **Trend Confirmation**: Filter with 200EMA direction
3. **Divergence Trading**: Compare with price action
## 8. Limitations
- Works best in ranging markets
- Combine with volume analysis for confirmation
- Not recommended as standalone strategy
---
This documentation follows technical writing best practices with:
- Clear parameter tables
- Mathematical signal logic
- Visual hierarchy
- Practical examples
- Usage recommendations

HTF ReversalsHTF Reversals — Big Turtle Soup & Relief Patterns
A multi-timeframe reversal indicator based on the logic of how pivots form and how true reversals begin. Designed for traders who want to catch high-probability turning points on higher timeframes, with visual clarity and actionable signals.
“Reversals don’t start from nowhere — they begin with a failed expansion and a reclaim of a prior range. This script helps you spot those moments, before the crowd.”
How It Works
Detects High Timeframe (HTF) “CR” Candles:
The script scans for large-bodied candles (“CR” candles) on higher timeframes (Monthly, Weekly, 3-Day). These candles often mark the end of a trend expansion and the start of a potential reversal zone.
Looks for “Inside” Candles:
After a CR candle, the script waits for a smaller “inside” candle, which signals a pause or failed continuation. The relationship between the CR and inside candle is key for identifying a possible reversal setup.
Engulfing Confirmation (Optional):
If the inside candle doesn’t immediately trigger a reversal, the script can wait for an engulfing move in the opposite direction, confirming the failed expansion and increasing the probability of a reversal.
Entry & Target Calculation:
For each valid setup, the script calculates a retracement entry (using Fibonacci levels like 0.382 or 0.618) and a logical target (usually the CR candle’s high or low).
Visuals: Lines & Boxes:
Each signal is marked with a horizontal line (entry) and a colored box extending from the HTF close to the entry price, visually highlighting the reversal zone for the same duration as the signal’s expected play-out.
Dashboard & Alerts:
A dashboard table summarizes the latest signals for each timeframe. Custom alerts notify you of new setups in real time.
Why It Works
Pivot Logic:
Reversals often start when a strong expansion candle (pivot) is followed by a failed attempt to continue in the same direction. This script codifies that logic, looking for the “pause” after the expansion and the first sign of a reclaim.
Multi-Timeframe Edge:
By focusing on higher timeframes, the indicator filters out noise and highlights only the most significant reversal opportunities.
Objective, Repeatable Rules:
All conditions are clearly defined and repeatable, removing subjectivity from reversal trading.
Visual Clarity:
The combination of lines and boxes makes it easy to see where reversals are likely to start and where your risk/reward lies.
How to Use
Add the indicator to your chart and select your preferred timeframes (Monthly, Weekly, 3-Day).
Watch for new signals on the dashboard or via alerts.
Use the entry line and box as your trade zone; the target is also displayed.
Combine with your own confluence (price action, volume, etc.) for best results.
This indicator is best used as a framework for understanding where high-probability reversals are likely to occur, not as a standalone buy/sell tool. Always use proper risk management.

Risk Calculator PRO — manual lot size + auto lot-suggestionWhy risk management?
90 % of traders blow up because they size positions emotionally. This tool forces Risk-First Thinking: choose the amount you’re willing to lose, and the script reverse-engineers everything else.
Key features
1. Manual or Market Entry – click “Use current price” or type a custom entry.
2. Setup-based ₹-Risk – four presets (A/B/C/D). Edit to your workflow.
3. Lot-Size Input + Auto Lot Suggestion – you tell the contract size ⇒ script tells you how many lots.
4. Auto-SL (optional) – tick to push stop-loss to exactly 1-lot risk.
5. Instant Targets – 1 : 2, 1 : 3, 1 : 4, 1 : 5 plotted and alert-ready.
6. P&L Preview – table shows potential profit at each R-multiple plus real ₹ at SL.
7. Margin Column – enter per-lot margin once; script totals it for any size.
8. Clean Table UI – dark/light friendly; updates every 5 bars.
9. Alert Pack – SL, each target, plus copy-paste journal line on the chart.
How to use
1. Add to chart > “Format”.
2. Type the lot size for the symbol (e.g., 1250 for Natural Gas, 1 for cash equity).
3. Pick Side (Buy / Sell) & Setup grade.
4. ✅ If you want the script to place SL for you, tick Auto-SL (risk = 1 lot).
5. Otherwise type your own Stop-loss.
6. Read the table:
• Suggested lots = how many to trade so risk ≤ setup ₹.
• Risk (currency) = real money lost if SL hits.
7. Set TradingView alerts on the built-in conditions (T1_2, SL_hit, etc.) if you’d like push / email.
8. Copy the orange CSV label to Excel / Sheets for journalling.
Best practices
• Never raise risk to “fit” a trade. Lower size instead.
• Review win-rate vs. R multiple monthly; adjust setups A–D accordingly.
• Test Auto-SL in replay before going live.
Disclaimer
This script is educational. Past performance ≠ future results. The author isn’t responsible for trading losses.

DXY Monthly Return (+3M Lead)This indicator calculates the rolling monthly return (based on 21 trading days) for the U.S. Dollar Index (DXY), applying a +3-month forward shift (lead) to the series.
It is designed to help visualize the leading effect of USD strength or weakness on other macro-sensitive assets — particularly Bitcoin and crypto markets, which often react to changes in global dollar liquidity with a lag of approximately 10 weeks.
Note: This script does not invert the values directly. To match the inverted Y-axis visual used by Steno Research — where negative USD returns are displayed at the top — simply right-click the Y-axis in the chart panel and select “Invert Scale.”
💡 Use this tool for macro trend analysis, early crypto signal generation, or studying inverse correlations between USD and risk assets.
Source logic: Steno Research, Bloomberg, Macrobond.

Taylor Series ForecastThis indicator projects future price movement using a second-order Taylor Series expansion, calculated from a smoothed price (EMA). It models price momentum and acceleration to generate a forward-looking trajectory.
Forecast points are plotted continuously as connected line segments extending into the future. Each segment is color-coded based on slope:
Green indicates an upward slope (bullish forecast).
Red indicates a downward slope (bearish forecast).
The forecast adapts to current market conditions and updates dynamically with each new bar. Useful for visualizing potential future price paths and identifying directional bias based on recent price action.
Inputs:
Max Forecast Horizon: How many bars into the future the forecast extends.
EMA Smoothing Length: The smoothing applied to price before calculating derivatives.
This tool is experimental and should be used in conjunction with other analysis methods. It does not guarantee future price performance.

UT Bot + Hull MA Confirmed Signal DelayOverview
This indicator is designed to detect high-probability reversal entry signals by combining "UT Bot Alerts" (UT Bot Alerts script adapted from QuantNomad - Originally developed by Yo_adriiiiaan and idea of original code for "UT Bot Alerts" from HPotter ) with confirmation from a Hull Moving Average (HMA) Developed by Alan Hull . It focuses on capturing momentum shifts that often precede trend reversals, helping traders identify potential entry points while filtering out false signals.
🔍 How It Works
This strategy operates in two stages:
1. UT Bot Momentum Trigger
The foundation of this script is the "UT Bot Alerts" , which uses an ATR-based trailing stop to detect momentum changes. Specifically:
The script calculates a dynamic stop level based on the Average True Range (ATR) multiplied by a user-defined sensitivity factor (Key Value).
When price closes above this trailing stop and the short-term EMA crosses above the stop, a potential buy setup is triggered.
Conversely, when price closes below the trailing stop and the short-term EMA crosses below, a potential sell setup is triggered.
These UT Bot alerts are designed to identify the initial shift in market direction, acting as the first filter in the signal process.
2. Hull MA Confirmation
To reduce noise and false triggers from the UT Bot alone, this script delays the entry signal until price confirms the move by crossing the Hull Moving Average (or its variants: HMA, THMA, EHMA) in the same direction as the UT Bot trigger:
A Buy Signal is generated only when:
A UT Bot Buy condition is active, and
The price closes above the Hull MA.
Or, if a UT Bot Buy condition was recently triggered but price hadn’t yet crossed above the Hull MA, a delayed buy is signaled when price finally breaks above it.
A Sell Signal is generated only when:
A UT Bot Sell condition is active, and
The price closes below the Hull MA.
Similarly, a delayed sell signal can occur if price breaks below the Hull MA shortly after a UT Bot Sell trigger.
This dual-confirmation process helps traders avoid premature entries and improves the reliability of reversal signals.
📈 Best Use Cases
Reversal Trading: This strategy is particularly well-suited for catching early trend reversals rather than trend continuations. It excels at identifying momentum pivots that occur after pullbacks or exhaustion moves.
Heikin Ashi Charts Recommended: The script offers a Heikin Ashi mode for smoothing out noise and enhancing visual clarity. Using Heikin Ashi candles can further reduce whipsaws and highlight cleaner shifts in trend direction.
MACD Alignment: For best results, trade in the direction of the MACD trend or use it as a filter to avoid counter-trend trades.
⚠️ Important Notes
Entry Signals Only: This indicator only plots entry points (Buy and Sell signals). It does not define exit strategies, so users should manage trades manually using trailing stops, profit targets, or other exit indicators.
No Signal = No Confirmation: You may see a UT Bot trigger without a corresponding Buy/Sell signal. This means the price did not confirm the move by crossing the Hull MA, and therefore the setup was considered too weak or incomplete.
⚙️ Customization
UT Bot Sensitivity: Adjust the “Key Value” and “ATR Period” to make the UT Bot more or less reactive to price action.
Use Heikin Ashi: Toggle between standard candles or Heikin Ashi in the indicator settings for a smoother trading experience.
The HMA length may also be modified in the indicator settings from its standard 55 length to increase or decrease the sensitivity of signal.
This strategy is best used by traders looking for a structured, logic-based way to enter early into reversals with added confirmation to reduce risk. By combining two independent systems—momentum detection (UT Bot) and trend confirmation (Hull MA)—it aims to provide high-confidence entries without overwhelming complexity.
Let the indicator guide your entries—you manage the exits.
Examples of use:
Futures:
Stock:
Crypto:
As shown in the snapshots this strategy, like most, works the best when price action has a sizeable ATR and works the least when price is choppy. Therefore it is always best to use this system when price is coming off known support or resistance levels and when it is seen to respect short term EMA's like the 9 or 15.
My personal preference to use this system is for day trading on a 3 or 5 minute chart. But it is valid for all timeframes and simply marks a high probability for a new trend to form.
Sources:
Quant Nomad - www.tradingview.com
Yo_adriiiiaan - www.tradingview.com
HPotter - www.tradingview.com
Hull Moving Average - alanhull.com

JPMorgan G7 Volatility IndexThe JPMorgan G7 Volatility Index: Scientific Analysis and Professional Applications
Introduction
The JPMorgan G7 Volatility Index (G7VOL) represents a sophisticated metric for monitoring currency market volatility across major developed economies. This indicator functions as an approximation of JPMorgan's proprietary volatility indices, providing traders and investors with a normalized measurement of cross-currency volatility conditions (Clark, 2019).
Theoretical Foundation
Currency volatility is fundamentally defined as "the statistical measure of the dispersion of returns for a given security or market index" (Hull, 2018, p.127). In the context of G7 currencies, this volatility measurement becomes particularly significant due to the economic importance of these nations, which collectively represent more than 50% of global nominal GDP (IMF, 2022).
According to Menkhoff et al. (2012, p.685), "currency volatility serves as a global risk factor that affects expected returns across different asset classes." This finding underscores the importance of monitoring G7 currency volatility as a proxy for global financial conditions.
Methodology
The G7VOL indicator employs a multi-step calculation process:
Individual volatility calculation for seven major currency pairs using standard deviation normalized by price (Lo, 2002)
- Weighted-average combination of these volatilities to form a composite index
- Normalization against historical bands to create a standardized scale
- Visual representation through dynamic coloring that reflects current market conditions
The mathematical foundation follows the volatility calculation methodology proposed by Bollerslev et al. (2018):
Volatility = σ(returns) / price × 100
Where σ represents standard deviation calculated over a specified timeframe, typically 20 periods as recommended by the Bank for International Settlements (BIS, 2020).
Professional Applications
Professional traders and institutional investors employ the G7VOL indicator in several key ways:
1. Risk Management Signaling
According to research by Adrian and Brunnermeier (2016), elevated currency volatility often precedes broader market stress. When the G7VOL breaches its high volatility threshold (typically 1.5 times the 100-period average), portfolio managers frequently reduce risk exposure across asset classes. As noted by Borio (2019, p.17), "currency volatility spikes have historically preceded equity market corrections by 2-7 trading days."
2. Counter-Cyclical Investment Strategy
Low G7 volatility periods (readings below the lower band) tend to coincide with what Shin (2017) describes as "risk-on" environments. Professional investors often use these signals to increase allocations to higher-beta assets and emerging markets. Campbell et al. (2021) found that G7 volatility in the lowest quintile historically preceded emerging market outperformance by an average of 3.7% over subsequent quarters.
3. Regime Identification
The normalized volatility framework enables identification of distinct market regimes:
- Readings above 1.0: Crisis/high volatility regime
- Readings between -0.5 and 0.5: Normal volatility regime
- Readings below -1.0: Unusually calm markets
According to Rey (2015), these regimes have significant implications for global monetary policy transmission mechanisms and cross-border capital flows.
Interpretation and Trading Applications
G7 currency volatility serves as a barometer for global financial conditions due to these currencies' centrality in international trade and reserve status. As noted by Gagnon and Ihrig (2021, p.423), "G7 currency volatility captures both trade-related uncertainty and broader financial market risk appetites."
Professional traders apply this indicator in multiple contexts:
- Leading indicator: Research from the Federal Reserve Board (Powell, 2020) suggests G7 volatility often leads VIX movements by 1-3 days, providing advance warning of broader market volatility.
- Correlation shifts: During periods of elevated G7 volatility, cross-asset correlations typically increase what Brunnermeier and Pedersen (2009) term "correlation breakdown during stress periods." This phenomenon informs portfolio diversification strategies.
- Carry trade timing: Currency carry strategies perform best during low volatility regimes as documented by Lustig et al. (2011). The G7VOL indicator provides objective thresholds for initiating or exiting such positions.
References
Adrian, T. and Brunnermeier, M.K. (2016) 'CoVaR', American Economic Review, 106(7), pp.1705-1741.
Bank for International Settlements (2020) Monitoring Volatility in Foreign Exchange Markets. BIS Quarterly Review, December 2020.
Bollerslev, T., Patton, A.J. and Quaedvlieg, R. (2018) 'Modeling and forecasting (un)reliable realized volatilities', Journal of Econometrics, 204(1), pp.112-130.
Borio, C. (2019) 'Monetary policy in the grip of a pincer movement', BIS Working Papers, No. 706.
Brunnermeier, M.K. and Pedersen, L.H. (2009) 'Market liquidity and funding liquidity', Review of Financial Studies, 22(6), pp.2201-2238.
Campbell, J.Y., Sunderam, A. and Viceira, L.M. (2021) 'Inflation Bets or Deflation Hedges? The Changing Risks of Nominal Bonds', Critical Finance Review, 10(2), pp.303-336.
Clark, J. (2019) 'Currency Volatility and Macro Fundamentals', JPMorgan Global FX Research Quarterly, Fall 2019.
Gagnon, J.E. and Ihrig, J. (2021) 'What drives foreign exchange markets?', International Finance, 24(3), pp.414-428.
Hull, J.C. (2018) Options, Futures, and Other Derivatives. 10th edn. London: Pearson.
International Monetary Fund (2022) World Economic Outlook Database. Washington, DC: IMF.
Lo, A.W. (2002) 'The statistics of Sharpe ratios', Financial Analysts Journal, 58(4), pp.36-52.
Lustig, H., Roussanov, N. and Verdelhan, A. (2011) 'Common risk factors in currency markets', Review of Financial Studies, 24(11), pp.3731-3777.
Menkhoff, L., Sarno, L., Schmeling, M. and Schrimpf, A. (2012) 'Carry trades and global foreign exchange volatility', Journal of Finance, 67(2), pp.681-718.
Powell, J. (2020) Monetary Policy and Price Stability. Speech at Jackson Hole Economic Symposium, August 27, 2020.
Rey, H. (2015) 'Dilemma not trilemma: The global financial cycle and monetary policy independence', NBER Working Paper No. 21162.
Shin, H.S. (2017) 'The bank/capital markets nexus goes global', Bank for International Settlements Speech, January 15, 2017.

Cointegration Heatmap & Spread Table [EdgeTerminal]The Cointegration Heatmap is a powerful visual and quantitative tool designed to uncover deep, statistically meaningful relationships between assets.
Unlike traditional indicators that react to price movement, this tool analyzes the underlying statistical relationship between two time series and tracks when they diverge from their long-term equilibrium — offering actionable signals for mean-reversion trades .
What Is Cointegration?
Most traders are familiar with correlation, which measures how two assets move together in the short term. But correlation is shallow — it doesn’t imply a stable or predictable relationship over time.
Cointegration, however, is a deeper statistical concept: Two assets are cointegrated if a linear combination of their prices or returns is stationary , even if the individual series themselves are non-stationary.
Cointegration is a foundational concept in time series analysis, widely used by hedge funds, proprietary trading firms, and quantitative researchers. This indicator brings that institutional-grade concept into an easy-to-use and fully visual TradingView indicator.
This tool helps answer key questions like:
“Which stocks tend to move in sync over the long term?”
“When are two assets diverging beyond statistical norms?”
“Is now the right time to short one and long the other?”
Using a combination of regression analysis, residual modeling, and Z-score evaluation, this indicator surfaces opportunities where price relationships are stretched and likely to snap back — making it ideal for building low-risk, high-probability trade setups.
In simple terms:
Cointegrated assets drift apart temporarily, but always come back together over time. This behavior is the foundation of successful pairs trading.
How the Indicator Works
Cointegration Heatmap indicator works across any market supported on TradingView — from stocks and ETFs to cryptocurrencies and forex pairs.
You enter your list of symbols, choose a timeframe, and the indicator updates every bar with live cointegration scores, spread signals, and trade-ready insights.
Indicator Settings:
Symbol list: a customizable list of symbols separated by commas
Returns timeframe: time frame selection for return sampling (Weekly or Monthly)
Max periods: max periods to limit the data to a certain time and to control indicator performance
This indicator accomplishes three major goals in one streamlined package:
Identifies stable long-term relationships (cointegration) between assets, using a heatmap visualization.
Tracks the spread — the difference between actual prices and the predicted linear relationship — between each pair.
Generates trade signals based on Z-score deviations from the mean spread, helping traders know when a pair is statistically overextended and likely to mean revert.
The math:
Returns are calculated using spread tickers to ensure alignment in time and adjust for dividends, splits, and other inconsistencies.
For each unique pair of symbols, we perform a linear regression
Yt=α+βXt+ε
Then we compute the residuals (errors from the regression):
Spreadt=Yt−(α+βXt)
Calculate the standard deviation of the spread over a moving window (default: 100 samples) and finally, define the Cointegration Score:
S=1/Standard Deviation of Residuals
This means, the lower the deviation, the tighter the relationship, so higher scores indicate stronger cointegration.
Always remember that cointegration can break down so monitor the asset over time and over multiple different timeframes before making a decision.
How to use the indicator
The heatmap table:
The indicator displays 2 very important tables, one in the middle and one on the right side. After entering your symbols, the first table to pay attention to is the middle heatmap table.
Any assets with a cointegration value of 25% is something to pay attention to and have a strong and stable relationship. Anything below is weak and not tradable.
Additionally, the 40% level is another important line to cross. Assets that have a cointegration score of over 40% will most likely have an extremely strong relationship.
Think about it this way, the higher the percentage, the tighter and more statistically reliable the relationship is.
The spread table:
After finding a good asset pair using heatmap, locate the same pair in the spread table (right side).
Here’s what you’ll see on the table:
Spread: Current difference between the two symbols based on the regression fit
Mean: Historical average of that spread
Z-score: How far current spread is from the mean in standard deviations
Signal: Trade suggestion: Short, Long, or Neutral
Since you’re expecting mean reversion, the idea is that the spread will return to the average. You want to take a trade when the z-score is either over +2 or below -2 and exit when z-score returns to near 0.
You will usually see the trade suggestion on the spread chart but you can make your own decision based on your risk level.
Keep in mind that the Z-score for each pair refers to how off the first asset is from the mean compared to the second one, so for example if you see STOCKA vs STOCKB with a Z-score of -1.55, we are regressing STOCKB (Y) on STOCKA (X).
In this case, STOCKB is the quoted asset and STOCKA is the base asset.
In this case, this means that STOCKB is much lower than expected relative to STOCKA, so the trade would be a long position on stock B and short position on stock A.

Seasonality DOW CombinedOverall Purpose
This script analyzes historical daily returns based on two specific criteria:
Month of the year (January through December)
Day of the week (Sunday through Saturday)
It summarizes and visually displays the average historical performance of the selected asset by these criteria over multiple years.
Step-by-Step Breakdown
1. Initial Settings:
Defines minimum year (i_year_start) from which data analysis will start.
Ensures the user is using a daily timeframe, otherwise prompts an error.
Sets basic display preferences like text size and color schemes.
2. Data Collection and Variables:
Initializes matrices to store and aggregate returns data:
month_data_ and month_agg_: store monthly performance.
dow_data_ and dow_agg_: store day-of-week performance.
COUNT tracks total number of occurrences, and COUNT_POSITIVE tracks positive-return occurrences.
3. Return Calculation:
Calculates daily percentage change (chg_pct_) in price:
chg_pct_ = close / close - 1
Ensures it captures this data only for the specified years (year >= i_year_start).
4. Monthly Performance Calculation:
Each daily return is grouped by month:
matrix.set updates total returns per month.
The script tracks:
Monthly cumulative returns
Number of occurrences (how many days recorded per month)
Positive occurrences (days with positive returns)
5. Day-of-Week Performance Calculation:
Similarly, daily returns are also grouped by day-of-the-week (Sunday to Saturday):
Daily return values are summed per weekday.
The script tracks:
Cumulative returns per weekday
Number of occurrences per weekday
Positive occurrences per weekday
6. Visual Display (Tables):
The script creates two visual tables:
Left Table: Monthly Performance.
Right Table: Day-of-the-Week Performance.
For each table, it shows:
Yearly data for each month/day.
Summaries at the bottom:
SUM row: Shows total accumulated returns over all selected years for each month/day.
+ive row: Shows percentage (%) of times the month/day had positive returns, along with a tooltip displaying positive occurrences vs total occurrences.
Cells are color-coded:
Green for positive returns.
Red for negative returns.
Gray for neutral/no change.
7. Interpreting the Tables:
Monthly Table (left side):
Helps identify seasonal patterns (e.g., historically bullish/bearish months).
Day-of-Week Table (right side):
Helps detect recurring weekday patterns (e.g., historically bullish Mondays or bearish Fridays).
Practical Use:
Traders use this to:
Identify patterns based on historical data.
Inform trading strategies, e.g., avoiding historically bearish days/months or leveraging historically bullish periods.
Example Interpretation:
If the table shows consistently green (positive) for March and April, historically the asset tends to perform well during spring. Similarly, if the "Friday" column is often red, historically Fridays are bearish for this asset.

VOL & AVG OverlayCustom Session Volume Versus Average Volume
Description:
This indicator will create an overlay on your chart that will show you the following information:
Custom Session Volume
Average For Selected Session
Percentage Comparison
Options:
Set Custom Time Frame For Calculations
Set Custom Time Frame For Average Comparison
Set Custom Time Zone
Enable / Disable Each Value
Change Text Color
Change Background Color
Change Table location
Example:
Set indicator to 30 period average. Set custom time frame to 9:30am to 10:30am Eastern/New York.
When the time frame for the calculation is closed , the indicator will provide a comparison of the current days volume compared to the average of 30 previous days for that same time frame and display it as a percentage in the table.
In this example you could compare how the first hour of the trading day compares to the previous 30 day's average, aiding in evaluating the potential volume for the remainder of the day.
Notes:
Times must be entered in 24 hour format. (1pm = 13:00 etc.)
This indicator is for Intra-day time frames, not > Day.
If you prefer data in this format as opposed to a plotted line, check out my other indicator: ADR & ATR Overlay

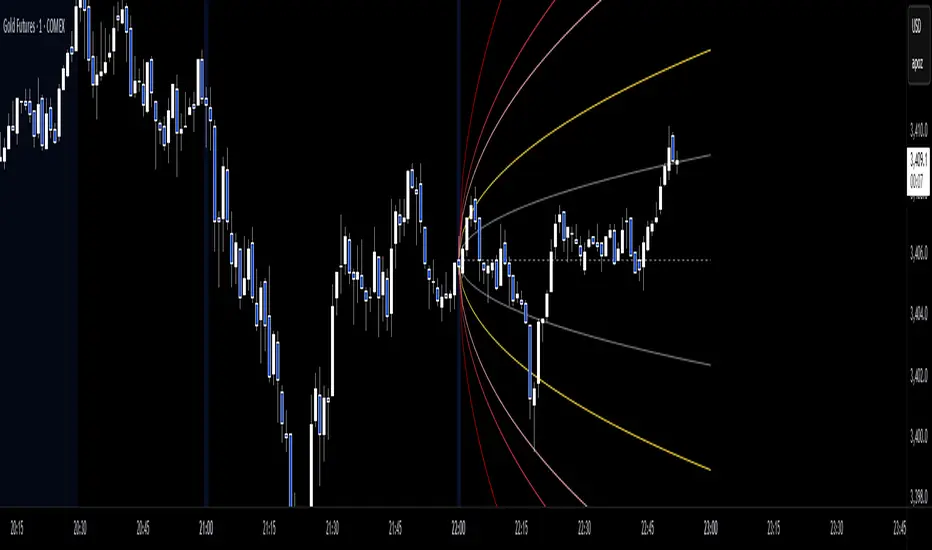
Simple Volatility ConeThe Simple Volatility Cone indicator projects the potential future price range of a stock based on recent volatility. It calculates rolling standard deviation from log returns over a defined window, then uses a confidence interval to estimate the upper and lower bounds the price could reach over a future time horizon. These bounds are plotted directly on the chart, offset into the future, allowing traders to visualize expected price dispersion under a geometric Brownian motion assumption. This tool is useful for risk management, trade planning, and visualizing the potential impact of volatility.

Anchored Probability Cone by TenozenFirst of all, credit to @nasu_is_gaji for the open source code of Log-Normal Price Forecast! He teaches me alot on how to use polylines and inverse normal distribution from his indicator, so check it out!
What is this indicator all about?
This indicator draws a probability cone that visualizes possible future price ranges with varying levels of statistical confidence using Inverse Normal Distribution , anchored to the start of a selected timeframe (4h, W, M, etc.)
Feutures:
Anchored Cone: Forecasts begin at the first bar of each chosen higher timeframe, offering a consistent point for analysis.
Drift & Volatility-Based Forecast: Uses log returns to estimate market volatility (smoothed using VWMA) and incorporates a trend angle that users can set manually.
Probabilistic Price Bands: Displays price ranges with 5 customizable confidence levels (e.g., 30%, 68%, 87%, 99%, 99,9%).
Dynamic Updating: Recalculates and redraws the cone at the start of each new anchor period.
How to use:
Choose the Anchored Timeframe (PineScript only be able to forecast 500 bars in the future, so if it doesn't plot, try adjusting to a lower anchored period).
You can set the Model Length, 100 sample is the default. The higher the sample size, the higher the bias towards the overall volatility. So better set the sample size in a balanced manner.
If the market is inside the 30% conifidence zone (gray color), most likely the market is sideways. If it's outside the 30% confidence zone, that means it would tend to trend and reach the other probability levels.
Always follow the trend, don't ever try to trade mean reversions if you don't know what you're doing, as mean reversion trades are riskier.
That's all guys! I hope this indicator helps! If there's any suggestions, I'm open for it! Thanks and goodluck on your trading journey!
Bitcoin Power Law OscillatorThis is the oscillator version of the script. The main body of the script can be found here.
Understanding the Bitcoin Power Law Model
Also called the Long-Term Bitcoin Power Law Model. The Bitcoin Power Law model tries to capture and predict Bitcoin's price growth over time. It assumes that Bitcoin's price follows an exponential growth pattern, where the price increases over time according to a mathematical relationship.
By fitting a power law to historical data, the model creates a trend line that represents this growth. It then generates additional parallel lines (support and resistance lines) to show potential price boundaries, helping to visualize where Bitcoin’s price could move within certain ranges.
In simple terms, the model helps us understand Bitcoin's general growth trajectory and provides a framework to visualize how its price could behave over the long term.
The Bitcoin Power Law has the following function:
Power Law = 10^(a + b * log10(d))
Consisting of the following parameters:
a: Power Law Intercept (default: -17.668).
b: Power Law Slope (default: 5.926).
d: Number of days since a reference point(calculated by counting bars from the reference point with an offset).
Explanation of the a and b parameters:
Roughly explained, the optimal values for the a and b parameters are determined through a process of linear regression on a log-log scale (after applying a logarithmic transformation to both the x and y axes). On this log-log scale, the power law relationship becomes linear, making it possible to apply linear regression. The best fit for the regression is then evaluated using metrics like the R-squared value, residual error analysis, and visual inspection. This process can be quite complex and is beyond the scope of this post.
Applying vertical shifts to generate the other lines:
Once the initial power-law is created, additional lines are generated by applying a vertical shift. This shift is achieved by adding a specific number of days (or years in case of this script) to the d-parameter. This creates new lines perfectly parallel to the initial power law with an added vertical shift, maintaining the same slope and intercept.
In the case of this script, shifts are made by adding +365 days, +2 * 365 days, +3 * 365 days, +4 * 365 days, and +5 * 365 days, effectively introducing one to five years of shifts. This results in a total of six Power Law lines, as outlined below (From lowest to highest):
Base Power Law Line (no shift)
1-year shifted line
2-year shifted line
3-year shifted line
4-year shifted line
5-year shifted line
The six power law lines:
Bitcoin Power Law Oscillator
This publication also includes the oscillator version of the Bitcoin Power Law. This version applies a logarithmic transformation to the price, Base Power Law Line, and 5-year shifted line using the formula: log10(x) .
The log-transformed price is then normalized using min-max normalization relative to the log-transformed Base Power Law Line and 5-year shifted line with the formula:
normalized price = log(close) - log(Base Power Law Line) / log(5-year shifted line) - log(Base Power Law Line)
Finally, the normalized price was multiplied by 5 to map its value between 0 and 5, aligning with the shifted lines.
Interpretation of the Bitcoin Power Law Model:
The shifted Power Law lines provide a framework for predicting Bitcoin's future price movements based on historical trends. These lines are created by applying a vertical shift to the initial Power Law line, with each shifted line representing a future time frame (e.g., 1 year, 2 years, 3 years, etc.).
By analyzing these shifted lines, users can make predictions about minimum price levels at specific future dates. For example, the 5-year shifted line will act as the main support level for Bitcoin’s price in 5 years, meaning that Bitcoin’s price should not fall below this line, ensuring that Bitcoin will be valued at least at this level by that time. Similarly, the 2-year shifted line will serve as the support line for Bitcoin's price in 2 years, establishing that the price should not drop below this line within that time frame.
On the other hand, the 5-year shifted line also functions as an absolute resistance , meaning Bitcoin's price will not exceed this line prior to the 5-year mark. This provides a prediction that Bitcoin cannot reach certain price levels before a specific date. For example, the price of Bitcoin is unlikely to reach $100,000 before 2021, and it will not exceed this price before the 5-year shifted line becomes relevant. After 2028, however, the price is predicted to never fall below $100,000, thanks to the support established by the shifted lines.
In essence, the shifted Power Law lines offer a way to predict both the minimum price levels that Bitcoin will hit by certain dates and the earliest dates by which certain price points will be reached. These lines help frame Bitcoin's potential future price range, offering insight into long-term price behavior and providing a guide for investors and analysts. Lets examine some examples:
Example 1:
In Example 1 it can be seen that point A on the 5-year shifted line acts as major resistance . Also it can be seen that 5 years later this price level now corresponds to the Base Power Law Line and acts as a major support at point B(Note: Vertical yearly grid lines have been added for this purpose👍).
Example 2:
In Example 2, the price level at point C on the 3-year shifted line becomes a major support three years later at point D, now aligning with the Base Power Law Line.
Finally, let's explore some future price predictions, as this script provides projections on the weekly timeframe :
Example 3:
In Example 3, the Bitcoin Power Law indicates that Bitcoin's price cannot surpass approximately $808K before 2030 as can be seen at point E, while also ensuring it will be at least $224K by then (point F).

Bitcoin Power LawThis is the main body version of the script. The Oscillator version can be found here.
Understanding the Bitcoin Power Law Model
Also called the Long-Term Bitcoin Power Law Model. The Bitcoin Power Law model tries to capture and predict Bitcoin's price growth over time. It assumes that Bitcoin's price follows an exponential growth pattern, where the price increases over time according to a mathematical relationship.
By fitting a power law to historical data, the model creates a trend line that represents this growth. It then generates additional parallel lines (support and resistance lines) to show potential price boundaries, helping to visualize where Bitcoin’s price could move within certain ranges.
In simple terms, the model helps us understand Bitcoin's general growth trajectory and provides a framework to visualize how its price could behave over the long term.
The Bitcoin Power Law has the following function:
Power Law = 10^(a + b * log10(d))
Consisting of the following parameters:
a: Power Law Intercept (default: -17.668).
b: Power Law Slope (default: 5.926).
d: Number of days since a reference point(calculated by counting bars from the reference point with an offset).
Explanation of the a and b parameters:
Roughly explained, the optimal values for the a and b parameters are determined through a process of linear regression on a log-log scale (after applying a logarithmic transformation to both the x and y axes). On this log-log scale, the power law relationship becomes linear, making it possible to apply linear regression. The best fit for the regression is then evaluated using metrics like the R-squared value, residual error analysis, and visual inspection. This process can be quite complex and is beyond the scope of this post.
Applying vertical shifts to generate the other lines:
Once the initial power-law is created, additional lines are generated by applying a vertical shift. This shift is achieved by adding a specific number of days (or years in case of this script) to the d-parameter. This creates new lines perfectly parallel to the initial power law with an added vertical shift, maintaining the same slope and intercept.
In the case of this script, shifts are made by adding +365 days, +2 * 365 days, +3 * 365 days, +4 * 365 days, and +5 * 365 days, effectively introducing one to five years of shifts. This results in a total of six Power Law lines, as outlined below (From lowest to highest):
Base Power Law Line (no shift)
1-year shifted line
2-year shifted line
3-year shifted line
4-year shifted line
5-year shifted line
The six power law lines:
Bitcoin Power Law Oscillator
This publication also includes the oscillator version of the Bitcoin Power Law. This version applies a logarithmic transformation to the price, Base Power Law Line, and 5-year shifted line using the formula: log10(x) .
The log-transformed price is then normalized using min-max normalization relative to the log-transformed Base Power Law Line and 5-year shifted line with the formula:
normalized price = log(close) - log(Base Power Law Line) / log(5-year shifted line) - log(Base Power Law Line)
Finally, the normalized price was multiplied by 5 to map its value between 0 and 5, aligning with the shifted lines.
Interpretation of the Bitcoin Power Law Model:
The shifted Power Law lines provide a framework for predicting Bitcoin's future price movements based on historical trends. These lines are created by applying a vertical shift to the initial Power Law line, with each shifted line representing a future time frame (e.g., 1 year, 2 years, 3 years, etc.).
By analyzing these shifted lines, users can make predictions about minimum price levels at specific future dates. For example, the 5-year shifted line will act as the main support level for Bitcoin’s price in 5 years, meaning that Bitcoin’s price should not fall below this line, ensuring that Bitcoin will be valued at least at this level by that time. Similarly, the 2-year shifted line will serve as the support line for Bitcoin's price in 2 years, establishing that the price should not drop below this line within that time frame.
On the other hand, the 5-year shifted line also functions as an absolute resistance , meaning Bitcoin's price will not exceed this line prior to the 5-year mark. This provides a prediction that Bitcoin cannot reach certain price levels before a specific date. For example, the price of Bitcoin is unlikely to reach $100,000 before 2021, and it will not exceed this price before the 5-year shifted line becomes relevant. After 2028, however, the price is predicted to never fall below $100,000, thanks to the support established by the shifted lines.
In essence, the shifted Power Law lines offer a way to predict both the minimum price levels that Bitcoin will hit by certain dates and the earliest dates by which certain price points will be reached. These lines help frame Bitcoin's potential future price range, offering insight into long-term price behavior and providing a guide for investors and analysts. Lets examine some examples:
Example 1:
In Example 1 it can be seen that point A on the 5-year shifted line acts as major resistance . Also it can be seen that 5 years later this price level now corresponds to the Base Power Law Line and acts as a major support at point B (Note: Vertical yearly grid lines have been added for this purpose👍).
Example 2:
In Example 2, the price level at point C on the 3-year shifted line becomes a major support three years later at point D, now aligning with the Base Power Law Line.
Finally, let's explore some future price predictions, as this script provides projections on the weekly timeframe :
Example 3:
In Example 3, the Bitcoin Power Law indicates that Bitcoin's price cannot surpass approximately $808K before 2030 as can be seen at point E, while also ensuring it will be at least $224K by then (point F).

ADX Z-Score OscillatorTitle: ADX Z-Score Oscillator
Description:
The ADX Z-Score Oscillator is a normalized version of the traditional Average Directional Index (ADX), designed to oscillate between fixed bounds for easier interpretation of trend strength. Instead of plotting the raw ADX line, this indicator calculates the Z-Score of the ADX relative to its recent average and standard deviation, allowing for consistent comparison over time and across different assets.
The Z-Score oscillates between fixed horizontal levels of +2 and -2, highlighting extreme values.
The orange line represents the current Z-Score of the ADX.
Horizontal reference lines at +2 (red), 0 (gray), and -2 (green) help define overbought/oversold or strong/weak trend zones.
A dynamic table on the chart shows the current Z-Score with color coding to indicate trend strength:
🔴 Z > 1.5 → Very strong trend
🟠 Z > 0.5 → Moderate trend
🔵 Z < -0.5 → Weakening or reversing trend
🟢 Z < -1.5 → Very weak trend or potential reversal zone
This transformation of the ADX into a bounded oscillator helps traders easily assess trend strength and changes in momentum without the ambiguity of varying ADX scale levels.

OBV Z-Score + Table📘 OBV Z-Score — Indicator Description
Overview
This indicator converts the On-Balance Volume (OBV) into a Z-Score oscillator, providing a normalized statistical view of volume flow strength relative to its recent history.
How It Works
OBV Calculation
The On-Balance Volume accumulates volume based on price direction, showing whether volume is flowing into or out of an asset.
Z-Score Transformation
The OBV values are normalized via Z-Score:
ini
Kopieren
Bearbeiten
Z = (OBV - Mean) / Standard Deviation
This reveals how unusually strong or weak volume momentum is compared to recent norms.
Smoothing
An optional moving average smoothing (SMA, EMA, VWMA, etc.) can be applied for cleaner signals.
Z-Score Table
A live Z-Score value is displayed in a table on the top-right of the indicator pane, clamped between +2 and -2:
+2 indicates unusually high positive volume momentum
-2 indicates unusually high negative volume momentum
How to Use It
Bullish Signal: Z-Score crossing above +1.5 or +2 signals strong buying volume pressure
Bearish Signal: Z-Score crossing below -1.5 or -2 signals strong selling volume pressure
Combine with Price Action: Use alongside price trends or other Z-Score indicators to improve decision making in SDCA or volume-based trading systems

Cumulative Volume Delta with Divergence🧠 Core Functionality:
1. Cumulative Volume Delta (CVD):
Purpose: Visualizes the difference between buying and selling pressure over time.
Mechanism:
It uses lower-timeframe volume delta data, retrieved from ta.requestVolumeDelta(), to build a candle-style visualization of the net volume movement.
Plotted candles show whether buying (up volume) or selling (down volume) was dominant within each period.
Teal candles: More buying than selling (CVD up).
Red candles: More selling than buying (CVD down).
Volume Source: Based on intrabar up/down volume approximation from lower timeframes.
🧭 Divergence Detection (New Feature):
2. Regular Bullish Divergence:
Condition:
Price makes a lower low.
CVD (lastVolume) makes a higher low.
Interpretation: Selling pressure is weakening despite price making new lows — a potential reversal signal to the upside.
Displayed As:
Green line and label "Bull" under the CVD at the divergence point.
3. Regular Bearish Divergence:
Condition:
Price makes a higher high.
CVD makes a lower high.
Interpretation: Buying pressure is fading despite price rising — a potential reversal signal to the downside.
Displayed As:
Red line and label "Bear" above the CVD at the divergence point.
🧰 User Controls:
Use custom timeframe: Overrides default volume delta resolution for finer or broader analysis.
Calculate Divergence: Turns the divergence detection on or off.
Adjustable via script inputs.
🔔 Alerts:
Two alert conditions are included:
One for bullish divergence.
One for bearish divergence.
Alerts trigger at the bar where the divergence is confirmed, not where it starts.
📈 Use Case:
This tool is ideal for traders looking to:
Spot early reversals or momentum shifts.
Combine volume analysis with price action.
Time entries or exits more accurately using volume-confirmed divergence.

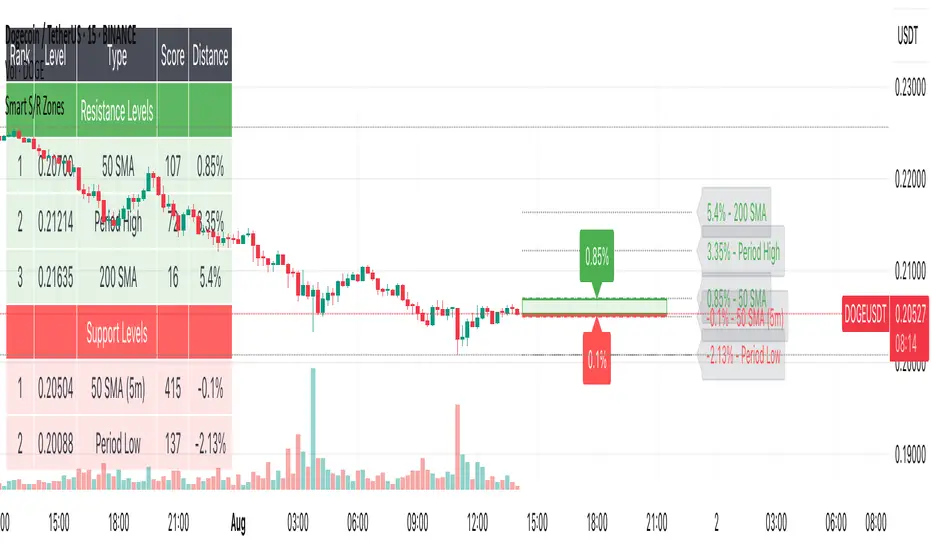
Smart S/R ZonesThis is not your average S/R script.
It combines proximity, bounce frequency, and volume clustering to automatically identify the most reliable support and resistance zones on your chart — no guesswork needed.
How It Works:
• Scans for recent highs/lows, SMA50 & SMA200, and pivot swing points
• Ranks each potential level using a weighted scoring system:
• Proximity to current price (50%)
• Bounce Count (30%) — how many times price respected that level
• Volume Score (20%) — how much volume traded around that level
• The top support and resistance levels are plotted with:
• Clear dashed lines
• Color-filled zones
• Simple percentage distance labels
Why This Script Stands Out:
• No settings to tweak — it just works
• Helps you react faster with high-confidence levels
• Adapts to any market: crypto, forex, stocks, indexes
• Ideal for both intraday and swing trading setups
Built-in Intelligence. Clean Visuals. Zero Noise.
UT Bot + Cooldown + Visual FVGSynopsis – UT Bot + Cooldown + Visual FVG
This TradingView script combines:
✅ UT Bot Reversal Signals
Based on ATR and volatility logic
BUY when trend flips from bearish to bullish
SELL when trend flips from bullish to bearish
✅ Cooldown Filter
Limits signals to 1 per X bars (default 30)
Prevents overtrading during choppy price action
✅ Optional FVG Markers (Fair Value Gaps)
Visually shows bullish or bearish imbalances (3-bar gaps)
Does not affect signal generation — only for confluence
🔍 Ideal for traders who want clean, time-filtered signals with visual price-action context. Suitable for futures, crypto, or forex on intraday charts.

Velez Price Action Signals (with 20 & 200 SMA)Velez Price Action Signals – With 20 & 200 SMA Overlay
This TradingView Pine Script is a clean and powerful reversal signal tool inspired by Oliver Velez’s price action philosophy, enhanced with trend context via two Simple Moving Averages.
🔍 Signal Logic
Buy Signal:
Current candle sweeps below the previous 5-bar low (liquidity grab).
Candle is bullish (close > open).
The lower wick is significantly larger than the body (e.g. ratio > 1.5).
Sell Signal:
Current candle sweeps above the previous 5-bar high.
Candle is bearish (close < open).
The upper wick is significantly larger than the body.
Signals appear as BUY/SELL labels on the chart (non-repainting).

Benner Cycles📜 Overview
The Benner Cycles indicator is a visually intuitive overlay that maps out one of the most historically referenced market timing models—Samuel T. Benner’s Cycles—directly onto your chart. This tool highlights three distinct types of market years: Panic, Peak, and Buy years, based on the rhythmic patterns first published by Benner in the late 19th century.
Benner's work is legendary among financial historians and cycle theorists. His original charts, dating back to the 1800s, remarkably anticipated economic booms, busts, and recoveries by following repeating year intervals. This modern adaptation brings that ancient rhythm into your TradingView workspace.
🔍 Background
Samuel T. Benner (1832–1913) was an Ohioan ironworks businessman and farmer who, after losing everything in the Panic of 1873, sought to uncover the secrets of economic cycles. His work led to the famous Benner's Cycle Chart, which forecasts business activity using repeatable intervals of panic, prosperity, and opportunity.
Benner’s method was based on a combination of numerological, agricultural, and empirical observations—not unlike early forms of technical and cyclical analysis. His legacy survives through a set of three rotating intervals for each market condition.
George Tritch was the individual responsible for preserving and publishing Samuel T. Benner’s economic cycle charts after Benner's death. While Benner was the original creator of the Benner Cycle, Tritch is known for reproducing and circulating the Benner chart in the early 20th century, helping it gain broader recognition among traders, economists, and financial historians.
🛠️ Features
Overlay Background Highlights shades the chart background to reflect the current year's cycle type
Configurable Year Range defines your own historical scope using Start Year and End Year
Fully Customizable Colors & Opacity
Live Statistics Table (optional) displays next projected Panic, Peak, and Buy years as well as current year’s market phase
Cycle Phase Logic (optional) prioritizes highlighting in order of Panic > Peak > Buy if overlaps occur
📈 Use Cases
Macro Timing Tool – Use the cycle phases to align with broader economic rhythms (especially useful for long-term investors or cycle traders).
Market Sentiment Guide – Panic years may coincide with recessions or major selloffs; Buy years may signal deep value or accumulation opportunities.
Overlay for Historical Studies – Perfect for comparing past major market movements (e.g., 1837, 1929, 2008) with their corresponding cycle phase. See known limitations below.
Forecasting Reference – Identify where we are in the repeating Benner rhythm and prepare for what's likely ahead.
⚠️ Limitations
❗ Not Predictive in Isolation: Use in conjunction with other tools.
❗ Calendar-Based Only: This indicator is strictly time-based and does not factor in price action, volume, or volatility.
❗ Historical Artifact, Not a Guarantee
❗ Data Availability: This indicator's historical output is constrained by the available price history of the underlying ticker. Therefore, it cannot display cycles prior to the earliest candle on the chart.

Trend Table ZeeZeeMonMulti-Timeframe Trend Indicator
Overview
This indicator identifies trends across multiple higher timeframes and displays them in a widget on the right side of the chart. It serves as an alternative trend-filtering tool, helping traders align with the dominant market direction. Unlike traditional moving average-based trend detection (e.g., price above/below a 200 MA), this indicator assesses whether higher timeframes are genuinely trending by analyzing swing highs and lows.
Trend Definition
Uptrend: Higher highs and higher lows.
Downtrend: Lower highs and lower lows.
A trend reversal occurs when a prior high/low is breached (e.g., in a downtrend, breaking the last high signals an uptrend).
Customization Options
Lookback Period: Adjusts the sensitivity for identifying swing highs/lows (pivot points). A shorter lookback detects more frequent pivots.
Historical Pivot Visibility: Toggle to display past swing highs/lows for verification.
Support/Resistance Lines: Show dynamic levels from recent pivots on higher timeframes. Breaching these lines indicates potential trend changes.
Purpose
Helps traders:
Confirm higher timeframe trends before entering trades.
Monitor proximity to trend reversals.
Fine-tune pivot sensitivity for optimal trend detection.
Note: Works best as a supplementary trend filter alongside other trading strategies.
