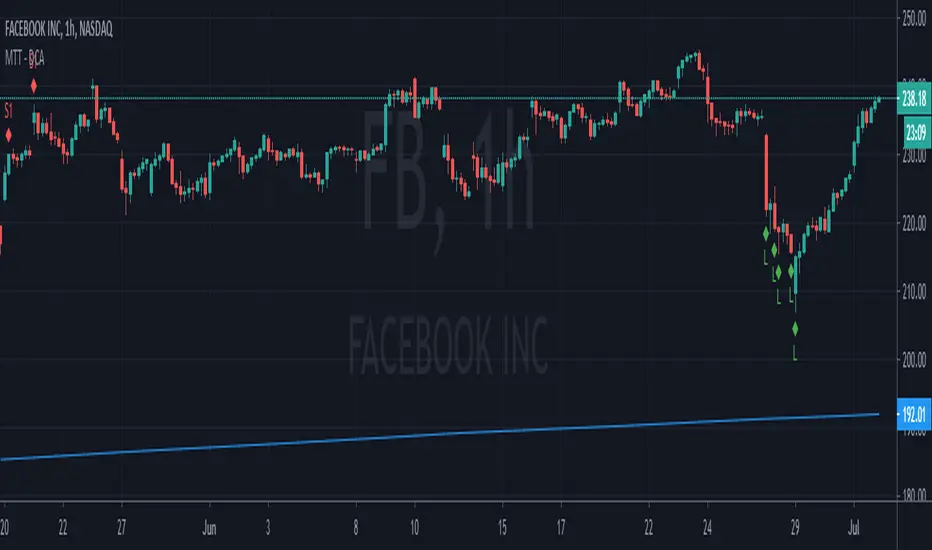
Market Trading Tools - BOOM DCAOur DCA tool is an indicator that is mostly based on RSI. The DCA tool is there to let you know where you should start averaging your entries or longing or shorting a financial asset. It can also give you an idea about when a market can start going the other way depending on the time frame you are using.
DCA will signal two different buy signals and two different sell signals L/L1 - S/S1. S is for Short and L is for long. These signals can be used according to your own desire, S1 and L1 are a condition and S and L are a condition, it is rare when both will occur close to each other but in some cases they can be close depending on market situation. The indicator algorithm is based on 2 indicators, when these two intersect, the signals will be fired once the conditions are met.
** Our Indicator does not repaint.
** It can be used on any financial market; crypto, stocks or forex. We also encourage using time frames as law as the 15 minutes and above. The use of a higher than 4hr time frame requires special settings and once you have access to it, you can change the parameters as you want. We have enabled our users to freely use the settings as they wish and to their on discretionary.
Once you are granted access to use it, add it from going into the scripts >> invite only scripts >> enable the indicator. Once the indicator is added to your chart you will see the indicator popping up on your chart.
We believe that we have not seen a similar indicator, and we are proud of our work and we will continue updating the indicator when we believe it is necessary according to market changes.
Good luck! and stay safe!
** If you are interested in this indicator, please use the link below to obtain access to it.
Futures
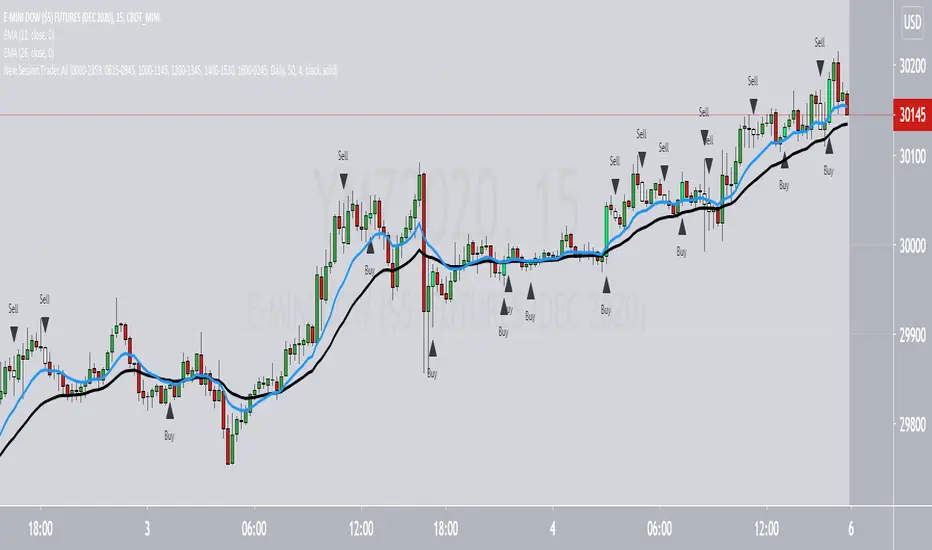
Session Trader2This is the second version of our work on developing signals for day trading stock index futures. In addition to finding signals that trade with the trend this script also looks for key reversal points during the day so that traders can now trade both ways. The signals are designed to operate on an intraday basis and have holding periods of 30 minutes or less. The script uses price action only as its signal generation trades rather than relying upon lagging indicator data. For info on how to obtain this scrip please see our signature file or message us directly on TV. We would be happy to show you.

Futures/Perpetuals DeltaBackwardation/Contango of OKEX, HUOBI, BITMEX, DERIBIT futures compared to XBTUSD.
Results indicate that backwardation can mark bottoms in price action.

Bitcoin Futures: Premium Discount Backwardation Contango [CR]Bitcoin Futures Premium Discount - Backwardation Contango
Cryptorhythms back at it again with another release for your quarantined pleasure! We've had this one in our back pocket for a few months adding new features and testing it out. Now its time to release it into the wild!
Intro
This indicator is used to capture additional profits by spread trading on futures contracts.
Description
This indicator is for members only and instructions will be given out upon becoming a member. It allows you to select from dozens of perpetual, futures and spot markets to compare, along with providing an info panel of many useful statistics and triggers.
How to get access?
You can get more information on joining by referring to my signature links. Members gain access to an entire suite of proven trading indicators and a supportive community of traders.

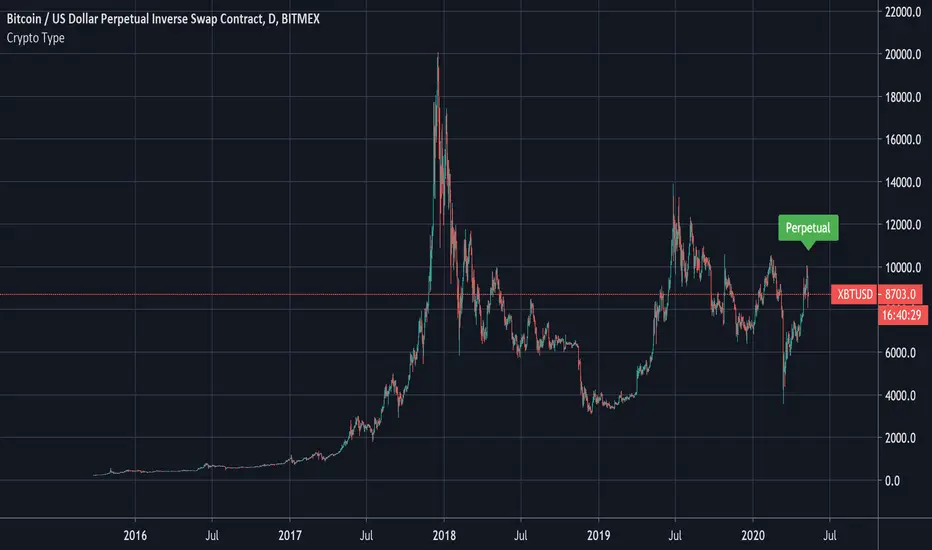
Crypto Type: Regular, Perpetual, Or Futures?A simple way to find out if the security in question is a regular, perpetual, or futures pair.
This reads the data of the security's description and sees if the word perpetual or futures is mentioned.
The method to check if a string has the letters we seek was first introduced by MichelT .
Thank you for checking this out and I hope this helps unlocking new hidden potential.
Session.TrdrThis a script designed to find continuation patterns on a variety of instruments but ideally on futures over short periods of time. The script can be used to trade trend over weekly and even monthly time frames but is best used for day trading. The script uses price action only as its key inputs highlighting the points during the trading day when the dominant flow has resumed. The script is designed to be traded on the 15M time frame for intra-day signals. To get access to the script please see the contact details in our signature.

Quarters, halves and roundiesThis indicator shows the quarters (25/75), halves (50) and roundies (00) between an upper and lower limit.
It is often used for futures ( CME_MINI:NQ1! or CME_MINI:ES1! ).
You can switch on/off the quarters (25/75) and choose a color for the lines.
Feel free to comment below if you like it, what you need to be improved or changed or whatever variations you wish!

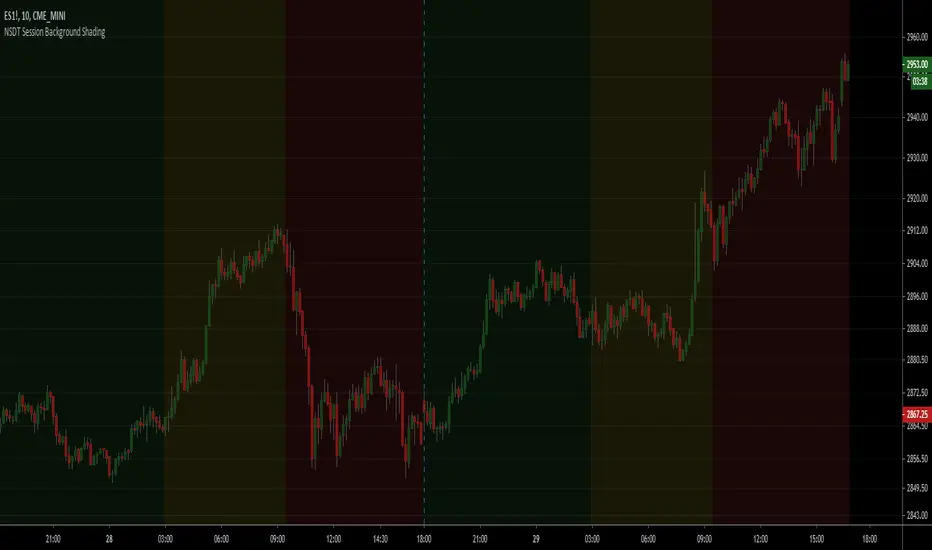
NSDT Session Background ShadingA simple script to add background colors to specific timeframes. Great for trading futures so you can separate sessions for easier viewing. Use for stocks to separate pre, open, and post market times.
There are three timeframes that can be set and all colors can be modified.
McMillan Volatility Bands w/ Buy & Sell Signals [optstrategist]BACKGROUND
McMillan Volatility Bands are an alternative approach to John Bollinger's "Bollinger Band" study and developed by world-renowned options trader and author Lawrence G. McMillan. Given his background in options trading, it was natural for Lawrence to approach any volatility-based study in the same manner options are priced --using Black-Scholes model. This model of pricing assumes a financial asset's volatility should be measured in percentage change rather than absolute value change.
OVERVIEW
The McMillan Volatility Bands indicator for TradingView will plot the 3 and 4-standard deviation bands around a 20-day moving average. This is how Larry has always used this system. The user can, however, change the standard deviation value as well as the moving average length to their preferred setting. This indicator can be used on any asset and on any timeframe.
Furthermore, the indicator will plot buy and sell signals based on a trading system used by Larry in his flagship newsletter publication The Daily Strategist. The system gives a signal when price closes outside the 4-sigma band and then closes back within the 3-sigma band. That 'signal bar' will be colored red or green for a sell or buy signal setup, respectively.
Finally, an arrow will be plotted on the chart where the system would actually enter the trade. This is determined when price trades a little beyond the extreme of the 'signal bar'. The level by which price has to go beyond the 'signal bar' is an input parameter and can be adjusted by the user. We've chosen the default value of 0.34. This means, the indicator will not give a buy or sell entry until the price moves: 1/3 x beyond the extreme signal bar. This is to prevent getting whipsawed by some setups that never really move in your favor. We've found it successfully removes the less-valuable trade setups.
PARAMETERS
ma_length => length of the moving average that the volatility bands work off of
outside_sigma => standard deviation of outer volatility band
inside_sigma => standard deviation of inner volatility band
entry_trigger_cushion => this refers to the percentage of the signal bar's range. The default value is 0.34. This means price will need to move 1/3 (~34%) of the signal bar's range beyond the high (for a buy) or low (for a sell) of the signal bar to trigger a buy/sell entry. This entry plots the arrow on the chart. We have found requiring this extra move in price eliminates many of the less-desirable signals at the expense of entering the better signals a little later.
WANT TO PURCHASE OR NEED MORE INFORMATION ON McMILLAN VOLATILITY BANDS?
Visit the link below to see purchasing options as well as screenshots of the indicator and how we trade it at McMillan Analysis Corp.

Price CorrelationsThis indicator shows price correlations of your current chart to various well-known indices.
Values above 0 mean a positive correlation, below 0 a negative correlation (not correlated).
It works well with daily candle charts and above, but you may also try it on 1h candles.
The default indices:
- Gold
- S&p 500
- Mini Dow Jones
- Dow Jones
- Russel 2000
- Nasdaq 100
- Crude Oil
- Nikkei 225 (Japan)
- FTSE 100 (UK)
- Silver
- DAX Futures (DE)
You can change the defaults to compare prices with other indices or stocks.

Bitcoin future premiumsThis shows the actual premium or the deviation between chosen active bitcoin futures and the bitcoin perpetual price as a representation of the underlying bitcoin price.
It's centered around zero meaning the futureprice and the perpetual contract are the same.
This simple indicator can for example be used to indentify sentiment in the market.
Please make sure you fill out active contracts in the settings for this indicator to work.
XBT % ContangoSimilar to my other indicators, but measures XBTUSD Contango in terms of percent.
Also, built it so you could change the values that give the red and green signals. Default values are 0% or less (backwardation) indicates green. However, i found that a 0.5% setting worked will finding local bottoms for current contract of XBTH20 (March 2020). The upper value default is at 5%, and signals red when the next contract reaches over 5%.
My assumption is as BTC increases in value over time, measuring contango in terms of percent will be a better measure of the XBT futures curve.

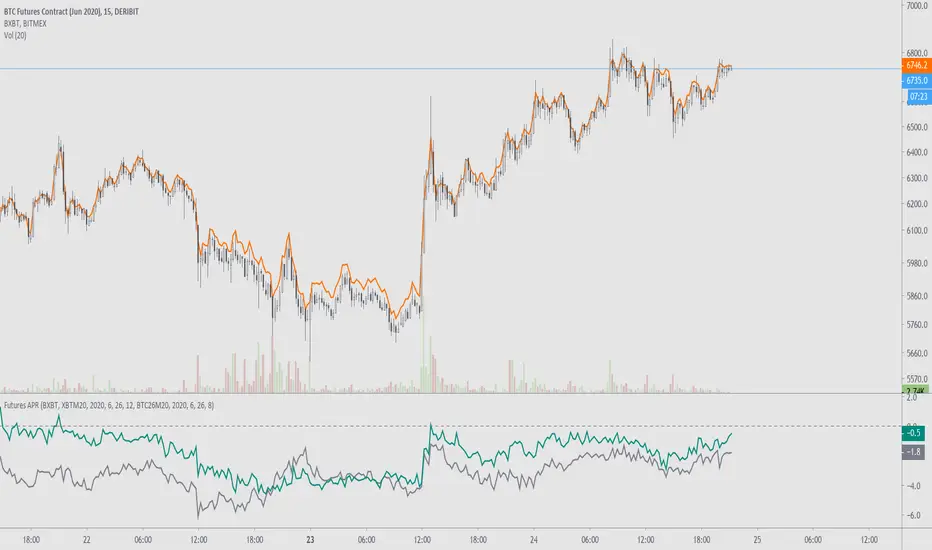
Futures APRFutures basis % for any ticker.
Requires: an index to compare against, the futures ticker, and the expiration year/month/day/hour. Optional second ticker to compare with.
Example explanation using bitcoin futures:
For Deribit, their futures expire at 0800UTC and the ticker will show the date of expiration. For example, BTC27H20's expiration is the 27th of March, 2020, at 0800UTC. For BitMEX, their futures expire at 1200UTC and have the same expiration dates.
www.deribit.com
"3 and 6 months quarterly of the March, June, September, December cycle; Quarterly futures expire the last Friday of each calendar quarter at 08.00 UTC."
www.bitmex.com
Archived page here: archive.is
"This contract settles on the .BXBT30M Index value as of the Jun 26, 5:00 AM (12:00:00 PM UTC)."
Once the June 2020 contract does expire you can always replace "XBTM20" with the currently running contract.
Notes on futures charts that never expire:
For OKEx, their futures charts are continuous, meaning that the indicator's values won't be accurate past prior expirations. This will be the same for other continuous futures charts such as BTC1!. This is because they are displaying previously expired contracts combined together.
Bitcoin Futures SentimentMonitors the sentiment across Bitcoin Futures, large discrepancies indicate potential low risk (buy/green) and high risk (sell/red) zones.


Trendy Bar Trend ColorTrendy Bar Trend Color
Inspired by trend candlestick charts on other trading platforms. Changes bar colors to stay in trend much like Heikin Ashi candles without the ATR price distortion. This is done by comparing the HL2 and/or Open-Close values of current candlestick to the prior candlestick.

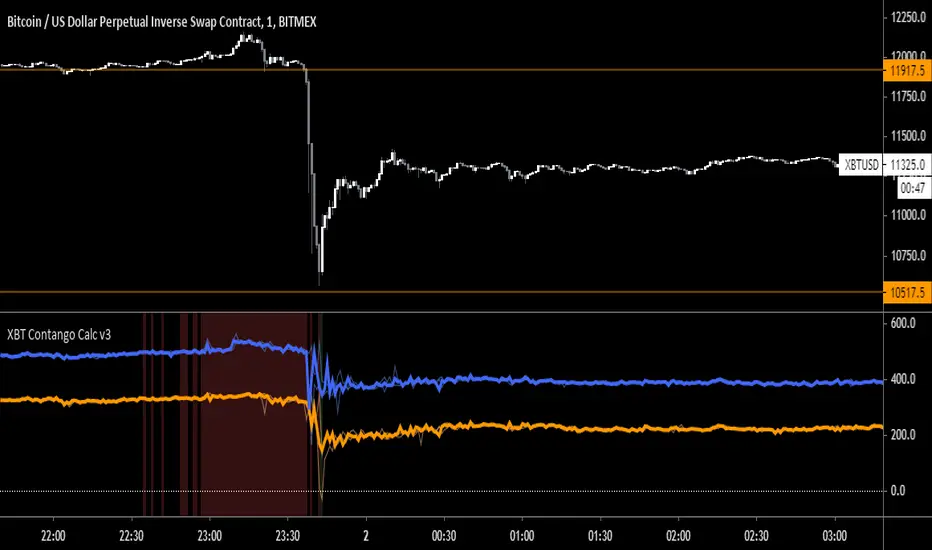
Deribit Contango Calculator v3Same as XBT Contango Calc V3, however built specifically for Deribit Futures . See link to XBT Contango Calc V3 for full description.
Above is capture of how this indicator performed on December Futures Contract BTC27Z19, since I assume I will loose this as the main chart when I update to June contract
Current (Dec. 2019) futures contracts are as follows:
Blue = BTC26M20
Orange = BTC27H20

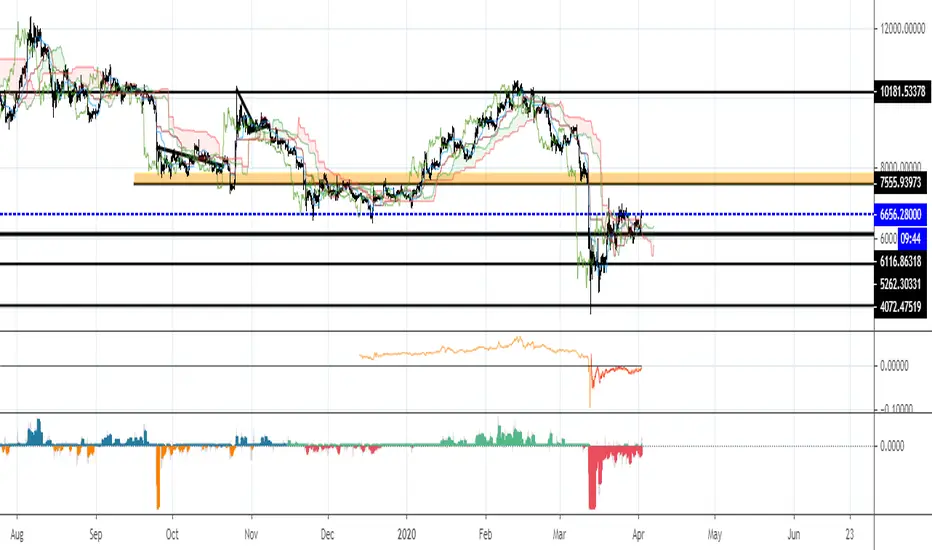
XBT Contango Calculator v3Since creating the first version of the XBT Contango Calculator, I found that the first version is good a calculating contango and backwardation in real time, however does not do a good job of capturing historical data of brief moves. Since backwardation moves are often brief, and since the first version Contango Calc was based on candlestick closes, it did not do a good job of recording the move after it occurred.
It took me a couple versions to try and fix this an eventually settled on version 3 which I have been using on my own for the last few months. You can see in the comparison chart above it does a much better job of capturing backwardation moves and extreme contango. Below is a comparison of how it performed vs. Version 1 during December futures XBTZ19
In addition I have added high/low lines that can be used to understand the amount that futures premium/discount has moved in a specific time frame. For example, the big drop Bitcoin had on September 24th, XBTZ19 went from +$273 contango to -$247 backwardation = $520 move! This move was in addition to the spot price move which was almost -$1,700 from high to low and -$1,100 from open to close. See below:
The high/low lines can also be removed from the chart by unchecking a box in the input tab.
The last update is the ability to lock the spot price to be XBT (index) no matter what chart you pull up. This can be useful if evaluation XBT futures correlation to other bitcoin derivatives such as GBTC or CME futures. You can also disable this feature in the input tab, which will then just calculate based on the current chart you are viewing.
Current Contracts (December 2019)
Blue = XBTM20
Orange = XBTH20
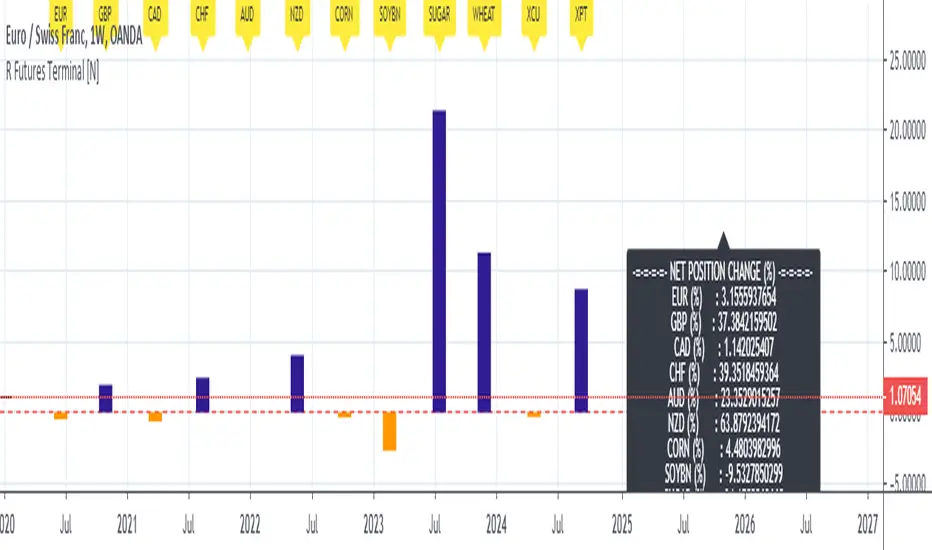
Live Mini Terminal 3 : Relative Forex & Futures Change DataThis script displays relative data changes occurring in the adjustable period and/or adaptive automatic period in the rest liquid futures.
It was inspired by the data terminals used by commercial traders.
Period selection can be set in the menu.
This script uses the adaptive period algorithm used by Autonomous LSTM and Relativity scripts.
Or you can set the period manually from the menu.
For more information about adaptive period:
This script works only for 1 day (1D) and 1 week (1W) time frames.
Since COT data is used, the most efficient time frame is 1 week (1W) .
Features
Value changes on a percentage basis (%)
Commitment of Traders position changes on a percentage basis :
Net position percentage is calculated as Short - Long and there is no inverse relationship.
Direct relationship is provided.
Due to the advantage of movement, future data were drawn instead of spot values on the required instruments.
The script provides the opportunity to comment on all major and minor Forex parities with liquid futures.
INSTRUMENTS
Euro Futures (EURUSD)
British Pound Futures (GBPUSD)
Canadian Dollar Futures (CADUSD)
Swiss Franc Futures (CHFUSD)
Australian Dollar Futures (AUDUSD)
New Zealand Dollar Futures (NZDUSD)
Corn Futures
Soybeans Futures
Sugar Futures
Wheat Futures
Copper Futures (XCU)
Platinum Futures (XPT)
Position Change InfoPanel
Position definition for the related instruments and data were taken and the calculations were made.
USAGE
The script can be used as an indicator by putting it under the chart as shown above.
It is necessary to enlarge to see clearly.
Since it is not often looked at, such use under chart is the best method for healthy interpretation.
Regards.
Syminfo.TypeHello traders
Earlier this week I discovered a new built-in variable called syminfo.type
What is it for?
This variable returns the type of the current symbol. Possible values are cfd, stock, futures, indices, forex, crypto, fund.
Cool bro but... should we care?
Well... we all should. Imagine you have a generic script and you want a different configuration whether you're trading FOREX or Crypto .
I designed a dummy example in that script that will preset the inputs according to the asset type from the chart.
Here I want 12/26/9 for forex and 20/50/50 for crypto - 30/60/90 otherwise
Quick caveat
It seems that for any crypto asset, syminfo.type returns "bitcoin". TradingView will fix it at some point but wanted to give you the heads-up regardless
Enjoy and all the BEST ^^
--
Dave

NCTA Trend BiasTrend Bias
The NCTA Trend Bias indicator is designed to show traders the overall directional bias of the market. It is excellent in short 1, 3, and 5 minute timeframes for futures traders and short term options traders. Longer timeframes such as the 5, 10, and 30 minute timeframes work well for options traders.
This indicator is used by displaying it twice on the chart. For 1, 3, and 5 minute charts, one of the Trend Bias indicators is set at Fast and the other is set at Medium.
For 30 min or higher charts, one Trend Bias Indicator is set at Medium and the other one is set at Slow.
The indicator consists of three trend lines; a fast signal, a medium signal, and a slow signal. There is a possible trade entry when the fast signal crosses either the medium and/or slow signals.
HOW TO USE: The most effective way to use this indicator is to have it displayed twice, using the settings described above for the relevant chart timeframe.
When both indicators show the fast line (blue line) crossing above the medium (red) or the slow (green) line, it implies an opportunity to go long or buy a call. When both indicators show the fast line crossing below the medium and/or slow line, it implies an opportunity to go short or buy a put.
The Trend Bias Indicator also provides a powerful directional bias entry when used in alignment with the Awesome Oscillator. Green AO aligned with a long Trend Bias entry or red AO aligned with a short Trend Bias entry.
For information on gaining access to this indicator, please see the link below in our signature field.
RTYZ2019
NASDAQ:AMZN

ANN Forecast MACD [Noldo] In this script, I tried to convert ANN MACD to MACD Forecast.
It took me quite a while, but it was fun.
After selecting the ticker, select the instrument from the menu and the system will automatically turn on the appropriate Forecast MACD system.
The system is trained with ANN values of ANN MACD 25 in 1.
But because the system is overloaded, only the most popular instruments are left.
The others were unfortunately eliminated.
The only difference is that it was built on the forecast algorithm of my own creation.
The Forecast algorithm is not open-source.
The codes are a nice framework for some of my most valuable systems about ANN . (Working on them. )
But I'm never remove this script.
You can use it forever for free.
As you can see in the presentation, although it is in the same period, it is more accurate and agile than normal MACD.
I think even a bar is important in trade.
For those who don't see that command,listed instruments with alternative tickers and error rates:
WTI : West Texas Intermediate (WTICOUSD , USOIL , CL1! ) Average error : 0.007593
BRENT : Brent Crude Oil ( BCOUSD , UKOIL , BB1! ) Average error : 0.006591
GOLD : XAUUSD , GOLD , GC1! Average error : 0.012767
SP500 : S&P 500 Index ( SPX500USD , SP1! ) Average error : 0.011650
EURUSD : Eurodollar ( EURUSD , 6E1! , FCEU1!) Average error : 0.005500
ETHUSD : Ethereum ( ETHUSD , ETHUSDT ) Average error : 0.009378
BTCUSD : Bitcoin ( BTCUSD , BTCUSDT , XBTUSD , BTC1! ) Average error : 0.01050
GBPUSD : British Pound ( GBPUSD , 6B1! , GBP1!) Average error : 0.009999
USDJPY : US Dollar / Japanese Yen ( USDJPY , FCUY1!) Average error : 0.009198
USDCHF : US Dollar / Swiss Franc ( USDCHF , FCUF1! ) Average error : 0.009999
USDCAD : Us Dollar / Canadian Dollar ( USDCAD ) Average error : 0.012162
SOYBNUSD : Soybean ( SOYBNUSD , ZS1! ) Average error : 0.010000
CORNUSD : Corn ( ZC1! ) Average error : 0.007574
NATGASUSD : Natural Gas ( NATGASUSD , NG1! ) Average error : 0.010000
SUGARUSD : Sugar ( SUGARUSD , SB1! ) Average error : 0.011081
WHEATUSD : Wheat ( WHEATUSD , ZW1! ) Average error : 0.009980
XPTUSD : Platinum ( XPTUSD , PL1! ) Average error : 0.009964
XU030 : Borsa Istanbul 30 Futures ( XU030 , XU030D1! ) Average error : 0.010727
VIX : S & P 500 Volatility Index (VX1! , VIX ) Average error : 0.009999
ES : S&P 500 E-Mini Futures ( ES1! ) Average error : 0.010709
SSE : Shangai Stock Exchange Composite (Index ) ( 000001 ) Average error : 0.011287
XRPUSD : Ripple (XRPUSD , XRPUSDT ) Average error : 0.009803
Extras :
- Crossover and crossunder alerts
- Switchable barcolor
NOTE :
Australian Dollar / US Dollar (AUDUSD ) removed due to high average error. (Average error > 0.013 )
Timeframe advice :
I suggest you to use that system TF >= 1D
My favorite is 1 week bars. (1W)
Info about forecast series :
www.sciencedirect.com
Special thanks :
Special thanks to dear wroclai for his great effort .
