Intraday

Triangular Moving Average (TMA) bandsWhat in the world is up folks ??!??
Here's the indicator of the day. Sharing a simple one today because I'm busy coding for a few clients (fun life of a top script author on TradingView)
The TMA bands is an indicator that I discovered on FXCM a few years ago FXCM TMA bands
From the screenshot above, we see that when the price hits the lower band, it's a possible reverse BUY signal. When it hits the upper band, it's a possible SELL signal
Methodology
1) The Take Profit 1 is the middle line, Take Profit 2 is the opposite band.
2) Once the TP1 is hit, set your Stop Loss to breakeven
3) Once the TP2 is hit, if you still want to stay in the trade, set your Stop Loss to the TP1
That's what we call a trailing stop loss which I offered in the Trade Manager : Trade-Manager-Open-Source-Version/
It will be a powerful tool in your arsenal for some scalp/intraday trades
After years of coding for traders, I worked with many brokers/API/languages so I'm very used to convert a script from a broker to another one (shameless self-advertising)
PS
Tomorrow I'll share the Signal version of my Algorithm Builder:
You'll be able to connect it in a single click to a very cool Backtest System made by the Pinescripters community
In other words, I'm selling the scripts to allow you to build your own signals in a few clicks AND to connect it easily to a kick-ass backtesting tool. More to come tomorrow
Hope you'll like it, like me, love it, love me, tip me :)
____________________________________________________________
Feel free to hit the thumbs up as it shows me that I'm not doing this for nothing and will motivate to deliver more quality content in the future. (Meaning... a few likes only = no indicators = Dave enjoying the beach)
- I'm an officially approved PineEditor/LUA/MT4 approved mentor on codementor. You can request a coaching with me if you want and I'll teach you how to build kick-ass indicators and strategies
Jump on a 1 to 1 coaching with me
- You can also hire for a custom dev of your indicator/strategy/bot/chrome extension/python

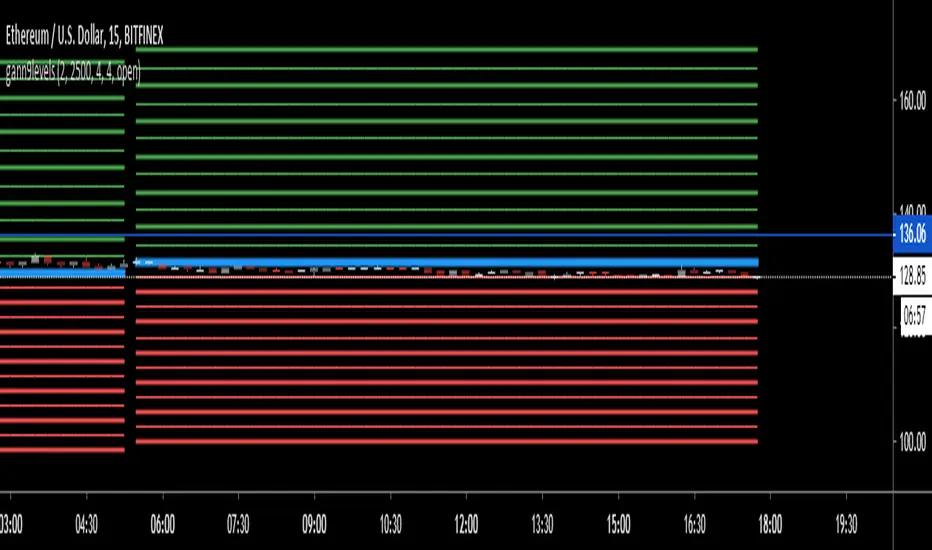
Pivot LevelsThis indicator automatically plots 3 important "Pivot Levels" to watch when day trading.
This simple but effective tool plots out important levels from the prior trading day, and updates every day. I noticed that significant levels such as the close, the high, and the low from the prior day often serve as important support/resistance levels in the future.
The previous day high is displayed as the green line, the close is displayed as the white line, and the low is plotted as the red line.
Enjoy!

Naresh - iJPASIMPORTANT NOTE
This strategy has been developed as a professional service. It was published only or testing and verification by the customer. As such, access cannot be granted to anyone else. Sorry about that!
Other open source scripts are available on the BacktestRookies profile.
Intra-day Japanese Candlestick Price Action Strategy
An intraday strategy which focuses on analyzing price action of the opening 3 bars to make trading decisions.
Once certain criteria are met, entry and exit targets are set and left until they are hit else we reset and start again on a new day.

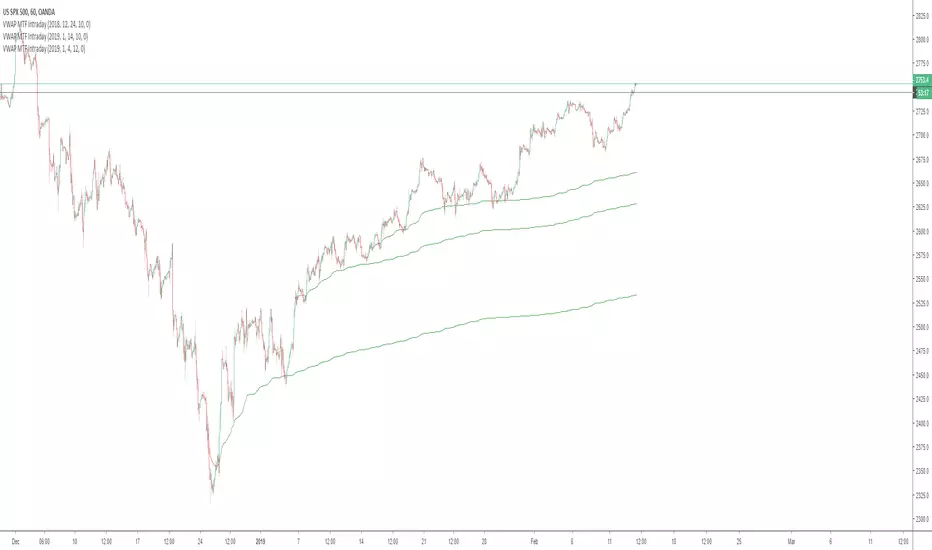
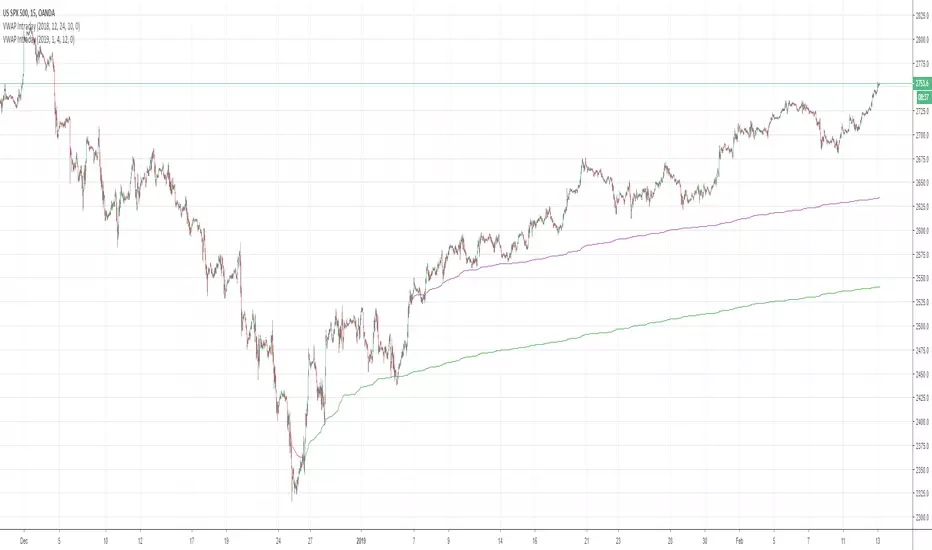
Custom Anchored VWAP Offset V2This is the anchored VWAP with offset option which can be used on any timeframe, including intraday.


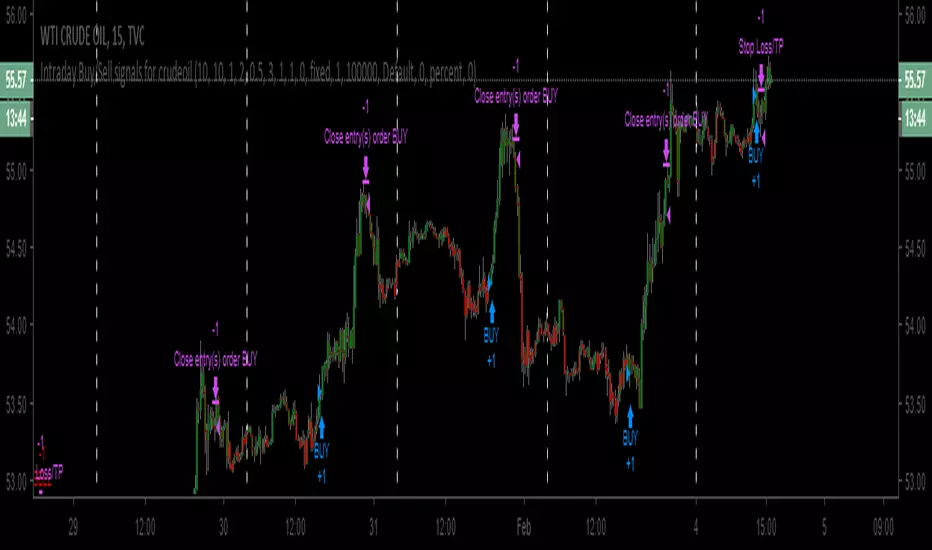
Intraday Buy/Sell signals for CrudeoilHi Everyone,
This is higly tuned intraday Buy/Signal generator for Crudeoil. It works on any time frames below 30 mins. But, the best setting is 15 mins.
How to use:
1. Just, apply this strategy to your crudeoil WTI instrument
2. Set your time frame to 15 mins
3. Buy the instrument whenever buy signal generates / Sell the intrument whenever buy singal generates
4. Strategy itself has 0.5% stop loss generating signals. But, create stop loss of 0.5% after buying/selling the instrument
5. Finally, whenever close signals triggers, just close the trade.
Note: Please try with only one lot at the beginning. If everything goes well after testing, mulitple lot can be used.
Disclaimer:
This strategy is for testing purpose only. Any profit/loss to the user's capitla is subject to market risk. And, the creator of this script is no where responsible.
Intraday System V.3This indicator good for Intraday. It'll give signal through colours. Go long when green colour appears and go short when red colour appear.
Take a trade on candle high above (long) and low below (short). I've made few modification from Mr.Johnman scripts for Better results for Indian traders. Thanks to him.
For Target and stop loss ;
Open Renko chart from your broker trading platform and find the Renko bar settings, here you'll find "Set Range". Those value will be your SL & Target.
Make sure take a trade above / below candle once colours appears.
With Regard's
Kaliyamoorthi
Just Believe Trading Community.

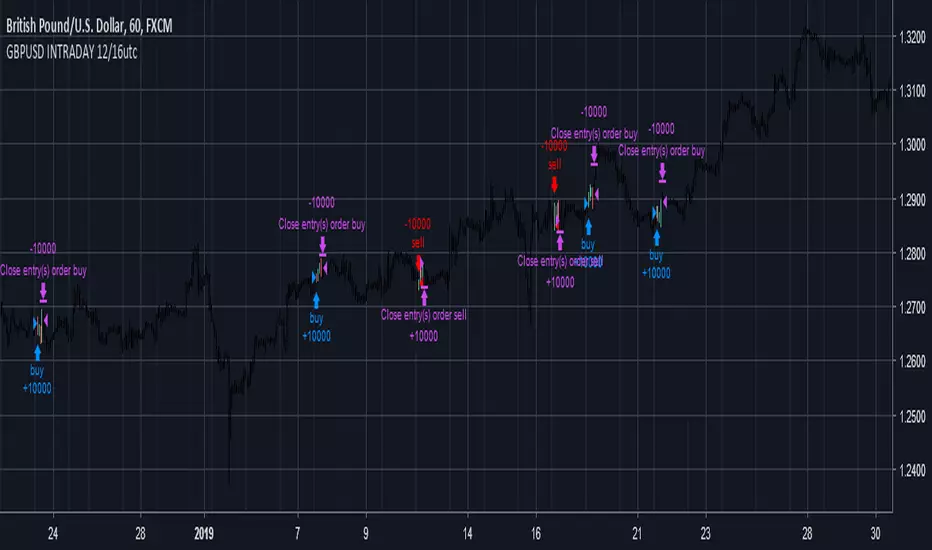
GBPUSD INTRADAY 12/16utcHi guys,
this is my new super easy strategy, on GBPUSD 1 hour chart it gives its best.
12-16utc means: at 12 utc watch the chart to see if to open a position (long or short). If a position has been opened close at 16utc.
So basically you have only to rememeber to check the chart at 12 utc. You can set a SL @50pips, and a TP @100pips, but the strategy runs without them, so feel free to use them or not.
This strategy has an "easy view mode": you can choose wether use it on mobile chart to have a better view. Using "easy view" you will see only the bars in trading session from 12 to 16 utc. Otherwise you can have the reguar chart.
Subscribe for only 20€/month and
Enjoy your Wallet!
Tari
ATR+VWAP Alert//These signals mostly consist of crossovers between a 13 VWMA and a 62 VWMA. I've found these two moving averages to be quite special in their ability to
//recognize a quick trend using volume data. The VWAP is used in the alert system as well, to give some perspective on which direction we are looking to take. We
//are also using ATR. We only take trades when the ATR is on the move, meaning we have a chance to catch a volatile move! Finally, we use RSI to help weed out bad
//trades. We only take 'longs' with bullish readings from RSI, and we only take 'shorts' with bearish readings from RSI. These alerts are fantastic for catching quick intraday
//trades in either direction. I recommend using a small 'take profit' target rather than using an exit indicator. These trades can move 20-30 pips and reverse just as quickly. Good luck!
//How To Use:
//When the alert system is added to the chart, you will notice up/down symbols appear at various locations. For bullish alerts, right click an 'Up' symbol and choose 'Add Alert on VWap & ATR..'
//There are two condition options. 'Long/short', and right below that 'Buy-Signal/Sell-Signal'. Choose 'long' and 'Buy-Signal'. At options, choose 'Once Per Bar Close'. Design your alert, and you're good to go.
//For bearish signals, find a 'down' signal on the chart. Right click and follow the same process, except choosing 'short/Sell-Signal' conditions.
Tips:
Use VWAP as a stop-loss. If a candle closes below/above the VWAP in the direction against you.. get out of the trade. The losses will be minimal and few compared to the wins. Use discretion and trade carefully. This works great with crypto. Invent your own exit. If you come up with a clever exit, please share!
You can contact me at my Discord!
discord.gg

SampleInvitePublish - V1
This strategy is designed for trading stocks and crypto currencies on the long side.
It uses three different timeframes to determine the most profitable entry prices (Day, 4 hour and chart interval).
The strategy employs ten different setups to accommodate both range trading and trend following markets.
The system contains sophisticated algorithms that scale to varies chart intervals.
Tailored to perform best between 4 hours to as low as 10 minutes.
The entire system consists of three tools: HullbusterScope, HullbusterBacktest and HullbusterSignal.
Hullbuster scope is used to obtain configuration information about the market instrument which will be applied to the HullbusterBacktest.
Commit an iterative approach to the backtest tool until the simulated results match your entry and exit expectations .
Apply the HullbusterSignal to the chart and use the same backtest configuration to setup actual trading alerts.

Oscillator Strategy for Scalping (BITMEX Swaps btc + eth)This is short selling strategy for BITMEX's XBTUSD and ETHUSD swaps scalping.
Made specifically for 3M XBTUSD and 3M-5M ETHUSD timeframe trading.
Not gonna open all the details, but it works mostly on bear divergences and moving averages.
On premium it shows 10000 bars back on 3minute timeframe and over that period(3 weeks aprox) XBTUSD had 28 trades and ETHUSD had 25(+17 on 5M timeframe) trades with that strategy.
How to trade it and setups that i use for manual trading:
1: You can use it to confirm your bias. Sell signal appears + price tries to retake previous resistance = most likely it will fail.
2. Sell signal after wick up suggests that you are likely to get filled at the top.
Your main target should be this moving average. Basically sell signal appears at resistance/near one and moving average represents current line of support. So when you enter short you should be eyeing this MA as your exit/target. Yes, there is a good possibility that support wount hold and this is a bear market we talking about BUT it is 3M bot oriented trading strategy, dont forget about and dont hold for too long to find yourself with price lending on MA and jumping from it.
This strategy does not have a defined stop, rather it suggests you to calculate it based on entry (provided) and target (provided).
Here is what i usually do to calculate my risks. My reward is a move to line of support, my stop is usually 1R, winrate is much higher than 50% so i feel good about it. Entry either at sell signal or at wick. Wicks not always get runned, but they provide incredible r/r setups.
Free trial for 36 hours for this one.

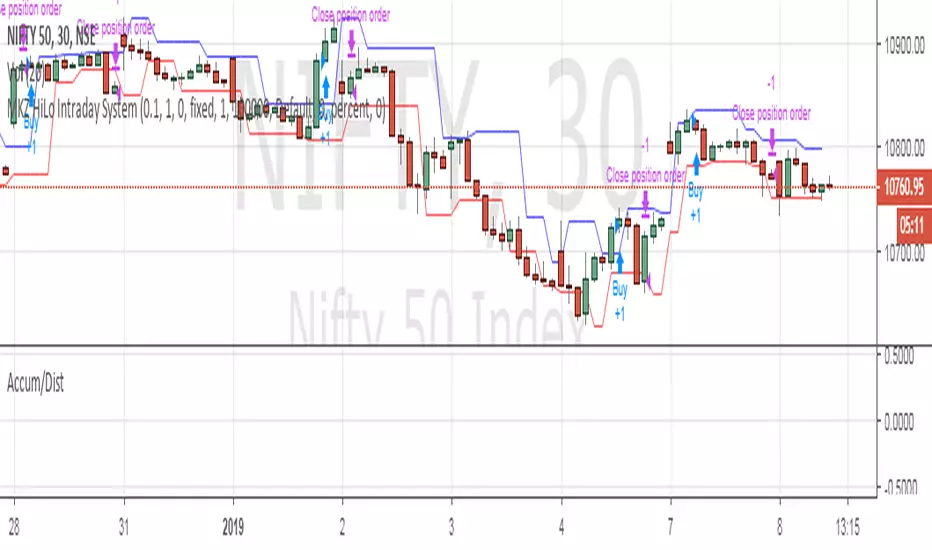
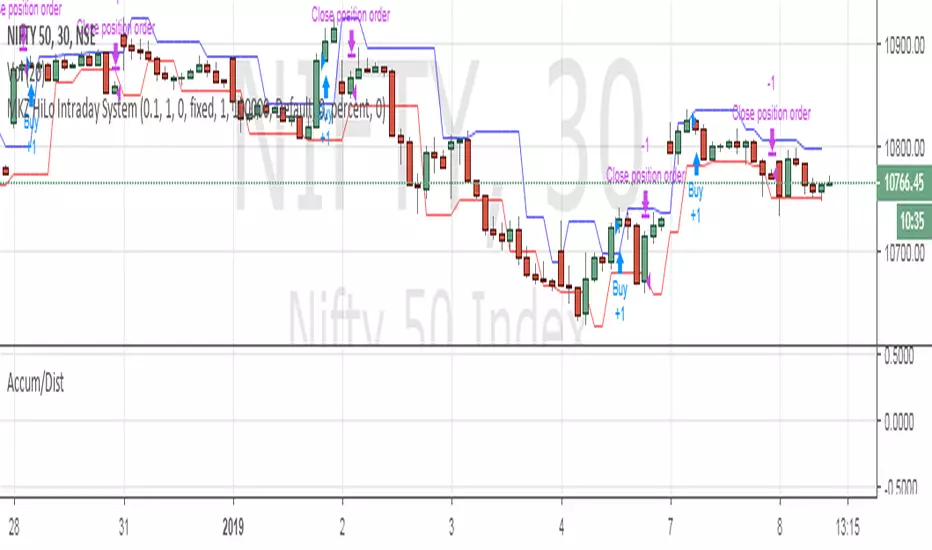
MKZ HiLo Intraday Systemthe systems is based on Swings/Waves made by the stock.
It doesn't use any indicators, its purely based on price action.
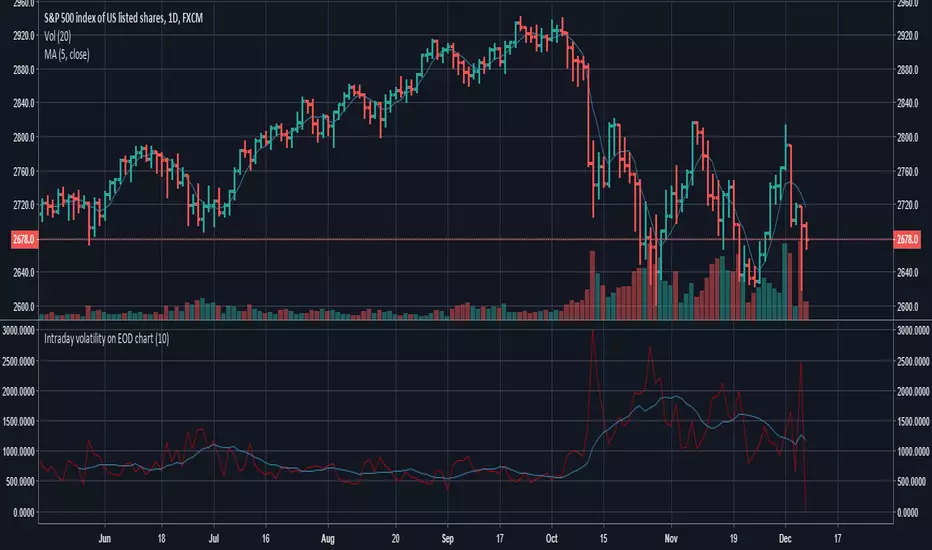
Intraday volatility on EOD chartThis indicator will allow you to compare Daily bars with Intraday insight.
Indicator draws the sum of high-low intraday bars on EOD timeframe.
The purpose is to compare TR or ATR with intraday data, because high-low on 1 daily bar says little about intraday bars inside.
You can replace the function (cum(high - low)) with whatever you need to calculate on intraday bars.
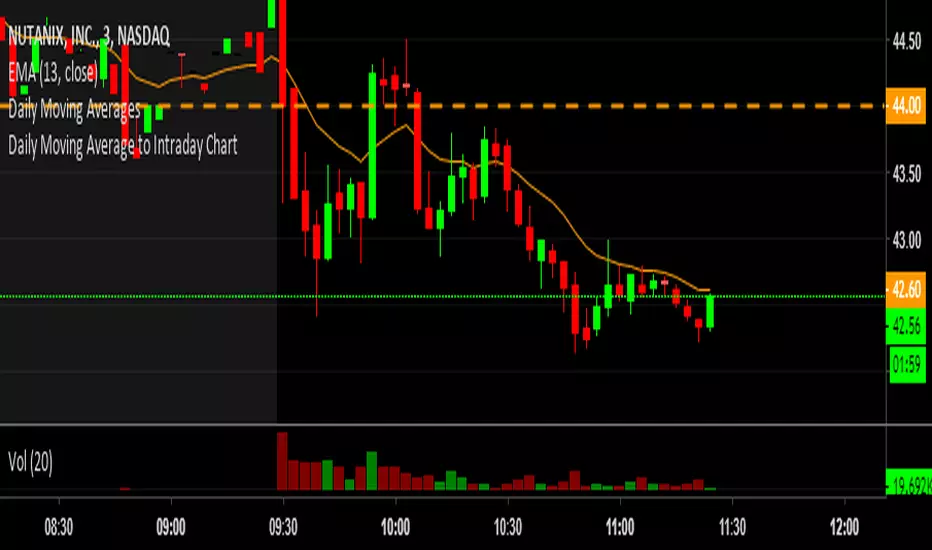
Daily Moving Average to Intraday ChartThis is going to include the 20EMA, 100SMA and 200SMA automatically into your intraday charts.
BullTrading Intraday StopHunt Indicator Phycologically traders tend to sell on lows and buy on highs. BullTrading Intraday StopHunt Indicator is designed to help you avoid such situations by monitoring the market for intraday trading setups.
The indicator plots a "Fractal Envelope © " containing the most significant Support and Resistance levels for analysis and entry level selection.
Trend filtering is provided by a MTF P-SAR (SAR will avoid repainting false signals).
The BullTrading Chaos Trend Wave is used instead the Alligator to trade fractals.
BullTrading Intraday StopHunt Indicator will provide 3 types of signals:
First one is a swing/intraday signal, it will alert you when the price is located at a very sensitive level (buy or sell) filtered by trend. If you check the indicator after the close of the day you can even know this exact level in advance (plot Red or Lime color).
Second signal will alert you the Chaos Trend Wave Moving Average Crossovers filtered by price position (related to the Fractal Envelope) and mayor trend.
Third signal is a scalping signal, it will alert you all the fractal breakouts filtered by price position (related to the Fractal Envelope) and mayor trend.
You will be amazed the huge amount of trade opportunities for a given week trading only one financial instrument.
Obviously the indicator is not perfect and will plot few false signals on mayor trend reversals or big price manipulations. AVOID THE TRAP BY WAITING THE PRICE USING BUY LIMIT AND SELL LIMIT ORDERS.
NOTE: This indicator works on any timeframe, but standard settings are calibrated for 15' charts.

ADR - Average Daily Range [@treypeng] [v2]
This is an intraday indicator.
Average Daily Range provides an upper and lower level around the daily open. It is calculated by taking an EMA/SMA average of a given number of previous days' True Range.
It can be useful for helping guide support and resistance, for taking profits and for placing stops.
It's a similar idea to the ATR indicator, but calculated on a daily timeframe only.
Settings:
Length: number of days to take an average from
Offset: Set this to 0 to include today's range. Set to 1 to exclude today. Set to 2 to exclude today and yesterday.....and so on.
The other settings should be self explanatory :)

2pm_3pm_4pm GBPUSD TARI PRIVATE 2.0Hi guys!
This is a new version of my strategies 2pm_3pm_4pm. UTC+2 ROME
The only change is that the position has to be closes, if doesn't hit the sl or the tp, at 2pm, and you will have only to check for signals at 3pm or 4 pm.
Chek more @
Subscribe to get access!
Enjoy your wallet!
Tari.

Hull MA +- ATR by shoxi Added HMA-ATR and HMA+ATR to make easier taking profits and placing stop losses in intraday trading.
