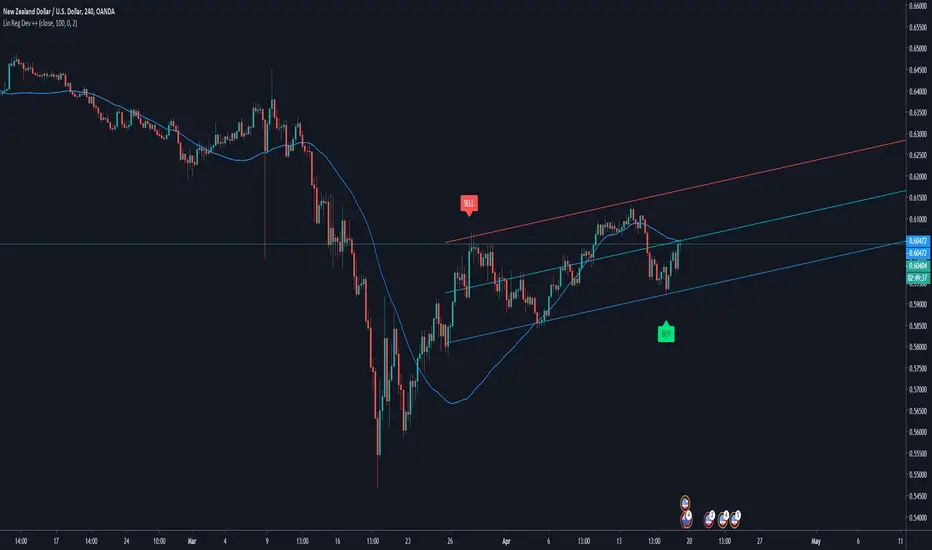
Lnear Regression ++Here is another amazing script for you guys
Target Audience
++ Programmers
++ Linear Regression Enthusiasts
Please Use this Indicator If you understand the risk posed by linear regression; ill explain some below
Features
++ Raw Formulae for the linear regression
--I understand that tradingview explanation on how the linreg function works is not clear to many of you and therefore i included this for developers
--Yes its much simpler than you thought, Do Enjoy
++ Alerts
--You can get alerts when the lower band is crossed/touched based on your settings
--These alerts are not repainting at all.
Linear Regression Limits
As you traders know, the market changes from time and new levels will get drawn
The alerts are based on these new levels and once we have new ones, we keep updating
Risk
This script is similar to Bollinger Bands style of alerts, If the market moves continuously to one direction after the break of a band, The levels change and you may receive a new signal confirmation
Cheers!! Enjoy!! Feel free to ask me for any improvements
Hồi quy tuyến tính
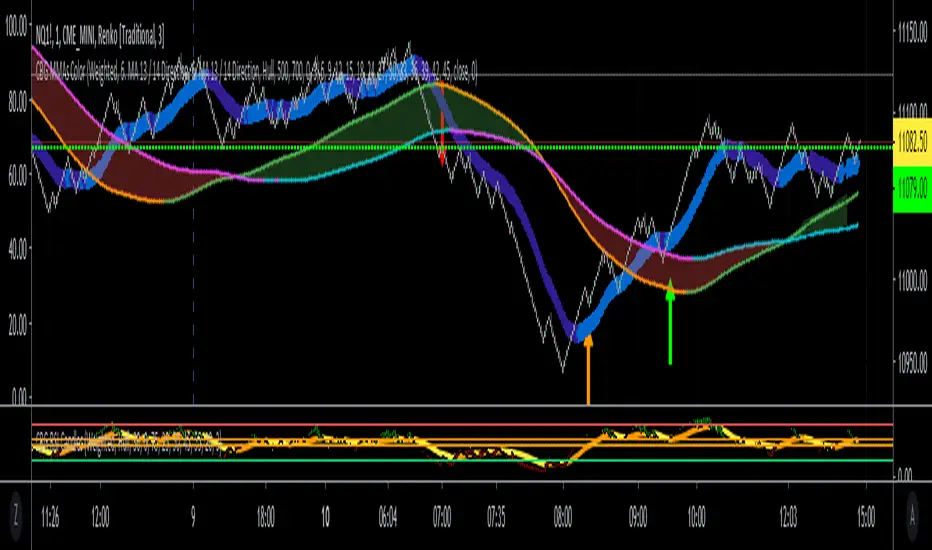
CBG MultiAverages ColorsThe latest version of my multiple moving averages. Now includes up to 14 moving averge lines plus a separate slow and fast moving average that can be assigned a different MA type.
In the screen shot is the fast/slow set to Hull with 15/50 periods. It is overlaid on top of my Key Numbers indicator.
7 moving averages in 1 indicator, including the Hull Moving Average .
SMA
EMA
Weighted
Hull
Symetrical
Volume Weighted
Wilder
Linear Regression
Lots of other features like background shading and paint bar colors.
Auto Adjust To Ideal Pearson's R OscillatorThis is meant to be a partner indicator to "Linear Regression - Auto Adjust To Ideal Pearson's R (Min & Max)" which can be found under my profile on the scripts I have made.
It's important the the ideal Pearsons R + and - ideal ranges are the same as the other script so you can visualize the results better and what is going on. I set them to default to 0.85 for strong confidence levels.
This simply graphs what the Pearsons's R Long Term Trend (Red) and Short Term Trend (Green) are doing. I noticed that they tend to oscillate in predictable ways.
The white line signifies low confidence level in a trend and usually means there is sideways trading going on.
If you are unfamiliar with Pearson's R then below will help:
+ Pearsons R means there is a downtrend
- Pearsons R means there is an uptrend
The closer the value is to 1 the more sure it's a downtrend.
The closer the value is to -1 the more sure it's an uptrend.
For this reason I colored the bottom lines 'green' to indicate buying zones and 'red' for the top lines to indicate potential shorting zones.
If you look at this indicator in replay mode in tandem with my other indicator you will see they work well together to help you identify long term trends.
The default values are 48 and 360 for the minimum allowed length of a trend and maximum length. If you find the script is to slow you can change these but make sure you do it for the values on the other script as well so they line up.
As always the code is open source.
Trend Following MAs 3DHello All,
This is Moving Averages Trend Following 3D indicator. The idea is based on direction of MAs and relation between 20 moving averages (5 to 100 period).
Option to show different type of MAs: EMA, SMA, RMA, WMA, VWMA.
As I haved tested it looks succesful at calculating trend direction and trend strength.
For a better look I tried to make it 3D, it looks good I think, waiting comments ;)
Some screenshots:
By using RMA type:
When it gets tiny it means there is no trend:
An example for down trend:
ENJOY!

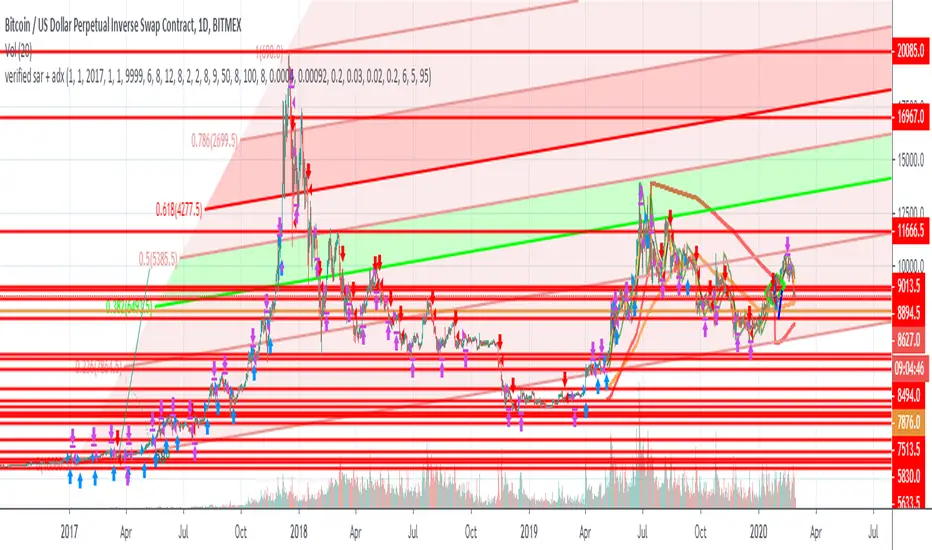
verified sar + adxsimple yet powerful script to get some cash.
use 1d+ timeframes and 0.15x-3x leverage to get full advantage from the market.
add it to favorites and use on your own risk.
yutas_Linear Regression Trend ChannelVer2.0
Indicator for linear regression channel.
Multiple deviations can be displayed.
線形回帰チャネルのインジケーター。
偏差を複数表示可能。

Bitcoin Logarithmic Growth Curves & ZonesI found this awesome script from @quantadelic and edited it to be a bit more legible for regular use, including coloured zones and removing the intercept / slope values as variables, to leave space for the fib levels in the indicator display. I hope you all like it.

SamLRSD
Linear Regression curve supported by Upper and Lower Standard Deviation bands to support your decision
Linear regression series is the average of Close and VWAP to guarantee volume is represented in calculation
Interpretation is similar to what you do with Bollinger Bands

Minkowski Distance Period Linear Regression BandsHello, this script was created by using Linear Regression Bands Function with variable Function Minkowski Distance Adaptive Period.
Function Linear Regression Bands :
Minkowski Distance Function Original Script by RicardoSantos :
Functions saved from overloads . And suitable for mutable variable periods.
Regards.
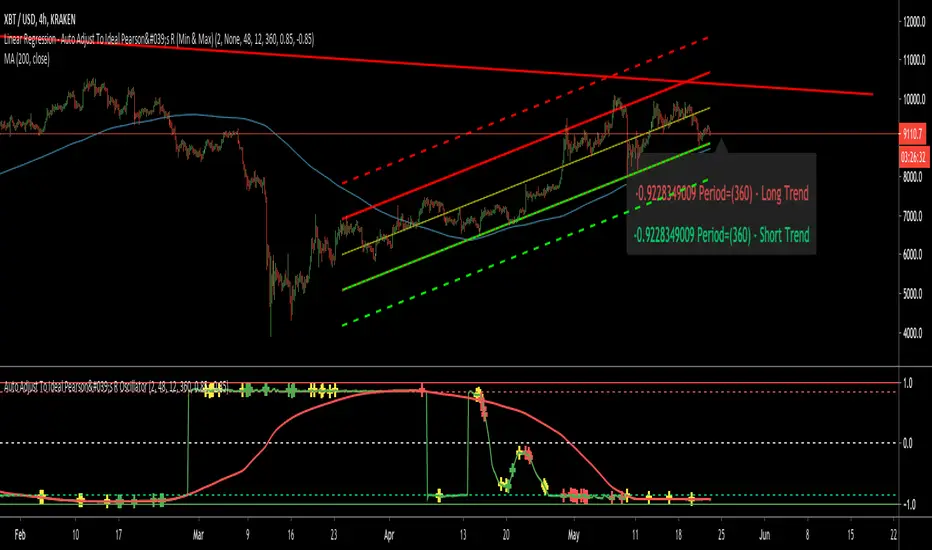
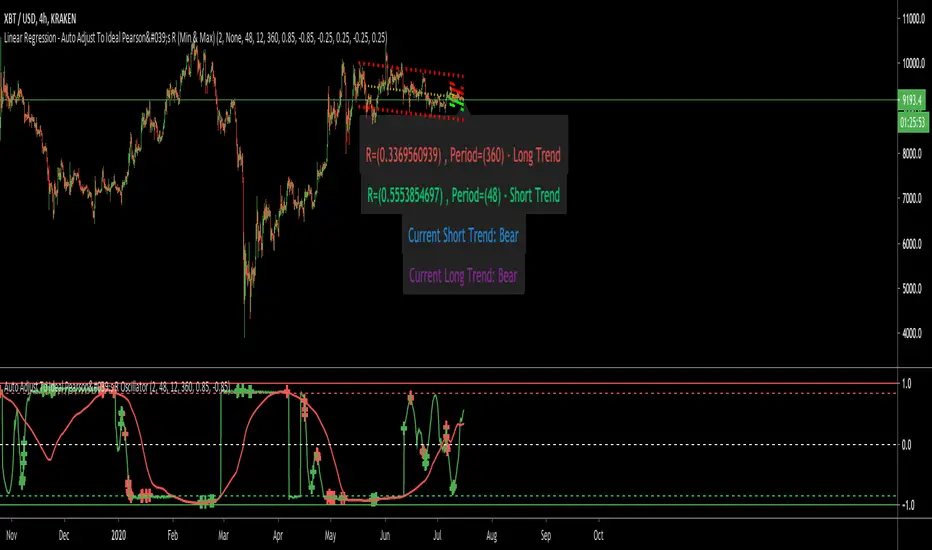
Linear Regression - Auto Adjust To Ideal Pearson's R (Min & Max)This is meant as a partner to my linear regression strategy script. This one however is just the indicator only so you can overlay the technique over other strategies.
To use this script you need to understand what Pearson's R is; which is how correlated a set of data is to a line within a given deviation (+ or -).
If the Pearson's R is negative (-) then the trend is going upwards. If the value is positive (+) then the trend is going downwards.
There is a lot of debate as to what the ideal negative and positive values are for the Pearson's R, so you can change these in the settings. What the script will do is attempt to automatically find (and draw the trend lines) based on a given minimum period and a maximum period (both set in the settings) that match the ideal Pearson's R settings selected.
Ideally the data is MOST correlated the closest it is to -1 or 1. This means the pattern is very reliable.
This script was designed and works very well with the bar replay mode. You may need a more professional version of TradingView to use this correctly. This mode allows you to see the script in action as it mutates and changes according to the new data being introduced.
I've pre-set the Pearson's R (+) and (-) ranges to what I think is ideal.
Pair Trade cryptoPair trade for crypto with inputs:
* length of correlation and moving average
* trade pair
* spread threshold to enter long / short
* spread threshold to exit long / short
Pair TradePair trade with inputs:
* length of correlation and moving average
* trade pair
* spread threshold to enter long / short
* spread threshold to exit long / short

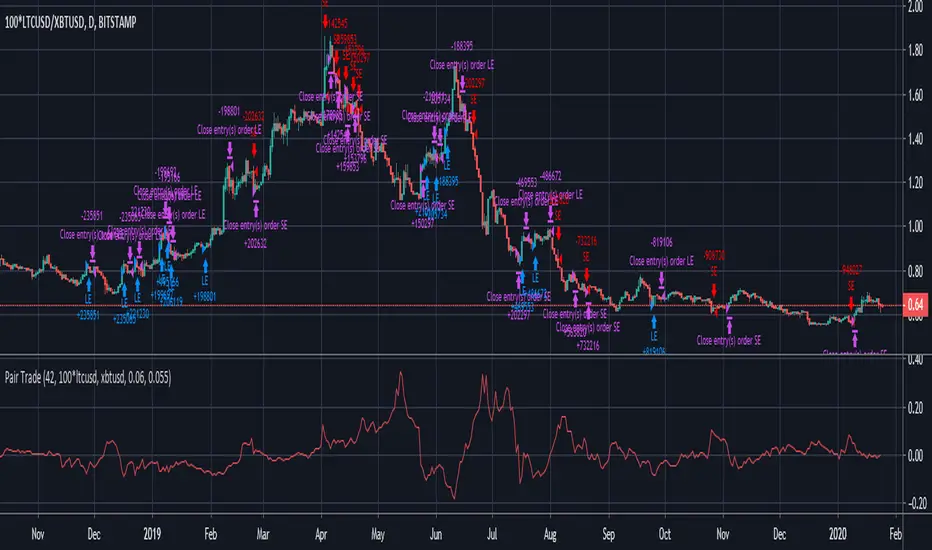
Linear Regression Pearson's R - Trend Channel StrategyThis script takes advantage of the Pearson's R attribute of the data set you provide.
Pearson's R attempts to find how correlated data is with a potential pattern. If the number is negative the correlation is upwards . If it's positive the correlation is downwards . Pearson's R can only be a number between -1 and 1. It should be impossible to ever reach -1 or 1 as that would be a perfect correlation.
This particular strategy involves using linear regression and Pearson's R to keep recalculating steps back from the current position until the Pearson's R reaches the desired amount. For example, in my experience I have found that 0.85 for as a buy point is very good as it means the trend is very reliable and solid. When the market tends to be bullish it tends to do so longer then when it's bearish.
Likewise when a downtrend is more real, I found that 0.71 for the negative Pearson's R value is ideal and gives the best results.
These can all be changed in the settings section (with the gear icon) next to when you set your results.
This strategy is really fun/useful to watch if you have the replay bar mode enabled for TradingView. This script supports this and all you have to do is go into the settings and enable realtime mode . Doing this you can actually see the trend lines change in realtime and comes in very handy for seeing long term reversals as you will see the Pearson's R value start to go down or up indicating the path it's going on.
WARNING: This script is very intensive on the processing power of your machine. If you find that it's to slow you may have to go into the settings of the script and adjust the 'step by' parameter so that it calculates a little faster. It won't be as accurate but it will be good enough. I feel I've optimized it with it's current setting as an example of what you want to aim for.
If there are any questions do no hesitate to message or ask me. I love feedback on the community for new features and ideas!
This works best with with XBTUSD on the 4 hourly chart . It does not seem to work well if you go below hourly or go above daily.

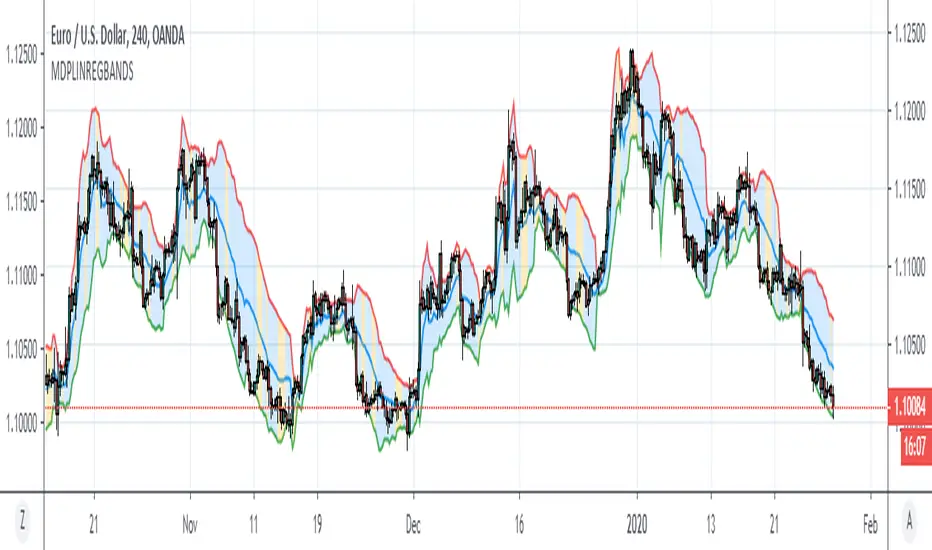
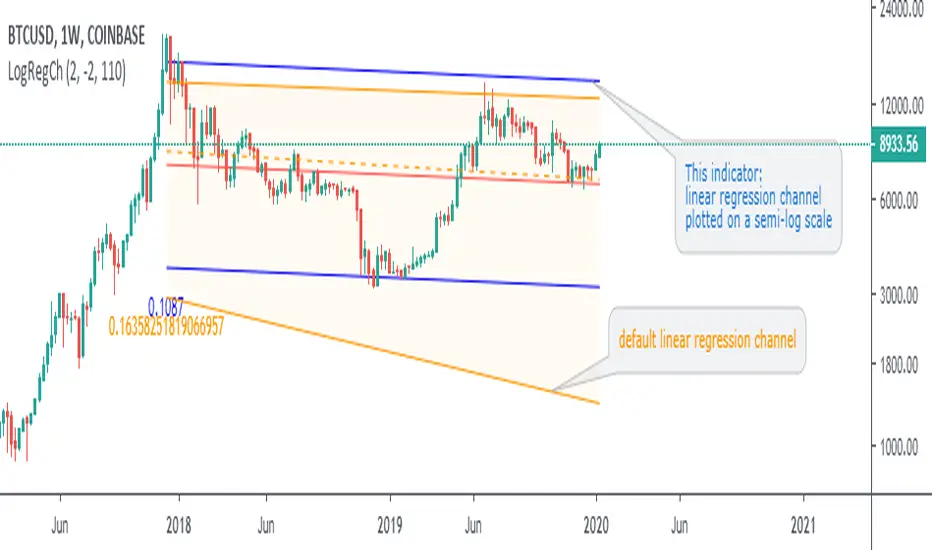
Linear Regression Logarithmiclinear regression channel plotted on log-scale
useful for bitcoin chart and other cryptos
Linear Regression ChannelLinear Regression Channel designed for easy analysis with 18 lines instead of the standard three.

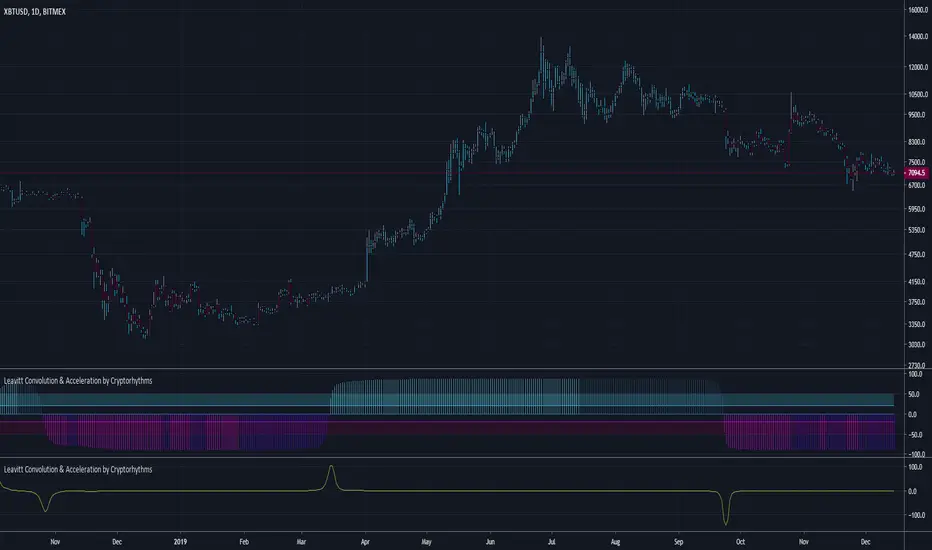
Leavitt Convolution & Acceleration by CryptorhythmsLeavitt Projection, Convolution, & Acceleration by Cryptorhythms
Intro
Bringing you another open source Gem this time from the January 2020 Issue of TASC.
Description
In the article in the Oct 2019 TASC issue titled "An interplanetary marriage" author Jay Leavitt describes the evolution process required in strategy design by introducing his Mars strategy. This grew out of concepts presented in his earlier TASC articles such as the stratosphere, moon rocket, and tech emini strategies. This dual indicator uses a linear regression of price data to help derive slope and acceleration information, in turn helping him to identify trends and trend turning points.
Additions
As usual a few useful extras are included such as a rudimentary signaling system, bar coloration by trade state, overbought/oversold areas to assist in algorithmic setups, and more!
👍 We hope you enjoyed this indicator and find it useful! We post free crypto analysis, strategies and indicators regularly. This is our 71st script on Tradingview!
💬Check my Signature for other information
Leavitt Convolutions Multicator - Jay Leavitt, Ph.D.Hot off the press, I present this next generation "Leavitt Convolutions Multicator" employing PSv4.0, originally formulated by Jay Leavitt, Ph.D. for TASC - January 2020 Traders Tips. Basically it's an all-in-one combination of three Leavitt indicators. This triplet indicator, being less than a 60 line implementation at initial release, is a heavily modified version of the original indicator using novel techniques, surpassing Leavitt's original intended design.
Utilizing the "Power of Pine", I included the maximum amount of features I could surmise in an ultra small yet powerful package. Configurations are displayed above in multiple scenarios that should be suitable for most traders.
Features List Includes:
Dark Background - Easily disabled in indicator Settings->Style for "Light" charts or with Pine commenting
AND much, much more... You have the source!
For those of you who are new to Pine Script, this script may also help you understand advanced programming techniques in Pine and how they may be utilized in a most effective manner. Most notably, the script shows how to potentially combine three indicators in one with Pine. This is commonly what my dense intricate code looks like behind the veil, and if you are wondering why there is no notes, that's because the notation is in the variable naming.
The comments section below is solely just for commenting and other remarks, ideas, compliments, etc... regarding only this indicator, not others. When available time provides itself, I will consider your inquiries, thoughts, and concepts presented below in the comments section, should you have any questions or comments regarding this indicator. When my indicators achieve more prevalent use by TV members, I may implement more ideas when they present themselves as worthy additions. As always, "Like" it if you simply just like it with a proper thumbs up, and also return to my scripts list occasionally for additional postings. Have a profitable future everyone!

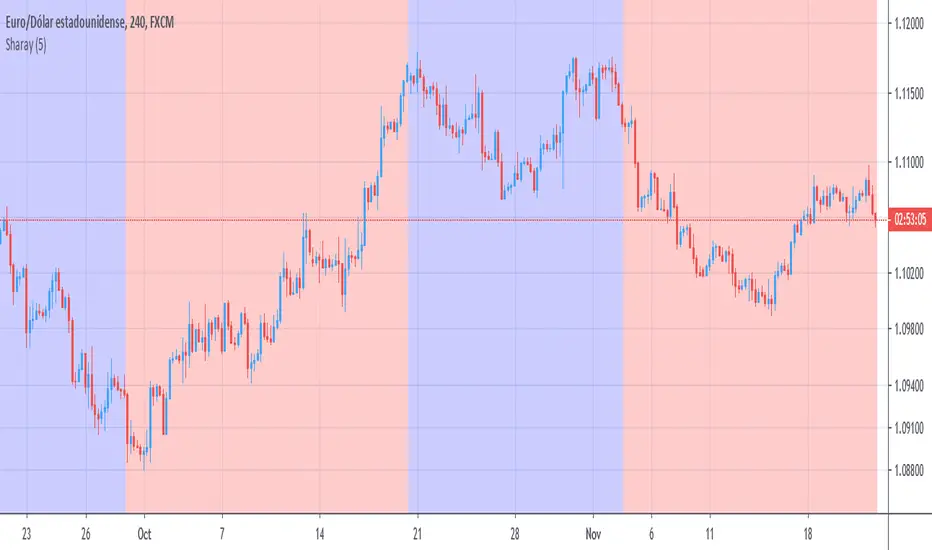
SharaySharay indicator
The Sharay indicator is a trading tool based on the analysis of consecutive candles. The signals to generate alerts can also be a sign of support and resistance.
The indicator has the visualization of the classic bluesky indicator and it can clearly identify the direction of a trend or market momentum.
The signals produced help traders find the most optimal entry and exit points for their operations.
Configurations
The length of consecutive candles in a range of 2 to 5
Show the previous origin of a signal in the form of support
Show parabolic SAR
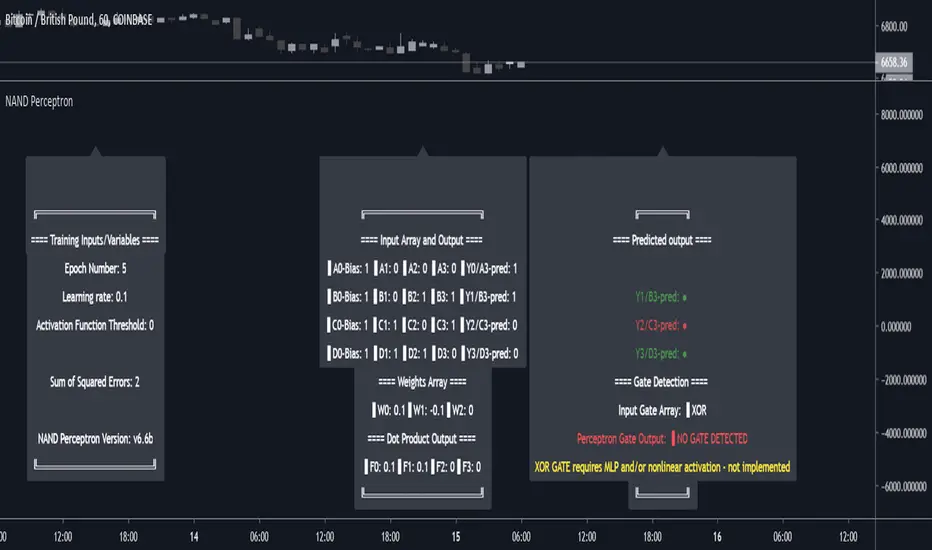
NAND PerceptronExperimental NAND Perceptron based upon Python template that aims to predict NAND Gate Outputs. A Perceptron is one of the foundational building blocks of nearly all advanced Neural Network layers and models for Algo trading and Machine Learning.
The goal behind this script was threefold:
To prove and demonstrate that an ACTUAL working neural net can be implemented in Pine, even if incomplete.
To pave the way for other traders and coders to iterate on this script and push the boundaries of Tradingview strategies and indicators.
To see if a self-contained neural network component for parameter optimization within Pinescript was hypothetically possible.
NOTE: This is a highly experimental proof of concept - this is NOT a ready-made template to include or integrate into existing strategies and indicators, yet (emphasis YET - neural networks have a lot of potential utility and potential when utilized and implemented properly).
Hardcoded NAND Gate outputs with Bias column (X0):
// NAND Gate + X0 Bias and Y-true
// X0 // X1 // X2 // Y
// 1 // 0 // 0 // 1
// 1 // 0 // 1 // 1
// 1 // 1 // 0 // 1
// 1 // 1 // 1 // 0
Column X0 is bias feature/input
Column X1 and X2 are the NAND Gate
Column Y is the y-true values for the NAND gate
yhat is the prediction at that timestep
F0,F1,F2,F3 are the Dot products of the Weights (W0,W1,W2) and the input features (X0,X1,X2)
Learning rate and activation function threshold are enabled by default as input parameters
Uncomment sections for more training iterations/epochs:
Loop optimizations would be amazing to have for a selectable length for training iterations/epochs but I'm not sure if it's possible in Pine with how this script is structured.
Error metrics and loss have not been implemented due to difficulty with script length and iterations vs epochs - I haven't been able to configure the input parameters to successfully predict the right values for all four y-true values for the NAND gate (only been able to get 3/4; If you're able to get all four predictions to be correct, let me know, please).
// //---- REFERENCE for final output
// A3 := 1, y0 true
// B3 := 1, y1 true
// C3 := 1, y2 true
// D3 := 0, y3 true
PLEASE READ: Source article/template and main code reference:
towardsdatascience.com
towardsdatascience.com
towardsdatascience.com
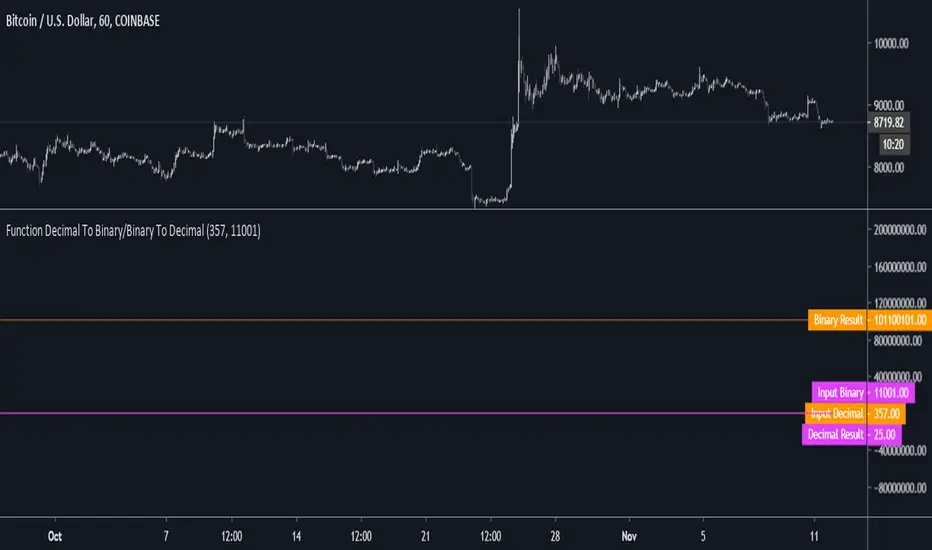
Function Decimal To Binary/Binary To DecimalNOTE: Experimental. Pinescript implementation of Decimal to Binary and Binary to Decimal that is intended for use in the development of a neural network proof of concept.
Intended for use in as subcomponent in the development of a more complex/highly experimental prototype.
Protection/logic for edge cases above 11111111/255 (8bits) is NOT implemented.
Do NOT use this in any trading system or component without edge case testing/unit tests.
// Decimal to Binary, Binary to Decimal Reference:
// diwasfamily.com
// www.wikihow.com
//
// www.khanacademy.org
[Uki] Channel LineThree channel lines using linear regression and standard deviation.
Red: Short Term
Green: Medium term
Blue: Long Term

Bitcoin Logarithmic Growth CurvesThis plots logarithmic curves fitted to major Bitcoin bear market tops & bottoms. Top line is fitted to bull tops, bottom line is fitted to lower areas of the logarithmic price trend (which is not always the same as bear market bottoms). Middle line is the median of the top & bottom, and the faded solid lines are fibonacci levels in between.
Inspired by & based on a Medium post by Harold Christopher Burger, which shows how linear Bitcoin's long-term price growth is when plotted on a double-log chart (log scaling on the price AND time axis).
These curves will only make sense for tickers representing Bitcoin vs. USD (such as BITSTAMP:BTCUSD, BITMEX:XBTUSD, BLX index). Plotting on other assets will probably end up with lines that shoot off into space without any relationship to the underlying price action.
The upper, middle & lower curves can be projected into the future, which can be turned on or off in the indicator settings. The fibonacci levels can also be switched on/off. And the upper & lower curve intercepts & slopes can be tweaked.
I'm releasing this open-source, if you end up making something cool based off of this code, I don't need attribution but please hit me up on here or on twitter (same username) so I can check out what ya made. Thanks, hope y'all enjoy it.

HTF Double Logarithmic Curves OscillatorThis a companion indicator for HTF Double Logarithmic Curves
This is an oscillator version of the above. When the indicator is at/near 1 then Bitcoin price is at/near the upper range of it's longterm logarithmic growth trend. When at/near 0 then price is at/near the lower range of that trend.
This indicator only works with the BLX Brave New Coin Index (ticker:BLX) and only on 1 day, 3 day, or 1 week timeframes.
