My BTC log curveLogarithmic regression of the USD price of Bitcoin , calculated according to the equation:
y=A*exp(beta*x^lambda + c) + m*x + b
where x is the number of days since the genesis block. All parameters are editable in the script options.
Hồi quy tuyến tính

Linear Regression ChannelsThis script tries to find when a trading channel is developing and once is developed it will save it for later use on 2 variables up and down channel. You can access the last 2 channels for comparisons but this could be extensible for more channels.
You can choose the delta for the alignment accuracy of the channel.
The error for the difference between channels and the deviation for the width of the channel based on standard deviation.
Offset is for the alignment basically if the alignment is the same at the begining and at the offset the algo consider that a Channel.

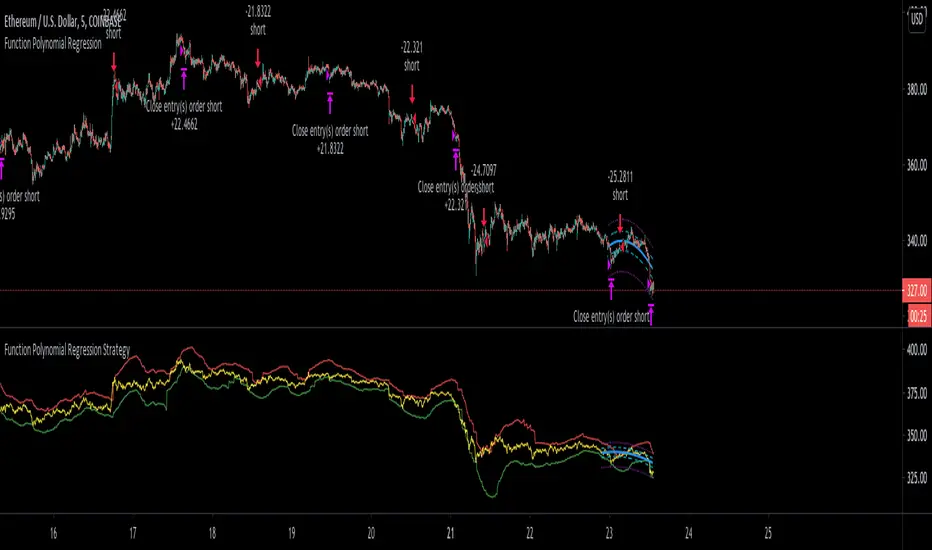
Function Polynomial Regression StrategyTo be clear I'm using the code from Richard Santos for the functional polynomial regression. I really loved his script idea (given that I'm into linear regression myself). I took his code and made a strategy which applies to bitcoin on the 5 minute chart (but you could adjust this for any asset), and you could make this work on anytime frame by adjusting the 'length' property of the regression until you get good results.
This strategy is very simple.
I drew lines to represent the bottom most part of the regression (green line), and top most part (red line). If the close crosses under the red line then you short. The reverse if it crosses above the green line then you go long.
Very simple but effective. To understand this script be sure to add Richard santos function polynomial regression so you can see what is going on and what I'm trying to do.
For example, on BTC with a length of 61 if you bought and held you would have only had 5% gain, instead with this strategy you are looking at very close to 60% gains! Now this could be a weird fluke of over-optimizing but I'm not sure this is the case because you can adjust the length from there +/- about 10 and still have good results. It's just certain lengths are the correct trading rhythms for different assets.
I'm excited to see how you guys use this and if you have any success. Be sure to thank Richard Santos for his great work!
Trend Following with Moving AveragesHello Traders,
With the info "Trend is Your Friend ", you should not take position against the trend. This script checks multipte moving averages if they are above/below the closing price and try to find trend. The moving averages with the length 8, 13, 21, 34, 55, 89, 144, 233, 377 used. these are fibonacci numbers, but optionally you can change the lengths of each moving averages. while it's green you better take long positions, while it's red you better take short positions according to other indcators or tools.
Optionally you have "smoothing" option to get rid of whipsaws. it's enabled by default.
You have option to use following moving average types: EMA, SMA, RMA, WMA, VWMA. by default it's EMA
Also the script has "Resolution" option. with this option you can get the trend for other time frames, in following example 1h was set as for higher time frame on 15m chart:
This should not be used as buy/sell signal indicators as it's tries to find trend but not entry points, you should use other indicators (such RSI, Momentum) or other tools to find buy/sell signals.
Enjoy!

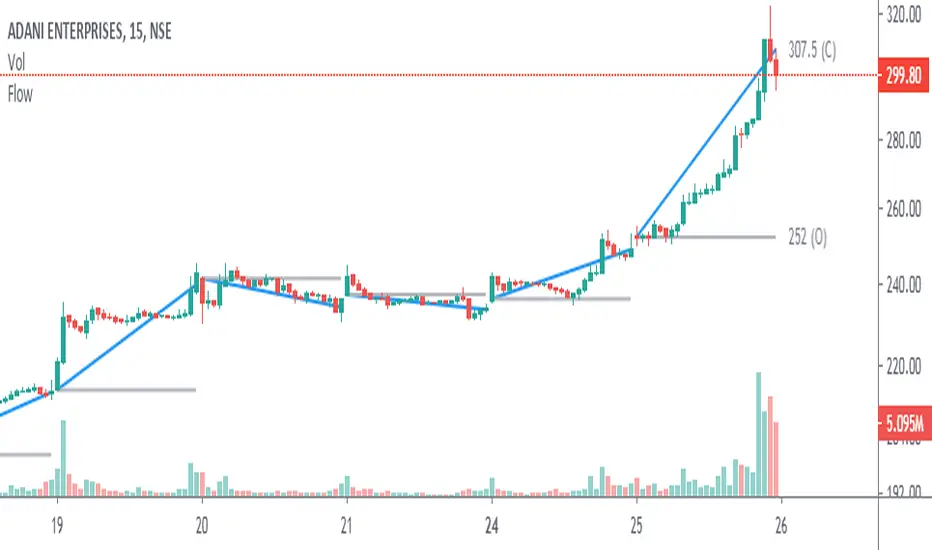
Angle & Price FlowThis is a simple end of the day indicator based on open and close values.
Angles:
Identifying narrow angles helps to find breakouts
Maximum angle = High chance of reversal
Minimum angle = Chance of breakouts on the next day or upcoming days.
Price Flow:
I personally use price flow to simplify the flow of candlestick chart and to identify breakouts using rounding bottoms and rounding top patterns, sharp corners for reversals.
Features:
Multi time frame
Labels
Hide previous period
Combine it with other indicators for better result.

Linear Regression Band BasicLinear Regression Band implements a BB like structure but with the middle line using solely a linear regression as input. In addition unlike bollinger bands , the market price never wicks out of the linear regression band. This is because it gives the absolute possible range taken from the middle line.

Linear Regression (All Data)The tool plots a linear regression line using the entire history of an instrument on chart. There are may be issues on intraday timeframes less then 1h. On daily, weekly and monthly charts it works without problem.
If an instrument has a lot of data points, you may not see the line (this is TV feature):
To fix that you need to scroll your chart to the left and find the starting point of the line:
And then do an auto-scroll to the last bar:

Bitcoin Block Height (Total Blocks)Bitcoin Block Height by RagingRocketBull 2020
Version 1.0
Differences between versions are listed below:
ver 1.0: compare QUANDL Difficulty vs Blockchain Difficulty sources, get total error estimate
ver 2.0: compare QUANDL Hash Rate vs Blockchain Hash Rate sources, get total error estimate
ver 3.0: Total Blocks estimate using different methods
--------------------------------
This indicator estimates Bitcoin Block Height (Total Blocks) using Difficulty and Hash Rate in the most accurate way possible, since
QUANDL doesn't provide a direct source for Bitcoin Block Height (neither QUANDL:BCHAIN, nor QUANDL:BITCOINWATCH/MINING).
Bitcoin Block Height can be used in other calculations, for instance, to estimate the next date of Bitcoin Halving.
Using this indicator I demonstrate:
- that QUANDL data is not accurate and differ from Blockchain source data (industry standard), but still can be used in calculations
- how to plot a series of data points from an external csv source and compare it with another source
- how to accurately estimate Bitcoin Block Height
Features:
- compare QUANDL Difficulty source (EOD, D1) with external Blockchain Difficulty csv source (EOD, D1, embedded)
- show/hide Quandl/Blockchain Difficulty curves
- show/hide Blockchain Difficulty candles
- show/hide differences (aqua vertical lines)
- show/hide time gaps (green vertical lines)
- count source differences within data range only or for the whole history
- multiply both sources by alpha to match before comparing
- floor/round both matched sources when comparing
- Blockchain Difficulty offset to align sequences, bars > 0
- count time gaps and missing bars (as result of time gaps)
WARNING:
- This indicator hits the max 1000 vars limit, adding more plots/vars/data points is not possible
- Both QUANDL/Blockchain provide daily EOD data and must be plotted on a daily D1 chart otherwise results will be incorrect
- current chart must not have any time gaps inside the range (time gaps outside the range don't affect the calculation). Time gaps check is provided.
Otherwise hardcoded Blockchain series will be shifted forward on gaps and the whole sequence become truncated at the end => data comparison/total blocks estimate will be incorrect
Examples of valid charts that can run this indicator: COINBASE:BTCUSD,D1 (has 8 time gaps, 34 missing bars outside the range), QUANDL:BCHAIN/DIFF,D1 (has no gaps)
Usage:
- Description of output plot values from left to right:
- c_shifted - 4x blockchain plotcandles ohlc, green/black (default na)
- diff - QUANDL Difficulty
- c_shifted - Blockchain Difficulty with offset
- QUANDL Difficulty multiplied by alpha and rounded
- Blockchain Difficulty multiplied by alpha and rounded
- is_different, bool - cur bar's source values are different (1) or not (0)
- count, number of differences
- bars, total number of bars/data points in the range
- QUANDL daily blocks
- Blockchain daily blocks
- QUANDL total blocks
- Blockchain total blocks
- total_error - difference between total_blocks estimated using both sources as of cur bar, blocks
- number_of_gaps - number of time gaps on a chart
- missing_bars - number of missing bars as result of time gaps on a chart
- Color coding:
- Blue - QUANDL data
- Red - Blockchain data
- Black - Is Different
- Aqua - number of differences
- Green - number of time gaps
- by default the indicator will show lots of vertical aqua lines, 138 differences, 928 bars, total error -370 blocks
- to compare the best match of the 2 sources shift Blockchain source 1 bar into the future by setting Blockchain Difficulty offset = 1, leave alpha = 0.01 =>
this results in no vertical aqua lines, 0 differences, total_error = 0 blocks
if you move the mouse inside the range some bars will show total_error = 1 blocks => total_error <= 1 blocks
- now uncheck Round Difficulty Values flag => some filled aqua areas, 218 differences.
- now set alpha = 1 (use raw source values) instead of 0.01 => lots of filled aqua areas, 871 differences.
although there are many differences this still doesn't affect the total_blocks estimate provided Difficulty offset = 1
Methodology:
To estimate Bitcoin Block Height we need 3 steps, each step has its own version:
- Step 1: Compare QUANDL Difficulty vs Blockchain Difficulty sources and estimate error based on differences
- Step 2: Compare QUANDL Hash Rate vs Blockchain Hash Rate sources and estimate error based on differences
- Step 3: Estimate Bitcoin Block Height (Total Blocks) using different methods in the most accurate way possible
QUANDL doesn't provide block time data, but we can calculate it using the Hash Rate approximation formula:
estimated Hash rate/sec H = 2^32 * D / T, where D - Difficulty, T - block time, sec
1. block time (T) can be derived from the formula, since we already know Difficulty (D) and Hash Rate (H) from QUANDL
2. using block time (T) we can estimate daily blocks as daily time / block time
3. block height (total blocks) = cumulative sum of daily blocks of all bars on the chart (that's why having no gaps is important)
Notes:
- This code uses Pinescript v3 compatibility framework
- hash rate is in THash/s, although QUANDL falsely states in description GHash/s! THash = 1000 GHash
- you can't read files, can only embed/hardcode raw data in script
- both QUANDL and Blockchain sources have no gaps
- QUANDL and Blockchain series are different in the following ways:
- all QUANDL data is already shifted 1 bar into the future, i.e. prev day's value is shown as cur day's value => Blockchain data must be shifted 1 bar forward to match
- all QUANDL diff data > 1 bn (10^12) are truncated and have last 1-2 digits as zeros, unlike Blockchain data => must multiply both values by 0.01 and floor/round the results
- QUANDL sometimes rounds, other times truncates those 1-2 last zero digits to get the 3rd last digit => must use both floor/round
- you can only shift sequences forward into the future (right), not back into the past (left) using positive offset => only Blockchain source can be shifted
- since total_blocks is already a cumulative sum of all prev values on each bar, total_error must be simple delta, can't be also int(cum()) or incremental
- all Blockchain values and total_error are na outside the range - move you mouse cursor on the last bar/inside the range to see them
TLDR, ver 1.0 Conclusion:
QUANDL/Blockchain Difficulty source differences don't affect total blocks estimate, total error <= 1 block with avg 150 blocks/day is negligible
Both QUANDL/Blockchain Difficulty sources are equally valid and can be used in calculations. QUANDL is a relatively good stand in for Blockchain industry standard data.
Links:
QUANDL difficulty source: www.quandl.com
QUANDL hash rate source: www.quandl.com
Blockchain difficulty source (export data as csv): www.blockchain.com

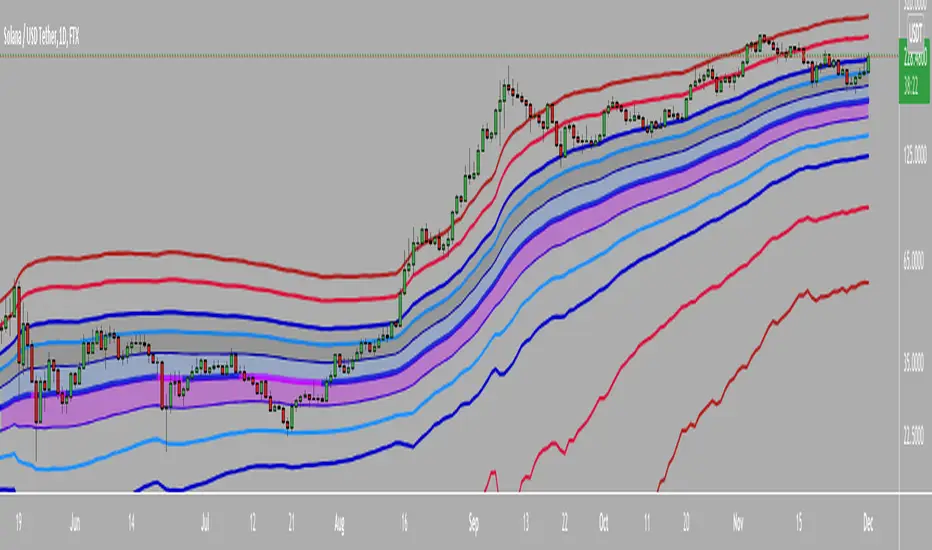
CBG Keltner ChannelsHere's an updated version of the CBG Keltner Channel indicator.
1. Added a new option for painting bars and backgrounds.
- Option 5 will paint up bars if the midline moving average is moving up and price is above the control moving average. It will paint down bars if the opposite is true. If neither are true, it will paint a neutral color. The neutral color defaults to gray bars and no color for backgrounds.
2. I've also added a 3rd band.
The chart here shows the default settings except for the inner band which is turned off.

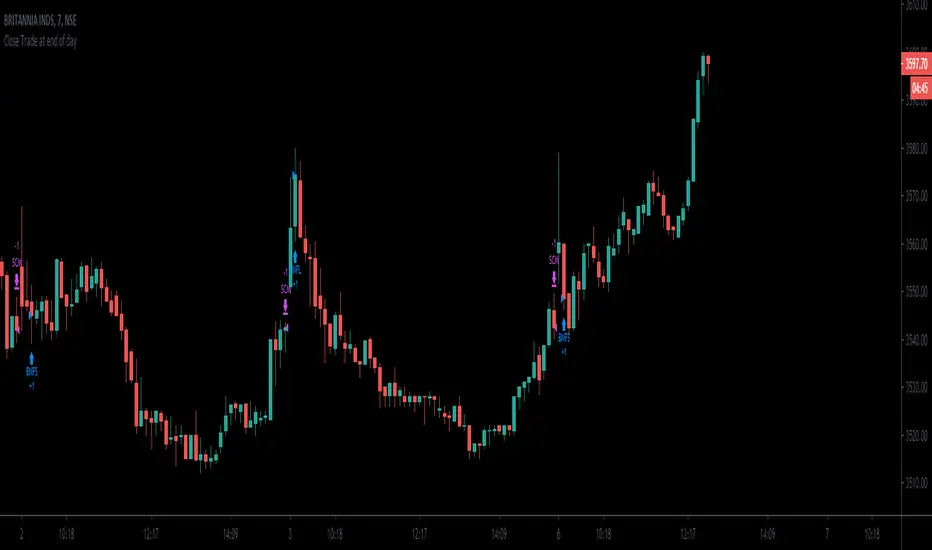
Close Trade at end of day script serves as an example how we can close trades at end of day.
can be session controlled or the time controlled.
the session should be adjusted to be earlier than the candle time.
Range identifier by angleThis study tries to highlight ranges
as they are defined by
TradingLatino TradingView user.
A range according to its definition would consist of
periods when the price does not move a lot.
It's aimed at BTCUSDT pair and 4h timeframe.
HOW IT WORKS
Price source is the middle between open and close values.
For each of the bars a '5' periods regression line is calculated
The regression line has an angle with the 0-axis line
which might be between 0 and 90.
0 angle would mean price is always the same
90 angle would mean price going to infinity
When '2' of those periods in a row
have their angles between a maximum angle
and a minimum angle then you have the range
SETTINGS
Price range bar periods : How many previous periods are used to calculate the bar regression line
Price range range periods : How many periods in a row should be used to say that there is a range
Price range maximum angle ( < 90.0 !!! ): Maximum angle for range detection
Price range minimum angle ( > -90.0 !!! ): Mininum angle for range detection
Angles should be set from -89.99 for the minimum angle to +89.99 for the maximum angle
WARNING
Despite the name indicator does not identify the entire range.
It identifies when you realise you are inside a range.
E.g. If a range length is 8 periods length this range indicator
will highlight only the last 6 periods of the range.
USAGE
If your strategy signals you an upwards trend
then you might use this range detector
to know when to exit your long position
Why?
Because most of the times
the price is found to be
in a range it goes down
FEEDBACK 1
I'm quite sure this range approach by comparing angles is a novel one.
I have checked Range Identifier script from TradingView LazyBear user
and it uses another approach.
I'm interested on different approaches on how to detect ranges.
FEEDBACK 2
I have only used this identifier in BTCUSDT 4h timeframe.
I'm interested to know if applying it more traditional
stocks the degrees need to be adjusted to something
more smaller.
PINE SCRIPT TRICK
This script simulates looping an string char by char
in pine script.
CREDITS
I have reused and adapted some code from
'TF Segmented Linear Regression' script
which it's from TradingView alexgrover user.

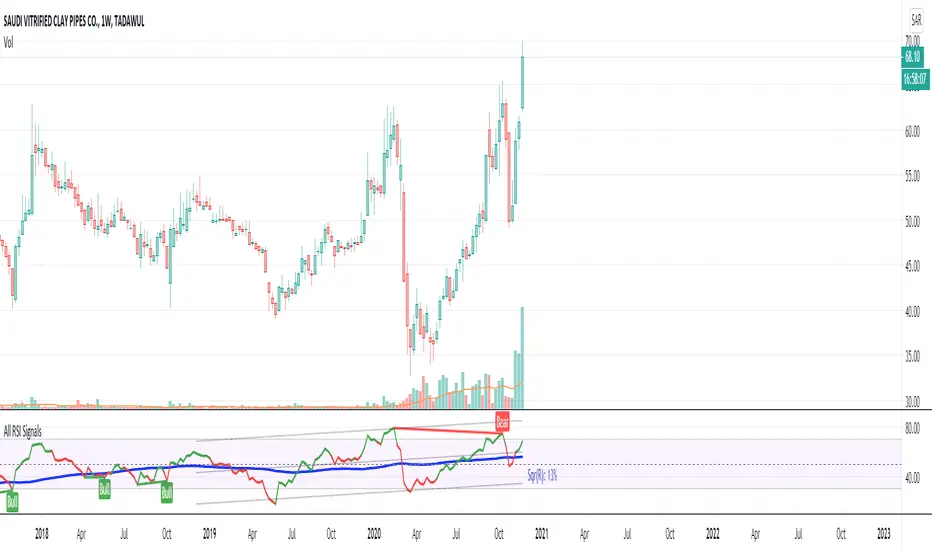
All RSI Signals v1Hi All,
RSI is a widely accepted indicator by most of the traders. I built this indicator to present all the RSI buying and selling signals that can be missed to get the best use of this indicator.
The indicator is composed of:
1. RSI
2. Stochastic RSI
3. Linear regression for the RSI
The short signals provided by the stochastic will support short term traders to catch every move and maximize the profit. The idea is that:
1. The stochastic stochastic RSI will give the RSI a colour based on the potential movement. blue colour for uptrend and red for the downtrend
2. The linear regression will provide the directions of the RSI and facilitate the indication of any divergence with the stock or commodity trend
3. Based on my tests, It's better to buy only if the RSI is between 30 to 70 and the stochastic between 20 and 60 to ensure a strong trend and capture the right amount of the revenue
Hope you enjoy it and remember that all the variables are editable to support you in customizing it based on your experience and market behaviour
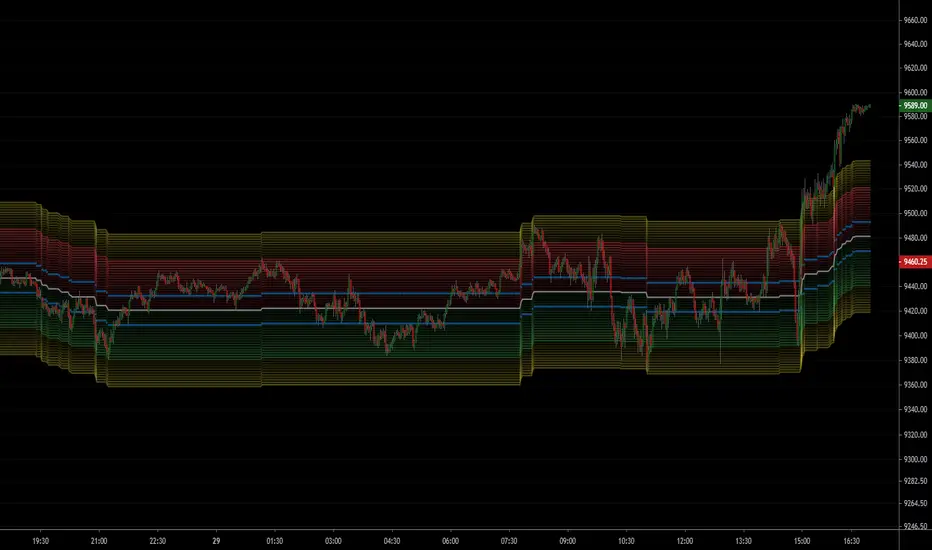
NSDT ES Midline Zones**DESIGNED FOR ES/MES** This script provides an easy visualization of potential reversion zones to take trades back to the intraday midline. A common use would be to enter a position once price reached the outer yellow zones and retreats to either the red zone (for a short toward the midline) or a green zone (for a long back to the midline).

NSDT NQ Midline Zones**DESIGNED FOR NQ/MNQ** This script provides an easy visualization of potential reversion zones to take trades back to the intraday midline. A common use would be to enter a position once price reached the outer yellow zones and retreats to either the red zone (for a short toward the midline) or a green zone (for a long back to the midline).
CBG Swing HighLow MAThis indicator will show the swing high and lows for the number of bars back. It's very easy to use and shows good support and resistance levels.
I then took it a step further and added a moving average with all the standard types in my indicators:
SMA
EMA
Weighted
Hull
Symmetrical
Volume Weighted
Wilder
Linear Regression
I then added Bollinger Bands to show the standard deviation from the midline.
Finally, I added a simple bar coloring scheme: green if above the upper BB, Red if below and orange if in the middle.
I am just testing this out so please use with caution. If anyone in the community wants to run some backtests, that would be great and we would all appreciate it.
Of course you can keep it all simple and turn off all the moving averages and bollinger bands.
Enjoy! :-)

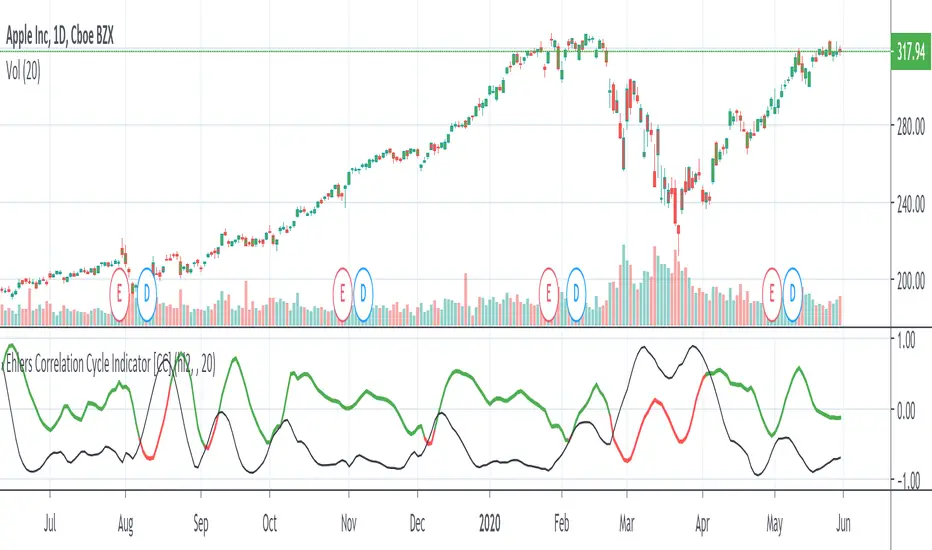
Ehlers Correlation Cycle IndicatorThe Correlation Cycle Indicator was created by John Ehlers (Stocks & Commodities V. 38:06 (8–15)) and this is technically part of three indicators in one so I'm splitting each one to a separate script. This particular indicator was designed for trend direction and trend strength and simply buy when it is green and sell when it turns red. Also keep in mind that the higher the indicator is above the signal then the stronger the trend and when they are close together, conditions get choppy.
Let me know if you would like to see me publish other scripts or if you want something custom done!
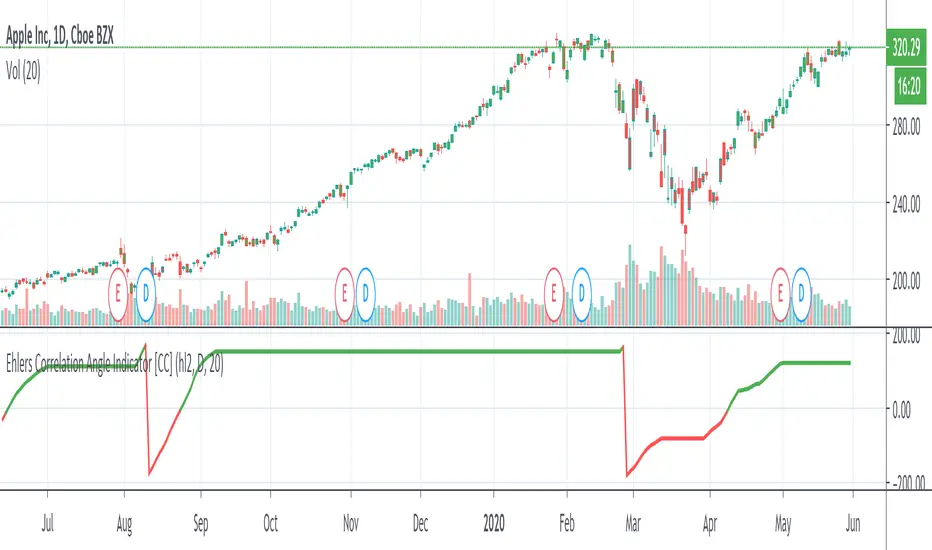
Ehlers Correlation Angle IndicatorThe Correlation Angle Indicator was created by John Ehlers (Stocks & Commodities V. 38:06 (8–15)) and this is technically three indicators in one so I'm splitting each one to a separate script. This particular indicator was designed for trend termination and simply buy when it is green and sell when it turns red.
Let me know if you would like to see me publish other scripts or if you want something custom done!
CBG Keltner ChannelsKeltner Channel with the following Moving Average types: SMA, EMA, Weighted, Hull, Symmetrical, Volume Weighted, Wilder and Linear Regression. Plus 2 bands with full color shading.
The picture shows the Keltner channels with the Wilder MA, my favorite. See how easy it would have been to stay in the move down? Excellent indicator.

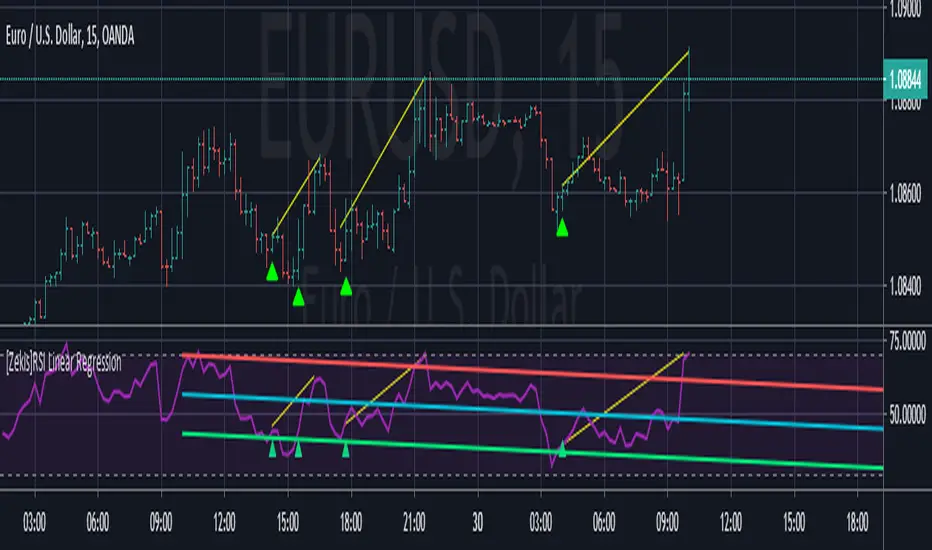
[Zekis]RSI Linear RegressionA very useful combination between RSI and linear regression that shows a clear trend.
It is not recommended to be used for entry/exit points as it is.
It's very powerful for trend analysis and divergences.
Linear regression is a tool for statistical analysis that attempts to show a relationship between two variables. Linear regression looks at various data points and plots a trend line. Linear regression can create a predictive model showing trends of data.
Can be used with any time frame, mtf is also added
Alerts are added for RSI crossing the channel lines
USDJPY 30 MIN STRATEGYThis strategy uses a combination linear regression moving averages and ATR, fine-tuned to the USD/JPY 30 minute chart. Without going into too much detail, the long/short signals are based upon linear regression moving average crosses and slope with ATR confirmation.
All code is based on one time frame with no security functions so zero repaint. Backtest is based upon compounding 100% of your capital using zero leverage.
PM me for access to the strategy. Alert indicator for this available for donation via BTC.
I'm not a professional coder, but the backtests speak for themselves. As with anything on Tradingview, your results may vary and use at your own risk. Past performance is no indication of future performance.
- Hoffdaddy

VPTbollfib & Camarilla (Danarilla)I do not own the original indicators. This is just a combination of the two because of their nature to work in a similar way.
Camarilla Pivots run on the basis of intraday range trading. Usually after daily open you look the fade whatever move happened before. by shorting R3/H3 levels or longing R3/L3. Targeting the other side of the range. This is the infamous PivotBoss level calculations and you would want to activate camarilla and turn off the normal pivots. They use the previous days volatility to plot the next days levels.
But what about some confirmation?
Well RafaelIzoni (who made it open source for improvement) threw together this VPTbollfib. It is volume price trend crossing down a fib line using bollinger bands as price envelope. The beauty of this is that It will signal usually counter to current price action based on selling into uptrends or vise versa. Meaning you get signals to counter price. Which is what you might be looking for on range day trade scalps for camarilla. A wick reversal or engulfing + volume based signal is a very happy pairing together. And those signals are usually suitable for the target of the range you are day trading. Hourly time frame works quite well for both. And camarilla should also be on daily settings.
Special Thanks to Nanda (who published the pivotboss indicator AND) Helped to merge the scripts together.
This indicator alone is an entire trade system. Camarilla already is. If you know the rules. it can be used for entries, exits, risk management to trade the range on TREND, COUNTER TREND, and BREAKOUT plays. The bollinger band fibs add confirmation to the trends levels. And the VPT adds a secondary confirmation to take a camarilla trade.
Try it out. I think you will find both the levels on camarilla and the VPT signals quite suprising.
