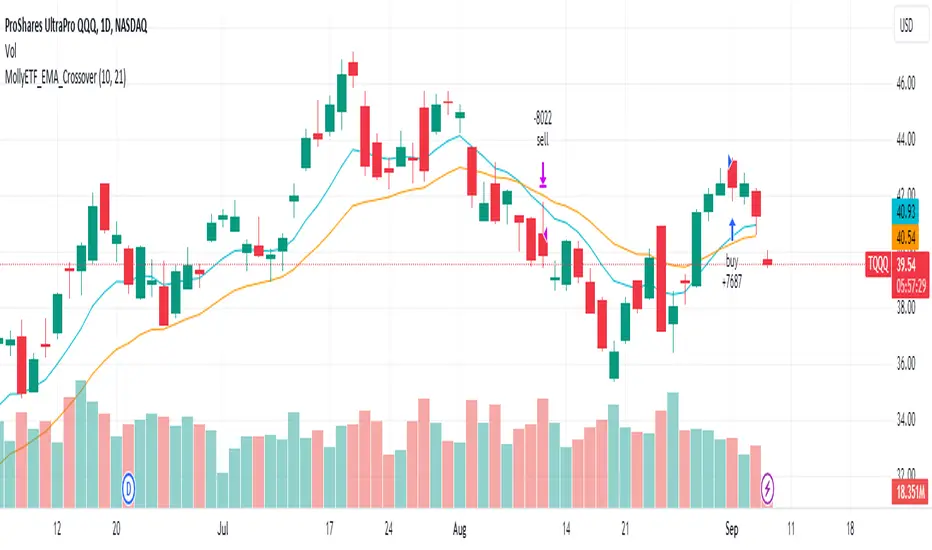
FlexiMA Variance Tracker - Strategy [presentTrading]█ Introduction and How It Is Different
The FlexiMA Variance Tracker by PresentTrading introduces a novel approach to technical trading strategies. Unlike traditional methods, it calculates deviations between a chosen indicator source (such as price or average) and a moving average with a variable length. This flexibility is achieved through a unique combination of a starting factor and an increment factor, allowing the moving average to adapt dynamically within a specified range. This strategy provides a more responsive and nuanced view of market trends, setting it apart from standard trading methodologies.
BTC 8h L/S
Local
█ Strategy, How It Works: Detailed Explanation
The FlexiMA Variance Tracker, developed by PresentTrading, stands at the forefront of trading strategies, distinguished by its adaptive and multifaceted approach to market analysis. This strategy intricately weaves various technical elements to construct a comprehensive trading logic. Here's an in-depth professional breakdown:
🔶Foundation on Variable-Length Moving Averages:
Central to this strategy is the concept of variable-length Moving Averages (MAs). Unlike traditional MAs with a fixed period, this strategy dynamically adjusts the length of the MA based on a starting factor and an incremental factor. This approach allows the strategy to adapt to market volatility and trend strength more effectively.
Each MA iteration offers a distinct temporal perspective, capturing short-term price movements to long-term trends. This aggregation of various time frames provides a richer and more nuanced market analysis, essential for making informed trading decisions.
🔶Deviation Analysis and Normalization:
The strategy calculates deviations of the price (or the chosen indicator source) from each of these MAs. These deviations are pivotal in identifying the immediate market direction relative to the average trend captured by each MA.
To standardize these deviations for comparability, they undergo a normalization process. The choice of normalization method (Max-Min or Absolute Sum) can significantly influence the interpretation of market conditions, offering distinct insights into price movements and trend strength.
🔹Normalization: Absolute Sum
🔶Composite Oscillator Construction:
A composite oscillator is derived from the median of these normalized deviations. The median serves as a balanced and robust central trend indicator, minimizing the impact of outliers and market noise.
Additionally, the standard deviation of these deviations is computed, providing a measure of market volatility. This volatility indicator is crucial for assessing market risk and can guide traders in setting appropriate stop-loss and take-profit levels.
🔶Integration with SuperTrend Indicator:
The FlexiMA strategy integrates the SuperTrend indicator, renowned for its effectiveness in identifying trend direction and reversals. The SuperTrend's incorporation enhances the strategy's ability to filter out false signals and confirm genuine market trends.
* The SuperTrend Toolkit is made by @QuantiLuxe
This combination of the variable-length MA oscillator with the SuperTrend indicator forms a potent duo, offering traders a dual-confirmation mechanism for trade signals.
🔹Supertrend's incorporation
🔶Strategic Trade Signal Generation:
Trade signals are generated when there is a confluence between the composite oscillator and the SuperTrend indicator. For example, a long position signal might be considered when the oscillator suggests an uptrend, and the SuperTrend flips to bullish.
The strategy's parameters are fully customizable, enabling traders to tailor the signal generation process to their specific trading style, risk tolerance, and market conditions.
█ Usage
To effectively employ the FlexiMA Variance Tracker strategy:
Traders should set their desired trade direction and fine-tune the starting and increment factors according to their market analysis and risk tolerance.
Indicator Length: 5
Indicator Length: 40
The strategy is suitable for a wide range of markets and can be adapted to different time frames, making it a versatile tool for various trading scenarios.
█ Default Settings Impact on Performance: FlexiMA Variance Tracker
1. Trade Direction (Configurable: Long, Short, Both): Determines trade types. 'Long' for buying, 'Short' for selling, 'Both' adapts to market trends.
2. Indicator Source: HLC3: Balances market sentiment by considering high, low, and close, providing comprehensive period analysis.
4. Indicator Length (Default: 10): Baseline for moving averages. Shorter lengths increase responsiveness but add noise, while longer lengths favor trends.
5. Starting and Increment Factor (Default: 1.0): Adjusts MA lengths range. Higher values capture broad market dynamics, lower values focus analysis.
6. Normalization Method (Options: None, Max-Min, Absolute Sum): Standardizes deviations. 'None' for raw deviations, 'Max-Min' for relative scaling, 'Absolute Sum' emphasizes relative strength.
7. SuperTrend Settings (ATR Length: 10, Multiplier: 15.0): Influences indicator sensitivity. Short ATR or high multiplier for short-term, long ATR or low multiplier for long-term trends.
8. Additional Settings (Mesh Style, Color Customization): Enhances visual clarity. Mesh style for detailed deviation view, colors for quick market condition identification.
Đường Trung bình trượt

TASC 2024.01 Gap Momentum System█ OVERVIEW
TASC's January 2024 edition of Traders' Tips features an article titled “Gap Momentum” by Perry J. Kaufman. The article discusses how a trader might create a momentum strategy based on opening gap data. This script implements the Gap Momentum system presented therein.
█ CONCEPTS
In the article, Perry J. Kaufman introduces Gap Momentum as a cumulative series constructed in the same way as On-Balance Volume (OBV) , but using gap openings (today’s open minus yesterday’s close).
To smoothen the resulting time series (i.e., obtain the " signal line "), the author applies a simple moving average . Subsequently, he proposes the following two trading rules for a long-only trading system:
• Enter a long position when the signal line is moving higher.
• Exit when the signal line is moving lower.
█ CALCULATIONS
The calculation of Gap Momentum involves the following steps:
1. Calculate the ratio of the sum of positive gaps over the past N days to the sum of negative gaps (absolute values) over the same time period.
2. Add the resulting gap ratio to the cumulative time series. This time series is the Gap Momentum.
3. Keep moving forward, as in an N-day moving average.

MACD of Relative Strenght StrategyMACD Relative Strenght Strategy :
INTRODUCTION :
This strategy is based on two well-known indicators: MACD and Relative Strenght (RS). By coupling them, we obtain powerful buy signals. In fact, the special feature of this strategy is that it creates an indicator from an indicator. Thus, we construct a MACD whose source is the value of the RS. The strategy only takes buy signals, ignoring SHORT signals as they are mostly losers. There's also a money management method enabling us to reinvest part of the profits or reduce the size of orders in the event of substantial losses.
RELATIVE STRENGHT :
RS is an indicator that measures the anomaly between momentum and the assumption of market efficiency. It is used by professionals and is one of the most robust indicators. The idea is to own assets that do better than average, based on their past performance. We calculate RS using this formula :
RS = close/highest_high(RS_Length)
Where highest_high(RS_Length) = highest value of the high over a user-defined time period (which is the RS_Length).
We can thus situate the current price in relation to its highest price over this user-defined period.
MACD (Moving Average Convergence - Divergence) :
This is one of the best-known indicators, measuring the distance between two exponential moving averages : one fast and one slower. A wide distance indicates fast momentum and vice versa. We'll plot the value of this distance and call this line macdline. The MACD uses a third moving average with a lower period than the first two. This last moving average will give a signal when it crosses the macdline. It is therefore constructed using the values of the macdline as its source.
It's important to note that the first two MAs are constructed using RS values as their source. So we've just built an indicator of an indicator. This kind of method is very powerful because it is rarely used and brings value to the strategy.
PARAMETERS :
RS Length : Relative Strength length i.e. the number of candles back to find the highest high and compare the current price with this high. Default is 300.
MACD Fast Length : Relative Strength fast EMA length used to plot the MACD. Default is 14.
MACD Slow Length : Relative Strength slow EMA length used to plot the MACD. Default is 26.
MACD Signal Smoothing : Macdline SMA length used to plot the MACD. Default is 10.
Max risk per trade (in %) : The maximum loss a trade can incur (in percentage of the trade value). Default is 8%.
Fixed Ratio : This is the amount of gain or loss at which the order quantity is changed. Default is 400, meaning that for each $400 gain or loss, the order size is increased or decreased by a user-selected amount.
Increasing Order Amount : This is the amount to be added to or subtracted from orders when the fixed ratio is reached. The default is $200, which means that for every $400 gain, $200 is reinvested in the strategy. On the other hand, for every $400 loss, the order size is reduced by $200.
Initial capital : $1000
Fees : Interactive Broker fees apply to this strategy. They are set at 0.18% of the trade value.
Slippage : 3 ticks or $0.03 per trade. Corresponds to the latency time between the moment the signal is received and the moment the order is executed by the broker.
Important : A bot has been used to test the different parameters and determine which ones maximize return while limiting drawdown. This strategy is the most optimal on BITSTAMP:ETHUSD in 8h timeframe with the parameters set by default.
ENTER RULES :
The entry rules are very simple : we open a long position when the MACD value turns positive. You are therefore LONG when the MACD is green.
EXIT RULES :
We exit a position (whether losing or winning) when the MACD becomes negative, i.e. turns red.
RISK MANAGEMENT :
This strategy can incur losses, so it's important to manage our risks well. If the position is losing and has incurred a loss of -8%, our stop loss is activated to limit losses.
MONEY MANAGEMENT :
The fixed ratio method was used to manage our gains and losses. For each gain of an amount equal to the value of the fixed ratio, we increase the order size by a value defined by the user in the "Increasing order amount" parameter. Similarly, each time we lose an amount equal to the value of the fixed ratio, we decrease the order size by the same user-defined value. This strategy increases both performance and drawdown.
Enjoy the strategy and don't forget to take the trade :)

Trend-based Price Action StrategyThis is a strategy script that combines trend-based price action analysis with the Relative Strength Index (RSI) and Exponential Moving Averages (EMA) as trend filters. Here's a summary of the key components and logic:
Price Action Candlestick Patterns:
Bullish patterns: Engulfing candle and Morning Star.
Bearish patterns: Engulfing candle and Evening Star.
RSI Integration:
RSI is used to identify overbought and oversold conditions.
EMA Trend Filter:
Three EMAs with different periods: Fast , Medium and Slow.
Long trend condition occur when the fast EMA is above the medium and the medium is above the slow EMA.
Short trend condition occur when the slow EMA is above the medium and the medium is above the fast EMA.
Long entry conditions: RSI is oversold, RSI is decreasing, bullish candlestick pattern, and EMA trend filter conditions are met.
Short entry conditions: RSI is overbought, RSI is decreasing, bearish candlestick pattern, and EMA trend filter conditions are met.
Exit conditions:
Take profit or stop loss is reached.
Plotting:
Signals are plotted on the chart when entry conditions are met.
EMAs are plotted when the EMA trend filter is enabled.
This script aims to capture potential trend reversal points based on a combination of candlestick patterns, RSI, and EMA trend analysis.
Traders can use this script as a starting point for further customization or as a reference for developing their own trading strategies. It's important to note that past performance is not indicative of future results, and thorough testing and validation are recommended before deploying any trading strategy.

RSI & Backed-Weighted MA StrategyRSI & MA Strategy :
INTRODUCTION :
This strategy is based on two well-known indicators that work best together: the Relative Strength Index (RSI) and the Moving Average (MA). We're going to use the RSI as a trend-follower indicator, rather than a reversal indicator as most are used to. To the signals sent by the RSI, we'll add a condition on the chart's MA, filtering out irrelevant signals and considerably increasing our winning rate. This is a medium/long-term strategy. There's also a money management method enabling us to reinvest part of the profits or reduce the size of orders in the event of substantial losses.
RSI :
The RSI is one of the best-known and most widely used indicators in trading. Its purpose is to warn traders when an asset is overbought or oversold. It was designed to send reversal signals, but we're going to use it as a trend indicator by increasing its length to 20. The RSI formula is as follows :
RSI (n) = 100 - (100 / (1 + (H (n)/L (n))))
With n the length of the RSI, H(n) the average of days closing above the open and L(n) the average of days closing below the open.
MA :
The Moving Average is also widely used in technical analysis, to smooth out variations in an asset. The SMA formula is as follows :
SMA (n) = (P1 + P2 + ... + Pn) / n
where n is the length of the MA.
However, an SMA does not weight any of its terms, which means that the price 10 days ago has the same importance as the price 2 days ago or today's price... That's why in this strategy we use a RWMA, i.e. a back-weighted moving average. It weights old prices more heavily than new ones. This will enable us to limit the impact of short-term variations and focus on the trend that was dominating. The RWMA used weights :
The 4 most recent terms by : 100 / (4+(n-4)*1.30)
The other oldest terms by : weight_4_first_term*1.30
So the older terms are weighted 1.30 more than the more recent ones. The moving average thus traces a trend that accentuates past values and limits the noise of short-term variations.
PARAMETERS :
RSI Length : Lenght of RSI. Default is 20.
MA Type : Choice between a SMA or a RWMA which permits to minimize the impact of short term reversal. Default is RWMA.
MA Length : Length of the selected MA. Default is 19.
RSI Long Signal : Minimum value of RSI to send a LONG signal. Default is 60.
RSI Short signal : Maximum value of RSI to send a SHORT signal. Default is 40.
ROC MA Long Signal : Maximum value of Rate of Change MA to send a LONG signal. Default is 0.
ROC MA Short signal : Minimum value of Rate of Change MA to send a SHORT signal. Default is 0.
TP activation in multiple of ATR : Threshold value to trigger trailing stop Take Profit. This threshold is calculated as multiple of the ATR (Average True Range). Default value is 5 meaning that to trigger the trailing TP the price need to move 5*ATR in the right direction.
Trailing TP in percentage : Percentage value of trailing Take Profit. This Trailing TP follows the profit if it increases, remaining selected percentage below it, but stops if the profit decreases. Default is 3%.
Fixed Ratio : This is the amount of gain or loss at which the order quantity is changed. Default is 400, which means that for each $400 gain or loss, the order size is increased or decreased by a user-selected amount.
Increasing Order Amount : This is the amount to be added to or subtracted from orders when the fixed ratio is reached. The default is $200, which means that for every $400 gain, $200 is reinvested in the strategy. On the other hand, for every $400 loss, the order size is reduced by $200.
Initial capital : $1000
Fees : Interactive Broker fees apply to this strategy. They are set at 0.18% of the trade value.
Slippage : 3 ticks or $0.03 per trade. Corresponds to the latency time between the moment the signal is received and the moment the order is executed by the broker.
Important : A bot has been used to test the different parameters and determine which ones maximize return while limiting drawdown. This strategy is the most optimal on BITSTAMP:ETHUSD with a timeframe set to 6h. Parameters are set as follows :
MA type: RWMA
MA Length: 19
RSI Long Signal: >60
RSI Short Signal : <40
ROC MA Long Signal : <0
ROC MA Short Signal : >0
TP Activation in multiple ATR : 5
Trailing TP in percentage : 3
ENTER RULES :
The principle is very simple:
If the asset is overbought after a bear market, we are LONG.
If the asset is oversold after a bull market, we are SHORT.
We have defined a bear market as follows : Rate of Change (20) RWMA < 0
We have defined a bull market as follows : Rate of Change (20) RWMA > 0
The Rate of Change is calculated using this formula : (RWMA/RWMA(20) - 1)*100
Overbought is defined as follows : RSI > 60
Oversold is defined as follows : RSI < 40
LONG CONDITION :
RSI > 60 and (RWMA/RWMA(20) - 1)*100 < -1
SHORT CONDITION :
RSI < 40 and (RWMA/RWMA(20) - 1)*100 > 1
EXIT RULES FOR WINNING TRADE :
We have a trailing TP allowing us to exit once the price has reached the "TP Activation in multiple ATR" parameter, i.e. 5*ATR by default in the profit direction. TP trailing is triggered at this point, not limiting our gains, and securing our profits at 3% below this trigger threshold.
Remember that the True Range is : maximum(H-L, H-C(1), C-L(1))
with C : Close, H : High, L : Low
The Average True Range is therefore the average of these TRs over a length defined by default in the strategy, i.e. 20.
RISK MANAGEMENT :
This strategy may incur losses. The method for limiting losses is to set a Stop Loss equal to 3*ATR. This means that if the price moves against our position and reaches three times the ATR, we exit with a loss.
Sometimes the ATR can result in a SL set below 10% of the trade value, which is not acceptable. In this case, we set the SL at 10%, limiting losses to a maximum of 10%.
MONEY MANAGEMENT :
The fixed ratio method was used to manage our gains and losses. For each gain of an amount equal to the value of the fixed ratio, we increase the order size by a value defined by the user in the "Increasing order amount" parameter. Similarly, each time we lose an amount equal to the value of the fixed ratio, we decrease the order size by the same user-defined value. This strategy increases both performance and drawdown.
Enjoy the strategy and don't forget to take the trade :)

hamster-bot MRS 2 (simplified version) MRS - Mean Reversion Strategy (Countertrend) (Envelope strategy)
This script does not claim to be unique and does not mislead anyone. Even the unattractive backtest result is attached. The source code is open. The idea has been described many times in various sources. But at the same time, their collection in one place provides unique opportunities.
Published by popular demand and for ease of use. so that users can track the development of the script and can offer their ideas in the comments. Otherwise, you have to communicate in several telegram chats.
Representative of the family of counter-trend strategies. The basis of the strategy is Mean reversion . You can also read about the Envelope strategy .
Mean reversion , or reversion to the mean, is a theory used in finance that suggests that asset price volatility and historical returns eventually will revert to the long-run mean or average level of the entire dataset.
The strategy is very simple. Has very few settings. Good for beginners to get acquainted with algorithmic trading. A simple adjustment will help avoid overfitting. There are many variations of this strategy, but for understanding it is better to start with this implementation.
Principle of operation.
1)
A conventional MA is being built. (fuchsia line). A limit order is placed on this line to close the position.
2)
(green line) A limit order is placed on this line to open a long position
3)
(red line) A limit order is placed on this line to open a short position
Attention!
Please note that a limit order is used. Conclude that the strategy has a limited capacity. And the results obtained on low-liquid instruments will be too high in the tester. On real auctions there will be a different result.
Note for testing the strategy in the spot market:
When testing in the spot market, do not include both long and short at the same time. It is recommended to test only the long mode on the spot. Short mode for more advanced users.
Settings:
Available types of moving averages:
SMA
EMA
TEMA - triple exponential moving average
DEMA - Double Exponential Moving Average
ZLEMA - Zero lag exponential moving average
WMA - weighted moving average
Hma - Hull Moving Average
Thma - Triple Exponential Hull Moving Average
Ehma - Exponential Hull Moving Average
H - MA built based on highs for n candles | ta.highest(len)
L - MA built based on lows for n candles | ta.lowest(len)
DMA - Donchian Moving Average
A Kalman filter can be applied to all MA
The peculiarity of the strategy is a large selection of MA and the possibility of shifting lines. You can set up a reverse trending strategy on the Donchian channel for example.
Use Long - enable/disable opening a Long position
Use Short - enable/disable opening a Short position
Lot Long, % - % allocated from the deposit for opening a Long position. In the spot market, do not use % greater than 100%
Lot Short, % - allocated % of the deposit for opening a Short position
Start date - the beginning of the testing period
End date - the end of the testing period (Example: only August 2020 can be tested)
Mul - multiplier. Used to offset lines. Example:
Mul = 0.99 is shift -1%
Mul = 1.01 is shift +1%
Non-strict recommendations:
1) Test the SPOT market on crypto exchanges. (The countertrend strategy has liquidation risk on futures)
2) Symbols altcoin/bitcoin or altcoin/altcoin. Example: ETH/BTC or DOGE/ETH
3) Timeframe is usually 1 hour
If the script passes moderation, I will supplement it by adding separate settings for closing long and short positions according to their MA

Multi-TF AI SuperTrend with ADX - Strategy [PresentTrading]
## █ Introduction and How it is Different
The trading strategy in question is an enhanced version of the SuperTrend indicator, combined with AI elements and an ADX filter. It's a multi-timeframe strategy that incorporates two SuperTrends from different timeframes and utilizes a k-nearest neighbors (KNN) algorithm for trend prediction. It's different from traditional SuperTrend indicators because of its AI-based predictive capabilities and the addition of the ADX filter for trend strength.
BTC 8hr Performance
ETH 8hr Performance
## █ Strategy, How it Works: Detailed Explanation (Revised)
### Multi-Timeframe Approach
The strategy leverages the power of multiple timeframes by incorporating two SuperTrend indicators, each calculated on a different timeframe. This multi-timeframe approach provides a holistic view of the market's trend. For example, a 8-hour timeframe might capture the medium-term trend, while a daily timeframe could capture the longer-term trend. When both SuperTrends align, the strategy confirms a more robust trend.
### K-Nearest Neighbors (KNN)
The KNN algorithm is used to classify the direction of the trend based on historical SuperTrend values. It uses weighted voting of the 'k' nearest data points. For each point, it looks at its 'k' closest neighbors and takes a weighted average of their labels to predict the current label. The KNN algorithm is applied separately to each timeframe's SuperTrend data.
### SuperTrend Indicators
Two SuperTrend indicators are used, each from a different timeframe. They are calculated using different moving averages and ATR lengths as per user settings. The SuperTrend values are then smoothed to make them suitable for KNN-based prediction.
### ADX and DMI Filters
The ADX filter is used to eliminate weak trends. Only when the ADX is above 20 and the directional movement index (DMI) confirms the trend direction, does the strategy signal a buy or sell.
### Combining Elements
A trade signal is generated only when both SuperTrends and the ADX filter confirm the trend direction. This multi-timeframe, multi-indicator approach reduces false positives and increases the robustness of the strategy.
By considering multiple timeframes and using machine learning for trend classification, the strategy aims to provide more accurate and reliable trade signals.
BTC 8hr Performance (Zoom-in)
## █ Trade Direction
The strategy allows users to specify the trade direction as 'Long', 'Short', or 'Both'. This is useful for traders who have a specific market bias. For instance, in a bullish market, one might choose to only take 'Long' trades.
## █ Usage
Parameters: Adjust the number of neighbors, data points, and moving averages according to the asset and market conditions.
Trade Direction: Choose your preferred trading direction based on your market outlook.
ADX Filter: Optionally, enable the ADX filter to avoid trading in a sideways market.
Risk Management: Use the trailing stop-loss feature to manage risks.
## █ Default Settings
Neighbors (K): 3
Data points for KNN: 12
SuperTrend Length: 10 and 5 for the two different SuperTrends
ATR Multiplier: 3.0 for both
ADX Length: 21
ADX Time Frame: 240
Default trading direction: Both
By customizing these settings, traders can tailor the strategy to fit various trading styles and assets.

2 Moving Averages | Trend FollowingThe trading system is a trend-following strategy based on two moving averages (MA) and Parabolic SAR (PSAR) indicators.
How it works:
The strategy uses two moving averages: a fast MA and a slow MA.
It checks for a bullish trend when the fast MA is above the slow MA and the current price is above the fast MA.
It checks for a bearish trend when the fast MA is below the slow MA and the current price is below the fast MA.
The Parabolic SAR (PSAR) indicator is used for additional trend confirmation.
Long and short positions can be turned on or off based on user input.
The strategy incorporates risk management with stop-loss orders based on the Average True Range (ATR).
Users can filter the backtest date range and display various indicators.
The strategy is designed to work with the date range filter, risk management, and user-defined positions.
Features:
Trend-following strategy.
Two customizable moving averages.
Parabolic SAR for trend confirmation.
User-defined risk management with stop-loss based on ATR.
Backtest date range filter.
Flexibility to enable or disable long and short positions.
This trading system provides a comprehensive approach to trend-following and risk management, making it suitable for traders looking to capture trends with controlled risk.

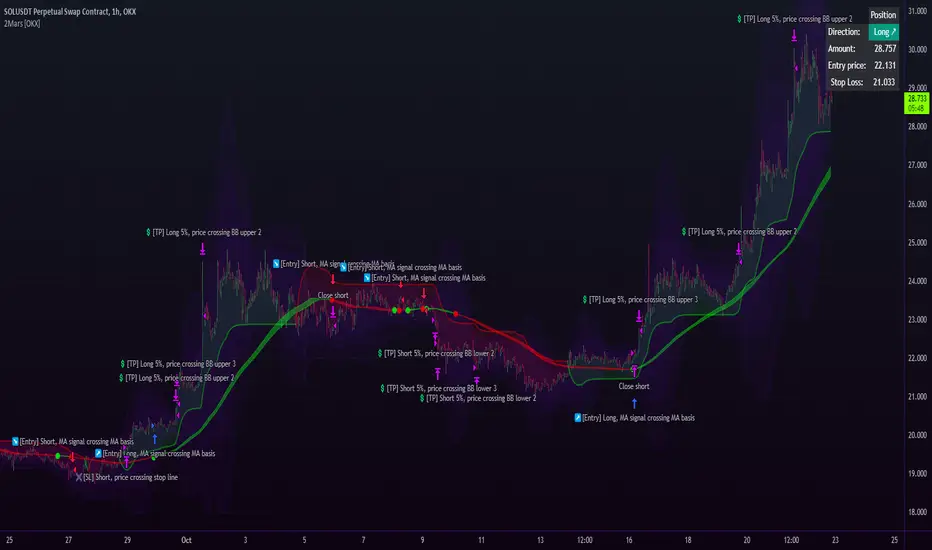
2Mars - MA / BB / SuperTrend
The 2Mars strategy is a trading approach that aims to improve trading efficiency by incorporating several simple order opening tactics. These tactics include moving average crossovers, Bollinger Bands, and SuperTrend.
Entering a Position with the 2Mars Strategy:
Moving Average Crossover: This method considers the crossing of moving averages as a signal to enter a position.
Price Crossing Bollinger Bands: If the price crosses either the upper or lower Bollinger Band, it is seen as a signal to enter a position.
Price Crossing Moving Average: If the price crosses the moving average, it is also considered a signal to enter a position.
SuperTrend and Bars confirm:
The SuperTrend indicator is used to provide additional confirmation for entering positions and setting stop loss levels. "Bars confirm" is used only for entry to positions.
Moving Average Crossover Strategy:
A moving average crossover refers to the point on a chart where there is a crossover of the signal or fast moving average, above or below the basis or slow moving average. This strategy also uses moving averages for additional orders #3.
Basis Moving Average Length: Ratio * Multiplier
Signal Moving Average Length: Multiplier
Bollinger Bands:
Bollinger Bands consist of three bands: an upper band, a lower band, and a basis moving average. However, the 2Mars strategy incorporates multiple upper and lower levels for position entry and take profit.
Basis +/- StdDev * 0.618
Basis +/- StdDev * 1.618
Basis +/- StdDev * 2.618
Additional Orders:
Additional Order #1 and #2: closing price crosses above or below the Bollinger Bands.
Additional Order #3: closing price crosses above or below the basis or signal moving average.
Take Profit:
The strategy includes three levels for taking profits, which are based on the Bollinger Bands. Additionally, a percentage of the position can be chosen to close long or short positions.
Limit Orders:
The strategy allows for entering a position using a limit order. The calculation for the limit order involves the Average True Range (ATR) for a specific period.
For long positions: Low price - ATR * Multiplier
For short positions: High price + ATR * Multiplier
Stop Loss:
To manage risk, the strategy recommends using stop loss options. The stop loss is updated with each entry order and take-profit level 3. When using the SuperTrend Confirmation, the stop loss requires confirmation of a trend change. It allows for flexible adjustment of the stop loss when the trend changes.
There are three options for setting the stop loss:
1. ATR (Average True Range):
For long positions: Low price - ATR * Long multiplier
For short positions: High price + ATR * Short multiplier
2. SuperTrend + ATR:
For long positions: SuperTrend - ATR * Long multiplier
For short positions: SuperTrend + ATR * Short multiplier
3. StdDev:
For long positions: StdDev - ATR * Long multiplier
For short positions: StdDev + ATR * Short multiplier
Flexible Stop Loss:
There is also a flexible stop loss option for the ATR and StdDev methods. It is triggered when the SuperTrend or moving average trend changes unfavorably.
For long positions: Stop-loss price + (ATR * Long multiplier) * Multiplier
For short positions: Stop-loss price - (ATR * Short multiplier) * Multiplier
How configure:
Disable SuperTrend, take profit, stop loss, additional orders and begin setting up a strategy.
Pick soucre data
Number of bars for confirm
Pick up the ratio of the base moving average and the signal moving average.
Set up a SuperTrend
Time for set up of the Bollinger Bands and the take profit
And finaly set up of stop loss and limit orders
All done!
For OKX exchange:

Machine Learning: SuperTrend Strategy TP/SL [YinYangAlgorithms]The SuperTrend is a very useful Indicator to display when trends have shifted based on the Average True Range (ATR). Its underlying ideology is to calculate the ATR using a fixed length and then multiply it by a factor to calculate the SuperTrend +/-. When the close crosses the SuperTrend it changes direction.
This Strategy features the Traditional SuperTrend Calculations with Machine Learning (ML) and Take Profit / Stop Loss applied to it. Using ML on the SuperTrend allows for the ability to sort data from previous SuperTrend calculations. We can filter the data so only previous SuperTrends that follow the same direction and are within the distance bounds of our k-Nearest Neighbour (KNN) will be added and then averaged. This average can either be achieved using a Mean or with an Exponential calculation which puts added weight on the initial source. Take Profits and Stop Losses are then added to the ML SuperTrend so it may capitalize on Momentum changes meanwhile remaining in the Trend during consolidation.
By applying Machine Learning logic and adding a Take Profit and Stop Loss to the Traditional SuperTrend, we may enhance its underlying calculations with potential to withhold the trend better. The main purpose of this Strategy is to minimize losses and false trend changes while maximizing gains. This may be achieved by quick reversals of trends where strategic small losses are taken before a large trend occurs with hopes of potentially occurring large gain. Due to this logic, the Win/Loss ratio of this Strategy may be quite poor as it may take many small marginal losses where there is consolidation. However, it may also take large gains and capitalize on strong momentum movements.
Tutorial:
In this example above, we can get an idea of what the default settings may achieve when there is momentum. It focuses on attempting to hit the Trailing Take Profit which moves in accord with the SuperTrend just with a multiplier added. When momentum occurs it helps push the SuperTrend within it, which on its own may act as a smaller Trailing Take Profit of its own accord.
We’ve highlighted some key points from the last example to better emphasize how it works. As you can see, the White Circle is where profit was taken from the ML SuperTrend simply from it attempting to switch to a Bullish (Buy) Trend. However, that was rejected almost immediately and we went back to our Bearish (Sell) Trend that ended up resulting in our Take Profit being hit (Yellow Circle). This Strategy aims to not only capitalize on the small profits from SuperTrend to SuperTrend but to also capitalize when the Momentum is so strong that the price moves X% away from the SuperTrend and is able to hit the Take Profit location. This Take Profit addition to this Strategy is crucial as momentum may change state shortly after such drastic price movements; and if we were to simply wait for it to come back to the SuperTrend, we may lose out on lots of potential profit.
If you refer to the Yellow Circle in this example, you’ll notice what was talked about in the Summary/Overview above. During periods of consolidation when there is little momentum and price movement and we don’t have any Stop Loss activated, you may see ‘Signal Flashing’. Signal Flashing is when there are Buy and Sell signals that keep switching back and forth. During this time you may be taking small losses. This is a normal part of this Strategy. When a signal has finally been confirmed by Momentum, is when this Strategy shines and may produce the profit you desire.
You may be wondering, what causes these jagged like patterns in the SuperTrend? It's due to the ML logic, and it may be a little confusing, but essentially what is happening is the Fast Moving SuperTrend and the Slow Moving SuperTrend are creating KNN Min and Max distances that are extreme due to (usually) parabolic movement. This causes fewer values to be added to and averaged within the ML and causes less smooth and more exponential drastic movements. This is completely normal, and one of the perks of using k-Nearest Neighbor for ML calculations. If you don’t know, the Min and Max Distance allowed is derived from the most recent(0 index of data array) to KNN Length. So only SuperTrend values that exhibit distances within these Min/Max will be allowed into the average.
Since the KNN ML logic can cause these exponential movements in the SuperTrend, they likewise affect its Take Profit. The Take Profit may benefit from this movement like displayed in the example above which helped it claim profit before then exhibiting upwards movement.
By default our Stop Loss Multiplier is kept quite low at 0.0000025. Keeping it low may help to reduce some Signal Flashing while not taking extra losses more so than not using it at all. However, if we increase it even more to say 0.005 like is shown in the example above. It can really help the trend keep momentum. Please note, although previous results don’t imply future results, at 0.0000025 Stop Loss we are currently exhibiting 69.27% profit while at 0.005 Stop Loss we are exhibiting 33.54% profit. This just goes to show that although there may be less Signal Flashing, it may not result in more profit.
We will conclude our Tutorial here. Hopefully this has given you some insight as to how Machine Learning, combined with Trailing Take Profit and Stop Loss may have positive effects on the SuperTrend when turned into a Strategy.
Settings:
SuperTrend:
ATR Length: ATR Length used to create the Original Supertrend.
Factor: Multiplier used to create the Original Supertrend.
Stop Loss Multiplier: 0 = Don't use Stop Loss. Stop loss can be useful for helping to prevent false signals but also may result in more loss when hit and less profit when switching trends.
Take Profit Multiplier: Take Profits can be useful within the Supertrend Strategy to stop the price reverting all the way to the Stop Loss once it's been profitable.
Machine Learning:
Only Factor Same Trend Direction: Very useful for ensuring that data used in KNN is not manipulated by different SuperTrend Directional data. Please note, it doesn't affect KNN Exponential.
Rationalized Source Type: Should we Rationalize only a specific source, All or None?
Machine Learning Type: Are we using a Simple ML Average, KNN Mean Average, KNN Exponential Average or None?
Machine Learning Smoothing Type: How should we smooth our Fast and Slow ML Datas to be used in our KNN Distance calculation? SMA, EMA or VWMA?
KNN Distance Type: We need to check if distance is within the KNN Min/Max distance, which distance checks are we using.
Machine Learning Length: How far back is our Machine Learning going to keep data for.
k-Nearest Neighbour (KNN) Length: How many k-Nearest Neighbours will we account for?
Fast ML Data Length: What is our Fast ML Length?? This is used with our Slow Length to create our KNN Distance.
Slow ML Data Length: What is our Slow ML Length?? This is used with our Fast Length to create our KNN Distance.
If you have any questions, comments, ideas or concerns please don't hesitate to contact us.
HAPPY TRADING!

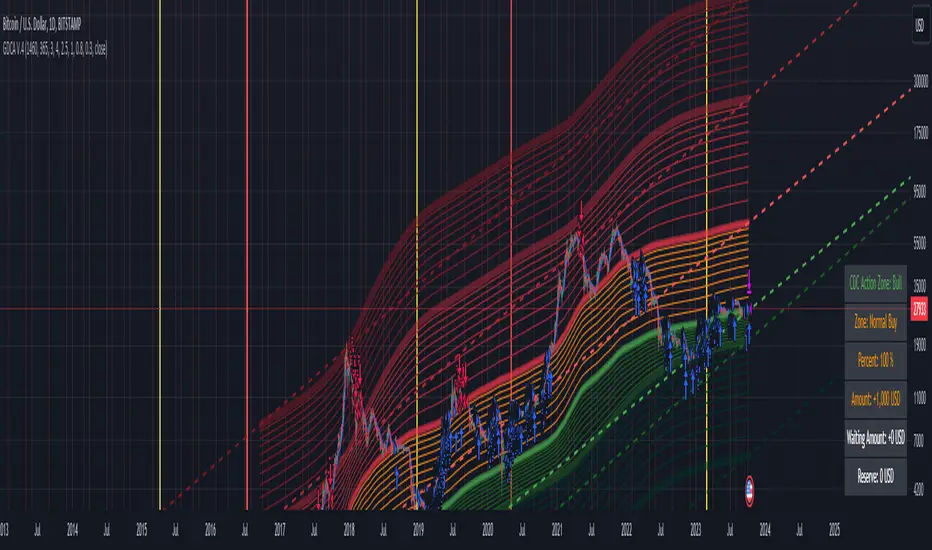
Grospector DCA V.4This is system for DCA with strategy and can trade on trend technique "CDC Action Zone".
We upgrade Grospector DCA V.3 by minimizing unnecessary components and it is not error price predictions.
This has 5 zone Extreme high , high , normal , low , Extreme low. You can dynamic set min - max percent every zone.
Extreme zone is derivative short and long which It change Extreme zone to Normal zone all position will be closed.
Every Zone is splitted 10 channel. and this strategy calculate contribution.
and now can predict price in future.
Idea : Everything has average in its life. For bitcoin use 4 years for halving. I think it will be interesting price.
Default : I set MA is 365*4 days and average it again with 365 days.
Input :
len: This input represents the length of the moving average.
strongLen: This input represents the length of the moving average used to calculate the strong buy and strong sell zone.
shortMulti: This input represents the multiplier * moveing average used to calculate the short zone.
strongSellMulti: This input represents the multiplier used to calculate the strong sell signal.
sellMulti: This input represents the multiplier * moveing average used to calculate the sell zone.
strongBuyMulti: This input represents the multiplier used to calculate the strong sell signal.
longMulti: This input represents the multiplier * moveing average used to calculate the long zone.
*Diff sellMulti and strongBuyMulti which is normal zone.
useDerivative: This input is a boolean flag that determines whether to use the derivative display zone. If set to true, the derivative display zone will be used, otherwise it will be hidden.
zoneSwitch: This input determines where to display the channel signals. A value of 1 will display the signals in all zones, a value of 2 will display the signals in the chart pane, a value of 3 will display the signals in the data window, and a value of 4 will hide the signals.
price: Defines the price source used for the indicator calculations. The user can select from various options, with the default being the closing price.
labelSwitch: Defines whether to display assistive text on the chart. The user can select a boolean value (true/false), with the default being true.
zoneSwitch: Defines which areas of the chart to display assistive zones. The user can select from four options: 1 = all, 2 = chart only, 3 = data only, 4 = none. The default value is 2.
predictFuturePrice: Defines whether to display predicted future prices on the chart. The user can select a boolean value (true/false), with the default being true.
DCA: Defines the dollar amount to use for dollar-cost averaging (DCA) trades. The user can input an integer value, with a default value of 5.
WaitingDCA: Defines the amount of time to wait before executing a DCA trade. The user can input a float value, with a default value of 0.
Invested: Defines the amount of money invested in the asset. The user can input an integer value, with a default value of 0.
strategySwitch: Defines whether to turn on the trading strategy. The user can select a boolean value (true/false), with the default being true.
seperateDayOfMonth: Defines a specific day of the month on which to execute trades. The user can input an integer value from 1-31, with the default being 28.
useReserve: Defines whether to use a reserve amount for trading. The user can select a boolean value (true/false), with the default being true.
useDerivative: Defines whether to use derivative data for the indicator calculations. The user can select a boolean value (true/false), with the default being true.
useHalving: Defines whether to use halving data for the indicator calculations. The user can select a boolean value (true/false), with the default being true.
extendHalfOfHalving: Defines the amount of time to extend the halving date. The user can input an integer value, with the default being 200.
Every Zone: It calculate percent from top to bottom which every zone will be splited 10 step.
To effectively make the DCA plan, I recommend adopting a comprehensive strategy that takes into consideration your mindset as the best indicator of the optimal approach. By leveraging your mindset, the task can be made more manageable and adaptable to any market
Dollar-cost averaging (DCA) is a suitable investment strategy for sound money and growth assets which It is Bitcoin, as it allows for consistent and disciplined investment over time, minimizing the impact of market volatility and potential risks associated with market timing
[blackcat] L1 MartinGale Scalping Strategy**MartinGale Strategy** is a popular money management strategy used in trading. It is commonly applied in situations where the trader aims to recover from a losing streak by increasing the position size after each loss.
In the MartinGale Strategy, after a losing trade, the trader doubles the position size for the next trade. This is done in the hopes that a winning trade will eventually occur, which will not only recover the previous losses but also generate a profit.
The idea behind the MartinGale Strategy is to take advantage of the law of averages. By increasing the position size after each loss, the strategy assumes that eventually, a winning trade will occur, which will not only cover the previous losses but also generate a profit. This can be especially appealing for traders looking for a quick recovery from a losing streak.
However, it is important to note that the MartinGale Strategy carries significant risks. If a trader experiences a prolonged losing streak or lacks sufficient capital, the strategy can lead to substantial losses. The strategy's reliance on the assumption of a winning trade can be dangerous, as there is no guarantee that a winning trade will occur within a certain timeframe.
Traders considering implementing the MartinGale Strategy should carefully assess their risk tolerance and thoroughly understand the potential drawbacks. It is crucial to have a solid risk management plan in place to mitigate potential losses. Additionally, traders should be aware that the strategy may not be suitable for all market conditions and may require adjustments based on market volatility.
In summary, the MartinGale Strategy is a money management strategy that involves increasing the position size after each loss in an attempt to recover from a losing streak. While it can offer the potential for quick recovery, it also comes with significant risks that traders should carefully consider before implementing it in their trading approach.
The MartinGale Scalping Strategy is a trading strategy designed to generate profits through frequent trades. It utilizes a combination of moving average crossovers and crossunders to generate entry and exit signals. The strategy is implemented in TradingView's Pine Script language.
The strategy begins by defining input variables such as take profit and stop loss levels, as well as the trading mode (long, short, or bidirectional). It then sets a rule to allow only long entries if the trading mode is set to "Long".
The strategy logic is defined using SMA (Simple Moving Average) crossover and crossunder signals. It calculates a short-term SMA (SMA3) and a longer-term SMA (SMA8), and plots them on the chart. The crossoverSignal and crossunderSignal variables are used to track the occurrence of the crossover and crossunder events, while the crossoverState and crossunderState variables determine the state of the crossover and crossunder conditions.
The strategy execution is based on the current position size. If the position size is zero (no open positions), the strategy checks for crossover and crossunder events. If a crossover event occurs and the trading mode allows long entries, a long position is entered. The entry price, stop price, take profit price, and stop loss price are calculated based on the current close price and the SMA8 value. Similarly, if a crossunder event occurs and the trading mode allows short entries, a short position is entered with the corresponding price calculations.
If there is an existing long position and the current close price reaches either the take profit price or the stop loss price, and a crossunder event occurs, the long position is closed. The entry price, stop price, take profit price, and stop loss price are reset to zero.
Likewise, if there is an existing short position and the current close price reaches either the take profit price or the stop loss price, and a crossover event occurs, the short position is closed and the price variables are reset.
The strategy also plots entry and exit points on the chart using plotshape function. It displays a triangle pointing up for a buy entry, a triangle pointing down for a buy exit, a triangle pointing down for a sell entry, and a triangle pointing up for a sell exit.
Overall, the MartinGale Scalping Strategy aims to capture small profits by taking advantage of short-term moving average crossovers and crossunders. It incorporates risk management through take profit and stop loss levels, and allows for different trading modes to accommodate different market conditions.

Double AI Super Trend Trading - Strategy [PresentTrading]█ Introduction and How It is Different
The Double AI Super Trend Trading Strategy is a cutting-edge approach that leverages the power of not one, but two AI algorithms, in tandem with the SuperTrend technical indicator. The strategy aims to provide traders with enhanced precision in market entry and exit points. It is designed to adapt to market conditions dynamically, offering the flexibility to trade in both bullish and bearish markets.
*The KNN part is mainly referred from @Zeiierman.
BTCUSD 8hr performance
ETHUSD 8hr performance
█ Strategy, How It Works: Detailed Explanation
1. SuperTrend Calculation
The SuperTrend is a popular indicator that captures market trends through a combination of the Volume-Weighted Moving Average (VWMA) and the Average True Range (ATR). This strategy utilizes two sets of SuperTrend calculations with varying lengths and factors to capture both short-term and long-term market trends.
2. KNN Algorithm
The strategy employs k-Nearest Neighbors (KNN) algorithms, which are supervised machine learning models. Two sets of KNN algorithms are used, each focused on different lengths of historical data and number of neighbors. The KNN algorithms classify the current SuperTrend data point as bullish or bearish based on the weighted sum of the labels of the k closest historical data points.
3. Signal Generation
Based on the KNN classifications and the SuperTrend indicator, the strategy generates signals for the start of a new trend and the continuation of an existing trend.
4. Trading Logic
The strategy uses these signals to enter long or short positions. It also incorporates dynamic trailing stops for exit conditions.
Local picture
█ Trade Direction
The strategy allows traders to specify their trading direction: long, short, or both. This enables the strategy to be versatile and adapt to various market conditions.
█ Usage
ToolTips: Comprehensive tooltips are provided for each parameter to guide the user through the customization process.
Inputs: Traders can customize numerous parameters including the number of neighbors in KNN, ATR multiplier, and types of moving averages.
Plotting: The strategy also provides visual cues on the chart to indicate bullish or bearish trends.
Order Execution: Based on the generated signals, the strategy will execute buy or sell orders automatically.
█ Default Settings
The default settings are configured to offer a balanced approach suitable for most scenarios:
Initial Capital: $10,000
Default Quantity Type: 10% of equity
Commission: 0.1%
Slippage: 1
Currency: USD
These settings can be modified to suit various trading styles and asset classes.

2Mars strategy [OKX]The strategy is based on the intersection of two moving averages, which requires adjusting the parameters (ratio and multiplier) for the moving average.
Basis MA length: multiplier * ratio
Signal MA length: multiplier
The SuperTrend indicator is used for additional confirmation of entry into a position.
Bollinger Bands and position reversal are used for take-profit.
About stop loss:
If activated, the stop loss price will be updated on every entry.
Basic setup:
Additional:
Alerts for OKX:
Keltner Channel Strategy with Golden CrossOnly trade with the trend.
This Keltner Channel-based strategy that will only enter into a trade if the signal of the Keltner Channel agrees with a moving average crossover as defined by the user.
Long Position Entries
2 Conditions must be present
1. There must be a Golden Cross (lower period moving average is above higher period moving average). ex 50 period MA > 200 period MA.
2. Price must cross above the Keltner Channel ATR defined by the user.
Short Position Entries
2 Conditions must be present
1. There must be a Death Cross (lower period moving average is below higher period moving average). ex 50 period MA < 200 period MA.
2. Price must cross below the Keltner Channel ATR defined by the user
Closing Trades:
The strategy closes trades as follows:
1. Price crossing the Keltner Channel's Take Profit ATR (defined by User)
2. Price crossing the Keltner Channel's Stop Loss ATR (defined by User)

Advanced EMA Cross with Normalized ATR Filter, Controlling ADX
Description:
This strategy is based on EMA cross strategy and additional filters are used to get better results, a normalized ATR filter, and ADX control...
It aims to provide traders with a code base that generates signals for long positions based on market conditions defined by various indicators.
How it Works:
1. EMA: Uses short (8 periods) and long (20 periods) EMAs to identify crossovers.
2. ATR: Uses a 14-period ATR, normalized to its 20-period historical range, to filter out noise.
3. ADX: Uses a 14-period RMA to identify strong trends.
4. Volume: Filters trades based on a 14-period SMA of volume.
5. Super Trend: Uses a Super Trend indicator to identify the market direction.
How to Use:
- Buy Signal: Generated when EMA short crosses above EMA long, and other conditions like ATR and market direction are met.
- Sell Signal: Generated based on EMA crossunder and high ADX value.
Originality and Usefulness:
This script combines EMA, ATR, ADX, and Super Trend indicators to filter out false signals and identify more reliable trading opportunities.
USD Strength in the code is not working, just simulated it as PSEUDO CODE:
Strategy Results:
- Account Size: $1000
- Commission: Not considered
- Slippage: Not considered
- Risk: Manageable through parameters, now less than 5% per trade
- Dataset: Aim for more than 100 trades for a sufficient sample size
- Test Conditions: Test in 30 min chart for BTCUSDT
IMPORTANT NOTE: This script should be used for educational purposes and should not be considered as financial advice.
Chart:
- The script's output is plotted as Buy and Sell signals on the chart.
- No other scripts are included for clarity.
- Have tested with 30mins period
- You are encouraged to play with parameters, let me know if it helps you and/or if you can upgrade the code to a better level.
WHY DID I USE ATR AND ADX?
ATR filter is usually used for the following purposes.
Market Volatility: ATR measures how volatile the market is. High ATR values indicate that the price is experiencing significant fluctuations.
Filtering: Crossing a certain ATR threshold may indicate that the market is active enough to present trading opportunities.
Risk Management: ATR can also be used to set stop-loss and take-profit levels, helping to manage risk effectively.
And ADX is usually used for;
Trend Strength: ADX measures the strength of a trend. High ADX values indicate a strong trend.
Filtering: An ADX value above a certain level suggests that the trend is strong and it might be safer to trade.
Versatility: ADX does not indicate the direction of the trend, only its strength. This makes it useful in both bullish and bearish markets.
Using these indicators together can help filter out false signals and produce more reliable trading signals. While ATR helps to determine if the market is active enough, ADX measures the strength of the trend. Combined, they can create a more complex and effective trading strategy.
I've used ADX data to support generating a buy signal after a golden cross (bullish trend) and waiting until this is a strong trend. It sounds good to check for different trend strengths for bullish and bearish markets to decide a buy signal. Additionally I used ATR to check if the market has enough fluctuations.

OKX: MA CrossoverEXAMPLE Scripte from my stream , how to use OKX webhooks for create strategy on Pine with real\demo trading on your OKX account. This strategy only for test the functional forward orders to OKX. The backtest not included commisions and other.
OKX MA Crossover. This strategy generate JSONs for place orders on the exchange by alerts and webhooks.
In the script 2 function to generate entry and exit orders, and input parameters that needed for setup exchange.
Use it for test this stack and to write you own strategy for trade on the OKX Exchange.

AI SuperTrend - Strategy [presentTrading]
█ Introduction and How it is Different
The AI Supertrend Strategy is a unique hybrid approach that employs both traditional technical indicators and machine learning techniques. Unlike standard strategies that rely solely on traditional indicators or mathematical models, this strategy integrates the power of k-Nearest Neighbors (KNN), a machine learning algorithm, with the tried-and-true SuperTrend indicator. This blend aims to provide traders with more accurate, responsive, and context-aware trading signals.
*The KNN part is mainly referred from @Zeiierman.
BTCUSD 8hr performance
ETHUSD 8hr performance
█ Strategy, How it Works: Detailed Explanation
SuperTrend Calculation
Volume-Weighted Moving Average (VWMA): A VWMA of the close price is calculated based on the user-defined length (len). This serves as the central line around which the upper and lower bands are calculated.
Average True Range (ATR): ATR is calculated over a period defined by len. It measures the market's volatility.
Upper and Lower Bands: The upper band is calculated as VWMA + (factor * ATR) and the lower band as VWMA - (factor * ATR). The factor is a user-defined multiplier that decides how wide the bands should be.
KNN Algorithm
Data Collection: An array (data) is populated with recent n SuperTrend values. Corresponding labels (labels) are determined by whether the weighted moving average price (price) is greater than the weighted moving average of the SuperTrend (sT).
Distance Calculation: The absolute distance between each data point and the current SuperTrend value is calculated.
Sorting & Weighting: The distances are sorted in ascending order, and the closest k points are selected. Each point is weighted by the inverse of its distance to the current point.
Classification: A weighted sum of the labels of the k closest points is calculated. If the sum is closer to 1, the trend is predicted as bullish; if closer to 0, bearish.
Signal Generation
Start of Trend: A new bullish trend (Start_TrendUp) is considered to have started if the current trend color is bullish and the previous was not bullish. Similarly for bearish trends (Start_TrendDn).
Trend Continuation: A bullish trend (TrendUp) is considered to be continuing if the direction is negative and the KNN prediction is 1. Similarly for bearish trends (TrendDn).
Trading Logic
Long Condition: If Start_TrendUp or TrendUp is true, a long position is entered.
Short Condition: If Start_TrendDn or TrendDn is true, a short position is entered.
Exit Condition: Dynamic trailing stops are used for exits. If the trend does not continue as indicated by the KNN prediction and SuperTrend direction, an exit signal is generated.
The synergy between SuperTrend and KNN aims to filter out noise and produce more reliable trading signals. While SuperTrend provides a broad sense of the market direction, KNN refines this by predicting short-term price movements, leading to a more nuanced trading strategy.
Local picture
█ Trade Direction
The strategy allows traders to choose between taking only long positions, only short positions, or both. This is particularly useful for adapting to different market conditions.
█ Usage
ToolTips: Explains what each parameter does and how to adjust them.
Inputs: Customize values like the number of neighbors in KNN, ATR multiplier, and moving average type.
Plotting: Visual cues on the chart to indicate bullish or bearish trends.
Order Execution: Based on the generated signals, the strategy will execute buy/sell orders.
█ Default Settings
The default settings are selected to provide a balanced approach, but they can be modified for different trading styles and asset classes.
Initial Capital: $10,000
Default Quantity Type: 10% of equity
Commission: 0.1%
Slippage: 1
Currency: USD
By combining both machine learning and traditional technical analysis, this strategy offers a sophisticated and adaptive trading solution.

Strategy Gaussian Anomaly DerivativeConcept behind this Strategy :
Considering a normal "buy/sell" situation, an asset would be bought in average at the median price following a Gaussian like concept. A higher or lower average trend would significate that the current perceived value is respectively higher or lower than the current median price, which mean that the buyers are evaluating the price underpriced or overpriced.
This behaviour would be even more relevent depending on its derivative evolution.
Therefore, this Strategy setup is based on this Gaussian like concept anomaly of average close positionning compare to high-low average derivative, such as the derivative of the following ploted basic signal : 1-(high+low)/(2*close).
This Strategy can actually be used like a trend change and continuation strength indicator aswell.
In the Setup Signal part :
You can define the filtering of the basis signal "1-(high+low)/(2*close)" on EMA or SMA as you wish.
You can define the corresponding period and the threathold as a mutiply of the average 1/3 of all time value of the basis signal.
You can define the SMA filtering period of the Derivative signal and the corresponding threathold on the same mutiply of the average 1/3 of all time value of the derivative.
In the Setup Strategy part :
You can set up your strategy assesment based on Long and/or Short. You can also define the considered period.
The most successful tuned strategies I did were based on the derivative indicator with periods on the basis signal and the derivative under 30, can be 1 to 3 of te derivative and 7 to 21 for the basis signal. The threathold depends on the asset volatility aswell, 1 is usually the most efficient but 0 to 10 can be relevent depending on the situation I met. You can find an example of tuning for this strategy based on Kering's case hereafter.
I hoping that you will enjoy using this Strategy, don't hesitate to comment, to question, to correct or complete it ! I would be very curious about similar famous approaches that would have already been made.
Thank to you !
3kilos BTC 15mThe "3kilos BTC 15m" is a comprehensive trading strategy designed to work on a 15-minute timeframe for Bitcoin (BTC) or other cryptocurrencies. This strategy combines multiple indicators, including Triple Exponential Moving Averages (TEMA), Average True Range (ATR), and Heikin-Ashi candlesticks, to generate buy and sell signals. It also incorporates risk management features like take profit and stop loss.
Indicators
Triple Exponential Moving Averages (TEMA): Three TEMA lines are used with different lengths and sources:
Short TEMA (Red) based on highs
Long TEMA 1 (Blue) based on lows
Long TEMA 2 (Green) based on closing prices
Average True Range (ATR): Custom ATR calculation with EMA smoothing is used for volatility measurement.
Supertrend: Calculated using ATR and a multiplier to determine the trend direction.
Simple Moving Average (SMA): Applied to the short TEMA to smooth out its values.
Heikin-Ashi Close: Used for additional trend confirmation.
Entry & Exit Conditions
Long Entry: Triggered when the short TEMA is above both long TEMA lines, the Supertrend is bullish, the short TEMA is above its SMA, and the Heikin-Ashi close is higher than the previous close.
Short Entry: Triggered when the short TEMA is below both long TEMA lines, the Supertrend is bearish, the short TEMA is below its SMA, and the Heikin-Ashi close is lower than the previous close.
Take Profit and Stop Loss: Both are calculated as a percentage of the entry price, and they are set for both long and short positions.
Risk Management
Take Profit: Set at 1% above the entry price for long positions and 1% below for short positions.
Stop Loss: Set at 3% below the entry price for long positions and 3% above for short positions.
Commission and Pyramiding
Commission: A 0.07% commission is accounted for in the strategy.
Pyramiding: The strategy does not allow pyramiding.
Note
This strategy is designed for educational purposes and should not be considered as financial advice. Always do your own research and consider consulting a financial advisor before engaging in trading.

Trend Confirmation StrategyThe profitability and uniqueness of a trading strategy depend on various factors including market conditions, risk management, and the strategy's ability to capitalize on price movements. I'll describe the strategy provided and highlight its potential benefits and differences compared to other strategies:
Strategy Overview:
The provided strategy combines three technical indicators: Supertrend, MACD, and VWAP. It aims to identify potential entry and exit points by confirming trend direction and considering the proximity to the VWAP level. The strategy also incorporates stop-loss and take-profit mechanisms, as well as a trailing stop.
Unique Aspects and Potential Benefits:
Trend Confirmation: The strategy uses both Supertrend and MACD to confirm the trend direction. This dual confirmation can increase the likelihood of accurate trend identification and filter out false signals.
VWAP Confirmation: The strategy considers the proximity of the price to the VWAP level. This dynamic level can act as a support or resistance and provide additional context for entry decisions.
Adaptive Stop Loss: The strategy sets a stop-loss range, which helps provide some tolerance for minor price fluctuations. This adaptive approach considers market volatility and helps prevent premature stop-loss triggers.
Trailing Stop: The strategy incorporates a trailing stop mechanism to lock in profits as the trade moves in the desired direction. This can potentially enhance profitability during strong trends.
Partial Profit Booking: While not explicitly implemented in the provided code, you could consider booking partial profits when the MACD shows a crossover in the opposite direction. This aspect could help secure gains while still keeping exposure to potential further price movements.
Key Differences from Other Strategies:
Dual Indicator Confirmation: The combination of Supertrend and MACD for trend confirmation is a unique aspect of this strategy. It adds an extra layer of filtering to enhance the accuracy of entry signals.
Dynamic VWAP: Incorporating the VWAP level into the decision-making process adds a dynamic element to the strategy. VWAP is often used by institutional traders, and its inclusion can provide insights into the market sentiment.
Adaptive Stop Loss and Trailing: The strategy's use of an adaptive stop-loss range and a trailing stop can help manage risk and protect profits more effectively during changing market conditions.
Partial Profit Booking: The suggestion to consider partial profit booking upon MACD crossovers in the opposite direction is a practical approach to secure gains while staying in the trade.
Caution and Considerations:
Backtesting: Before deploying any strategy in real trading, it's crucial to thoroughly backtest it on historical data to understand its performance under various market conditions.
Risk Management: While the strategy has built-in risk management mechanisms, it's essential to carefully manage position sizes and overall portfolio risk.
Market Conditions: No strategy works well in all market conditions. It's important to be flexible and adjust the strategy or refrain from trading during particularly volatile or unpredictable periods.
Continuous Monitoring: Even though the strategy includes automated components, continuous monitoring of the trades and market conditions is necessary.
Adaptability: Markets can change over time. Traders need to be prepared to adapt the strategy as necessary to stay aligned with evolving market dynamics.

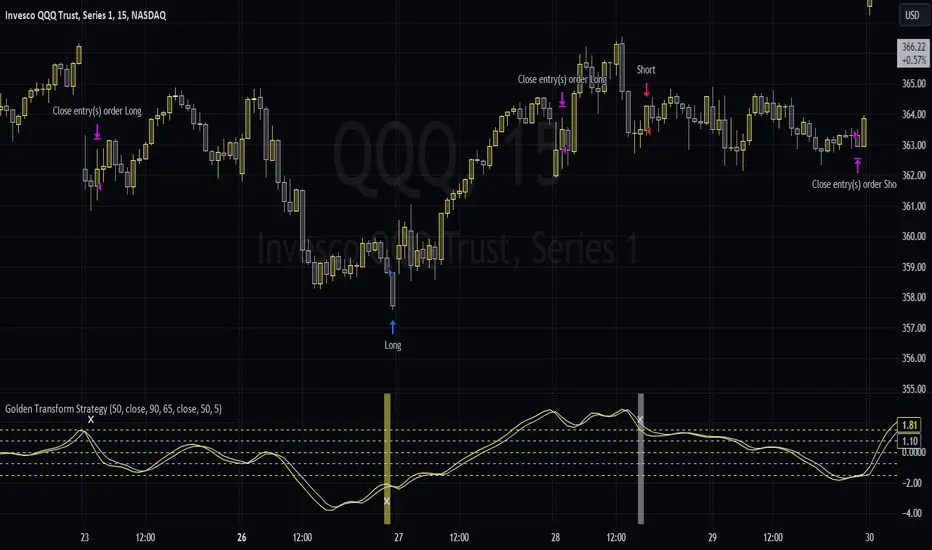
Golden Transform The Golden Transform Oscillator contains multiple technical indicators and conditions for making buy and sell decisions. Here's a breakdown of its components and what it's trying to achieve:
Strategy Setup:
The GT is designed to be plotted on the chart without overlaying other indicators.
Rate of Change (ROC) Calculation:
The Rate of Change (ROC) indicator is calculated with a specified period ("Rate of Change Length").
The ROC measures the percentage change in price over the specified period.
Hull Modified TRIX Calculation:
The Hull Modified TRIX indicator is calculated with a specified period ("Hull TRIX Length").
The Hull MA (Moving Average) formula, a modified WMA, is used to calculate a modified TRIX indicator, which is a momentum oscillator.
Hull MA Calculation:
A Hull Moving Average (Hull MA) is calculated as an entry filter.
Fisher Transform Calculation:
The Fisher Transform indicator is calculated to serve as a preemptive exit filter.
It involves mathematical transformations of price data to create an oscillator that can help identify potential reversals. The Fisher Transform is further smoothed using a Hull Moving Average (HMA).
Conditions and Signals:
Long conditions are determined based on crossovers between ROC and TRIX, as well as price relative the the MA. Short conditions are inversed.
Exit Conditions:
Exit conditions are defined for both long and short positions.
For long positions, the strategy exits if ROC crosses under TRIX, or if the smoothed Fisher Transform crosses above a threshold and declines. Once again, short conditions are the inverse.
Visualization and Plotting:
The script uses background colors for entry and shapes for exits to highlight different levels and conditions for the ROC/TRIX correlation.
It plots the Fisher Transform values and a lag trigger on the chart.
Overall, this script is a complex algorithm that combines multiple technical indicators and conditions to generate trading signals and manage positions in the financial markets. It aims to identify potential entry and exit points based on the interplay of the mentioned indicators and conditions.