Moving averages & clouds
Hi all!
This is a script that lets you have 3 moving averages (of a user defined type) and maybe have an alternative cloud (fill) between them. The cloud can be customized and turned on/off in the "style" tab for the indicator.
Alerts can be configured to fire on up/down/all crosses and are activated when the whole candle has crossed the morning average.
A higher time frame can be configured for the moving averages.
You can hide the moving average, but show the cloud:
You can have multiple clouds:
You can have moving averages from a higher time frame (here from weekly time frame on a daily chart):
Best of trading luck!
Multi-timeframe

Multi Time Frame RSI PanelDescription:
The "Multi Time Frame RSI Panel" indicator is a powerful tool designed to help traders analyze the Relative Strength Index (RSI) across multiple timeframes simultaneously. While the core logic of this indicator is proprietary, this description aims to provide traders with an understanding of its functionality and utility.
Key Features:
Multi-Timeframe Analysis: This indicator displays RSI values for different timeframes, including 1 minute (1m), 5 minutes (5m), 15 minutes (15m), 30 minutes (30m), 1 hour (1h), 2 hours (2h), 4 hours (4h), and 1 day (1d). Traders can choose which timeframes to display on their chart based on their trading strategy.
Customizable Thresholds: Users can set upper and lower RSI thresholds for each timeframe, allowing for the identification of overbought and oversold conditions. The indicator highlights RSI values that breach these thresholds in green (for overbought) or red (for oversold), providing visual cues for potential trading opportunities.
How to Use:
1. Add the "Multi Time Frame RSI Panel" indicator to your TradingView chart.
2. Configure the settings by selecting the timeframes you want to monitor and setting your preferred RSI thresholds.
3. Monitor the RSI values for each selected timeframe in the panel located at the top right corner of your chart.
4. Look for potential trading signals based on RSI conditions, such as overbought or oversold levels, across different timeframes.

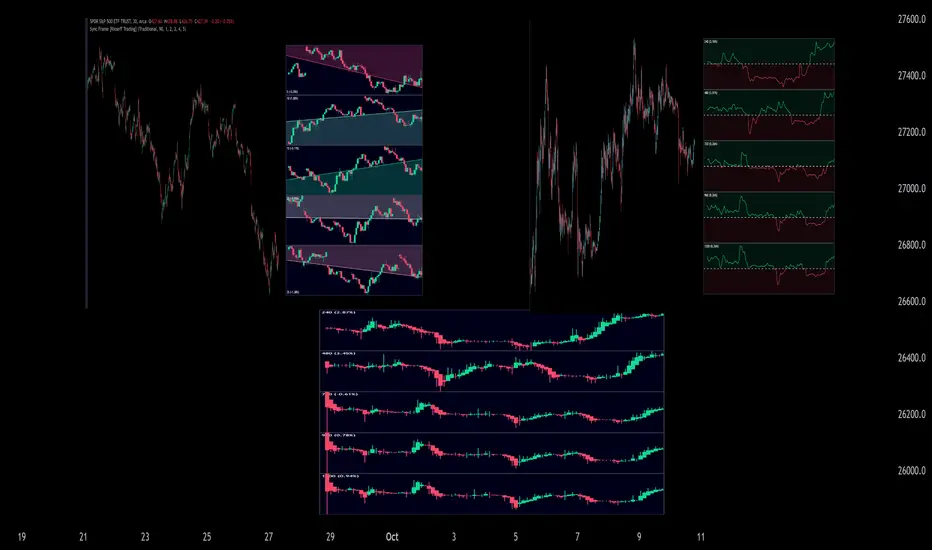
Sync Frame (MTF Charts) [Kioseff Trading]Hello!
This indicator "Sync Frame" displays various lower timeframe charts for the asset on your screen!
5 lower timeframe candle charts shown
Timeframes auto-calculated using the new timeframe.from_seconds() function
Heikin-Ashi candles available
Baseline chart type available
Dynamic Scaling for ease of use
User customizable timeframes
Simple script (:
The image above shows the baseline chart type.
Time image above shows a traditional candlestick chart.
The image above shows a hekin-ashi chart.
The image above shows the indicator when nearly zoomed in as much as possible. The lower timeframe charts adjust to my chart positioning.
The image above shows my screen fully zoomed out; the lower timeframe charts adjust in both height and width to accommodate my chart positioning!
Thank you for checking this out (:
[Holy] Candle BlocksThis experimental indicator overlays candles from higher timeframes directly onto your current chart. The concept of Candle Blocks aims to offer an intuitive way to view price action across multiple periods simultaneously.
FEATURES
Multiple Timeframe Support: Choose from various timeframes to overlay, such as hourly, daily, weekly, etc.
Customizable Opacity: Adjust the transparency of the overlay to ensure the primary chart remains visible.
Color Coding: The overlay uses distinct colors to indicate bullish and bearish candles from the higher timeframe.
Real-time Update: The overlay updates in real-time as new higher timeframe candles are formed.
USE CASES
Trend Confirmation: Validate the trend direction of your primary timeframe by examining higher timeframe Candle Blocks.
Support & Resistance: Identify key support and resistance levels more clearly by seeing them on multiple timeframes.
Fourth-Dimensional Decision Making: This indicator aims to move towards a 4th-dimensional trading perspective, where time is considered as a vector. This helps traders to always make decisions with multiple timeframes in mind.
EXPERIMENTAL
This indicator is in its experimental stage, and future updates will be made based on its effectiveness and the feedback received. If you find this concept useful or have suggestions for improvement, please provide feedback. This will aid in further development and refinement of the indicator.

Consolidation Spotter Multi Time FrameThis tool is designed for traders looking to spot areas of consolidation on their charts across various time frames. It highlights these consolidation areas using visually appealing boxes, making it easier to identify potential breakout or breakdown zones.
How To Use:
Spotting Consolidation: When you see a box form on your chart, this represents a consolidation zone. Within this zone, the price is moving sideways without a strong upward or downward trend.
Anticipating Breakouts & Breakdowns: Watch the price as it approaches the edges of the box. A movement outside the box can signal a potential breakout (if above the box) or a breakdown (if below the box). This is where momentum shifts can happen.
Momentum Confirmation: Once the price clearly moves out of the box, it indicates a momentum shift. If the price moves upwards out of the box, this can be seen as bullish momentum. Conversely, if the price moves downwards out of the box, this can be seen as bearish momentum.
To use the tool effectively, adjust the settings to suit your trading style, choose your preferred visual theme, and watch as the script highlights key consolidation areas on your chart.
Tip: To visualize fractals, consider using multiple instances of the "Consolidation Spotter" indicator, each set to a different timeframe. This approach allows you to observe consolidations nested within larger consolidations, offering deeper insights into market structures. 😉

External Indicator Analysis Overlay | Buy/Sell | HTF Heikin-AshiThis chart overlay offers multiple candlestick display options. The Regular (Japanese) and the Heikin-Ashi candles are well known. The Mari-Ashi (or Renko) option is something special as it should be timeframe independent, so that sideways action should be represented in one candle. That is difficult to realize as an overlay on the normal candlestick structure, but perhaps the chosen implementation is useful nonetheless. The Velocity option is experimental and is designed to show if the price has accelerated too much in a trend direction. In this case, the highs and lows do not reflect the actual highs and lows, but indicate the overshooting velocity. The opening of the candle also depends on the inherent velocity, but the close of the candle is always the actual close. Anyway, it doesn't look very useful, but the option is there.
All options can be applied to higher timeframes. A usable setting is obtained by disabling only the body of the TradingView candles in regular mode and enabling this overlay.
A large part of this overlay consists of buy/sell indication settings. For activation it is necessary to select an external source. For example the “Relative Bi-Directional Volatility Range”, specifically the Trend Shift Signal (TSS). This signal switches from 0 to 1, if the trend becomes bullish or from 0 to -1, if the trend becomes bearish. It will be automatically detected without specifying the Indication Type. Alternatively, the Volatility Moving Average (VMA) would meet the requirements for the Indication Type “Buy = positive | Sell = negative”. The Moving Average Convergence Divergence (MACD) also fulfills these conditions. Another example is to use any Moving Average with the Indication Type “Buy = rising | Sell = falling”. In the chart above the Hull Moving Average (HMA) is used. In addition, it is possible to reverse the signal, so that positive signals become negative and vice versa. The signals will be labeled as Buy or Sell on the chart.
The user can analyze whether the provided signals are good or bad indications for going long or short or simply for rebalancing a portfolio. Therefore, it is possible to set a starting point for the analysis and choose a weighting for the investments from 0% to 100% of the portfolio. To avoid sleepless nights, a very reliable (and conservative) setting seems to be Rebalancing with 50% (very similar to the well-known 60/40 portfolio). The calculation results are shown in a table.
As a small addition there is the possibility to label the peaks by setting the distance between the highs/lows. This will make the quality of the buy and sell signals even more clear.

HighLowBox+220MAs[libHTF]HighLowBox+220MAs
This is a sample script of libHTF to use HTF values without request.security().
import nazomobile/libHTFwoRS/1
HTF candles are calculated internally using 'GMT+3' from current TF candles by libHTF .
To calcurate Higher TF candles, please display many past bars at first.
The advantage and disadvantage is that the data can be generated at the current TF granularity.
Although the signal can be displayed more sensitively, plots such as MAs are not smooth.
In this script, assigned ➊,➋,➌,➍ for htf1,htf2,htf3,htf4.
HTF candles
Draw candles for HTF1-4 on the right edge of the chart. 2 candles for each HTF.
They are updated with every current TF bar update.
Left edge of HTF candles is located at the x-postion latest bar_index + offset.
DMI HTF
ADX/+DI/DI arrows(8lines) are shown each timeframes range.
Current TF's is located at left side of the HighLowBox.
HTF's are located at HighLowBox of HTF candles.
The top of HighLowBox is 100, The bottom of HighLowBox is 0.
HighLowBox HTF
Enclose in a square high and low range in each timeframe.
Shows price range and duration of each box.
In current timeframe, shows Fibonacci Scale inside(23.6%, 38.2%, 50.0%, 61.8%, 76.4%)/outside of each box.
Outside(161.8%,261.8,361.8%) would be shown as next target, if break top/bottom of each box.
In HTF, shows Fibonacci Level of the current price at latest box only.
Boxes:
1 for current timeframe.
4 for higher timeframes.(Steps of timeframe: 5, 15, 60, 240, D, W, M, 3M, 6M, Y)
HighLowBox TrendLine
Draw TrendLine for each HighLow Range. TrendLine is drawn between high and return high(or low and return low) of each HighLowBox.
Style of TrendLine is same as each HighLowBox.
HighLowBox RSI
RSI Signals are shown at the bottom(RSI<=30) or the top(RSI>=70) of HighLowBox in each timeframe.
RSI Signal is color coded by RSI9 and RSI14 in each timeframe.(current TF: ●, HTF1-4: ➊➋➌➍)
In case of RSI<=30, Location: bottom of the HighLowBox
white: only RSI9 is <=30
aqua: RSI9&RSI14; <=30 and RSI9RSI14
green: only RSI14 <=30
In case of RSI>=70, Location: top of the HighLowBox
white: only RSI9 is >=70
yellow: RSI9&RSI14; >=70 and RSI9>RSI14
orange: RSI9&RSI14; >=70 and RSI9=70
blue/green and orange/red could be a oversold/overbought sign.
20/200 MAs
Shows 20 and 200 MAs in each TFs(tfChart and 4 Higher).
TFs:
current TF
HTF1-4
MAs:
20SMA
20EMA
200SMA
200EMA

Greedy DCA█ OVERVIEW
Detect price crashes in volatile conditions. This is an indicator for a greedy dollar cost average (DCA) strategy. That is, for people who want to repeatedly buy an asset over time when its price is crashing.
█ CONCEPTS
Price crashes are indicated if the price falls below one or more of the 4 lower Bollinger Bands which are calculated with increasing multipliers for the standard deviation.
In these conditions, the price is far below the average. Therefore they are considered good buying opportunities.
No buy signals are emitted if the Bollinger Bands are tight, i.e. if the bandwidth (upper -lower band) is below the value of the moving average multiplied with a threshold factor. This ensures that signals are only emitted if the conditions are highly volatile.
The Bollinger Bands are calculated based on the daily candles, irrespective the chart time frame. This allows to check the strategy on lower time frames

MTF Key Levels [Mxwll]Mxwll MTF S/R:
The Mxwll MTF Support & Resistance indicator is designed to identify crucial support and resistance levels across multiple timeframes. By considering various timeframes, this indicator provides a more comprehensive view of the market's underlying structure. It allows traders to extend lines in various configurations and covers timeframes ranging from 5 minutes to weekly. By considering price action across multiple timeframes, the indicator provides a more comprehensive understanding of the market's supply and demand dynamics. Traders can use the Mxwll MTF Support & Resistance Indicator to refine their trade entries and exits, manage risk, and establish potential price targets.
FEATURES
5 Minute to Weekly Key Levels
Accurate Multi-Timeframe Support and Resistance
Customize To Extend The Lines - Left, Right and Right Across The Chart
Interplay Between Support and Resistance Levels
Change Colours Of S&R
Change Colours Of S&R Lines
INSTRUCTIONS
Select Your Timeframe -> Unselect the S&R Levels That Are Less Than The Timeframe - Trade

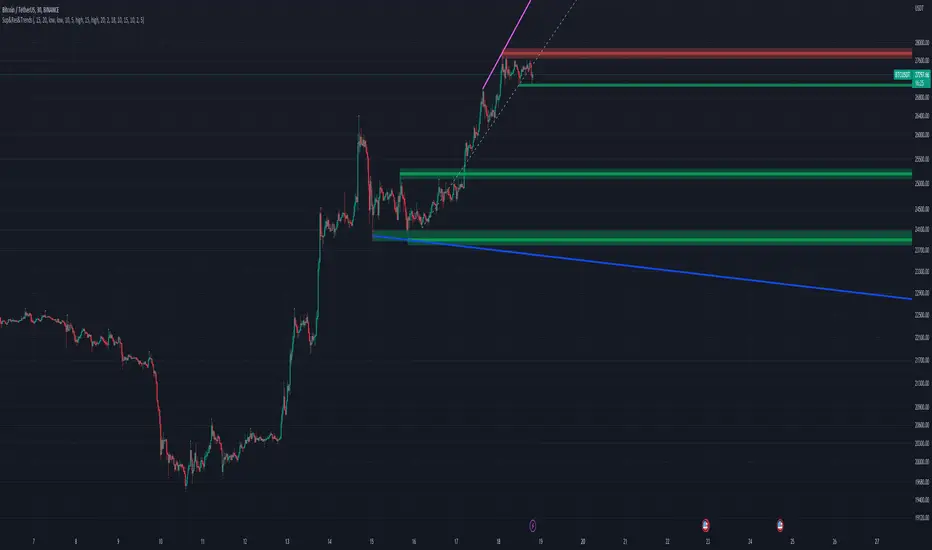
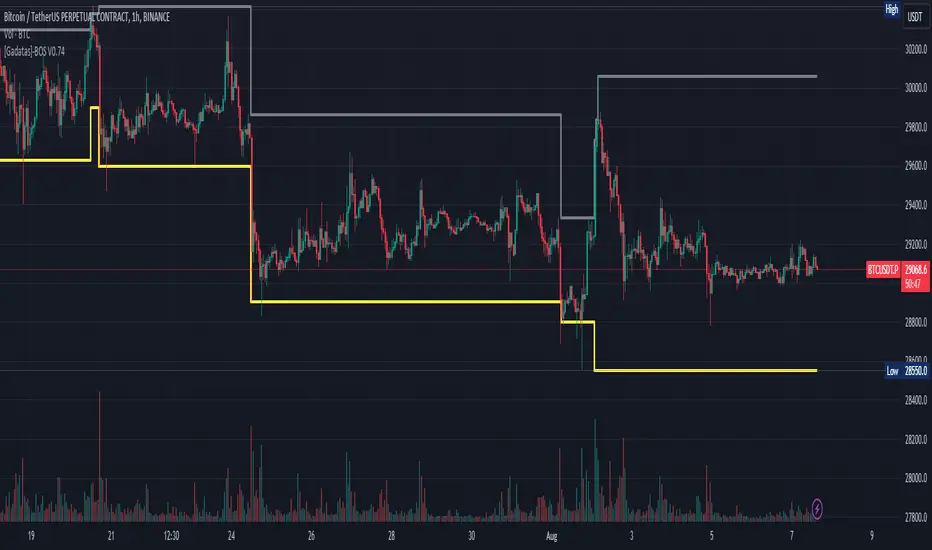
Brake Of Structure (BOS) By GadatasThis indicator is designed to identify and track swing highs and lows in a given market on any timeframe. It plots these swing highs and lows as solid lines on the chart. The indicator allows for customization of the line color and width and using another timeframe.
The indicator follows specific rules to determine when a new high or low is created. If the current range is considered bullish (meaning the most recent breakout was to the topside), the indicator will only update the low if a candle's body falls below the current low. However, if the current range is bearish (most recent breakout to the downside), the indicator will only update the high if a candle's body rises above the current high.
When a range is identified as bullish, the indicator will continue updating the high until a swing high is formed, denoting the high of the range. The high will only change if a candle's body surpasses the previous high. The low, on the other hand, will be updated based on the last time a candle's body falls below a previous candle's low. The lowest low after this condition is met will be assigned as the low of the range.
Conversely, when a range is identified as bearish, the indicator will continue updating the low until a swing low is formed, denoting the low of the range. The low will only change if a candle's body falls below the previous low. The high, in this case, will be updated based on the last time a candle's body rises above a previous candle's high. The highest high after this condition is met will be assigned as the high of the range.
Swing highs are determined by having lower highs to the left and right, while swing lows have higher lows to the left and right. These swings are used to determine the final high or low of a bullish or bearish range, respectively.
Tis Indicator differs from other indicators by incorporating this concept to track market structure. The indicator assumes that significant market players sell before making heavy purchases in bullish ranges and buy before selling heavily in bearish ranges. The lines on the chart represent prior highs and lows, as well as the current updated highs and lows based on this theory. By using this indicator, one can gain insights into the structure of price movement and potentially identify bullish or bearish continuations. It can also provide confluence when analyzing multiple timeframes to validate trend-following strategies.
RSI Multi Timeframe Based on Moving Average By Alireza PhoenixHi. I have prepared for you the multi-time frame RSI indicator based on moving average
You can use it in three different time frames
Open the settings and put the value you want in the Time 1 and Time 2 fields
In the fast and slow section, specify the length of the moving period of fast and slow origins as desired
In the offset section, you can add or reduce the time interval as you wish
This indicator shows you the RSI index in three different time frames along with two different lengths of the moving average based on the RSI index.
You can use this indicator in all financial, forex or crypto markets
The crossing of RSI and moving average lines in different time frames and lengths will give you a buy or sell signal.
Whenever the faster line or smaller RSI total frame succeeds in breaking the slower line or the RSI time is higher than the low, a free signal is issued and vice versa.
I do not guarantee that 100% of the issued signals are accurate and correct, and I have coded this indicator only for your convenience.
I hope you can get help from this indicator and make profit
Love From IRAN

MTF Evolving Weighted Composite Value Area🧾 Description:
This indicator calculates evolving value areas across 3 different timeframes/periods and combines them into one composite, multi-timeframe evolving value area - with each of the underlying timeframes' VAs assigned their own weighting/importance in the final calculation. Layered with extra smoothing options, this creates an informative and useful 'rolling value area' effect that can give you a better perspective on the value area across multiple periods at once as it develops - without total calculation resets at the onset of every new period.
Let's start with a simplified primer on value areas and then jump in to the new ideas this indicator introduces.
🤔 What is a value area?
Value areas are a tool used in market profile analysis to determine the range of prices that represents where most trading activity occurred during a specific time period, typically within a single 'bar' of a certain higher timeframe, such as the 4-hour, daily, or weekly. It helps traders understand the levels where the market finds value.
To calculate the value area, we look at the distribution of prices and trading volume. We determine a percentage, usually 70% or 80%, that represents the significant portion of trading volume. Then, we identify the price range that contains this percentage of trading volume, which becomes the value area.
Value areas are useful because they provide insights into market dynamics and potential support and resistance levels. They show where traders have been most active and where they find value, and traders can use this information to make better-informed decisions.
For example, if price is trading within the value area, it suggests that it's within a range where traders see value and are actively participating, which could indicate a balanced market. If the price moves above or below the value area, it may signal a potential shift in market sentiment or a breakout/breakdown from the established range.
By understanding the value area, traders can identify potential areas of supply and demand, determine levels of interest for buyers and sellers, and make decisions based on the market's perception of value.
📑 Limitations of traditional value areas
Static representation: Value areas are usually represented as static zones calculated after the fact. For example, after a daily period is completed, a typical 1D VA indicator will display the value area for the past period with static horizontal lines. This approach doesn't give you the power to see how the value area evolved, or developed, during the time period, as it is only displayed retroactively. It also doesn't give you the ability to view it as it evolves in real-time. This is why we chose to use an evolving value area representation, specifically borrowed from @sourcey's Value Area POC/VAH/VAL script function for calculating evolving VAs.
Rollover resets - no memory of past periods!: The traditional value area is calculated over a static period - it is calculated from the beginning of the period, for example a 1 day period, to the end, and that's the end of it. When the next daily period begins, the calculation resets, and has no memory of the preceding period. This limits the usefulness of the value area visual when viewed near the beginning of a new period before price and volume have been given ample time to define an area.
Hard to absorb all of that information: Value areas aren't generally meant to be a hardline representation of something extremely exact - they're based on a percentage of the area where traders appeared to find value over a certain time period. Most traders use them as a guide for support and resistance levels or finding an expected range. Traders typically overlay multiple VAs - sometimes requiring several instances of the same indicator to be applied - to represent the VA across multiple timeframes such as the 4H, 1D, or 1W. The chart quickly gets cluttered and it's not necessarily easy to understand the relationship between these multiple periods' VAs at a glance.
🧪 New concepts introduced in this indicator
With the evolving weighted composite value area we tried to address these limitations, and we think the result can be useful and intuitive for traders who want more dynamic and practical VAs for their everyday technical analysis.
⚖️ 1. A composite, weighted multi-timeframe VA
This indicator's value areas represent a combination or composite of the value areas calculated across multiple timeframes. The VAs calculated across each timeframe are then given a weighting percentage, which determines their contribution to the final 'weighted composite value area'.
Pictured below: a 4H/1D/1W MTF evolving weighted composite VA on the BTCUSDT Perpetual Futures (Binance) 5 minute chart:
Traditionally, when traders wanted to get a view of where the majority of trading activity occurred over the past four hours, day, and week, they would need to apply three value area indicators (or sometimes one if it allows multiple custom timeframes), each set to a different period (4H, 1D, 1W). The chart gets cluttered quickly and the information is hard to absorb in one shot. Addressing this problem was the main impetus for creating this weighted composite process.
〰️ 2. Rolling and smoothed evolving VAs
Because the composite VA is calculated based on multiple period VAs, there is no one single point where the area calculation resets (unless all 3 selected timeframes happen to rollover on the same bar). This creates a 'rolling' effect that gives a sense of the progression of the VA as price transitions through the different underlying time periods, without the traditional 'jump' in calculations between periods.
Pictured below: a 1D/1W/1M MTF evolving weighted composite VA on the NQ futures 1H chart:
To help give even more of a sense of perspective and 'progression' of the VA, there are also smoothing options to even out the 'jumps' at period-rollover points.
✔️ What's it good for?
Smoothed, rolling, and evolving multi-timeframe VAs that give you a better real-time perspective of where traders are finding value across multiple time periods at once.
📎 References
1. @sourcey's Value Area POC/VAH/VAL script by adapting its f_poc(tf) function.
💠 Features:
A MTF evolving weighted composite value area based on 3 underlying VAs calculated across customizable timeframes
Aesthetic and flexible coloring and color theme styling options
Period-roller labels and options for ease-of-use and legibility
⚙️ Settings:
Calculation Decimal Resolution: This setting essentially determines how 'granular' the value area calculating process is. This value should be set to some multiple of the tick size/smallest decimal of the symbol's price chart. Eg. On BTCUSDT, the tick size/decimal is usually 0.1. So, you might use 0.5. On TSLA, the tick size is 0.01. You might use 0.05 or 0.25. Beware: if the resolution is too small, calculation will take too long and the script may timeout.
Show Me Suggested Resolutions: If enabled, a label will display in the bottom right of the chart with some suggested resolutions for the current chart.
Area Percentage: Set the displayed percentage of the calculated composite value area. Igor method = 70%; Daniel method: 68%.
Use a Color Theme: When this setting is enabled, all manual 'Bullish and Bearish Colors' are overridden. All plots will use the colors from your selected Color Theme - excepting those plots set to use the 'Single Color' coloring method.
Color Theme: When 'Use a Color Theme' is enabled, this setting allows you to select the color theme you wish to use.
Resistance Color: When 'Use a Color Theme' is disabled, this will set the 'resistance color' for the composite VA.
Support Color: When 'Use a Color Theme' is disabled, this will set the 'support color' for the composite VA.
Show Period Rollover Labels: When enabled, a label will show above or below the composite VA marking any underlying period rollovers with the label 'New __' (eg. 'New 4H', 'New 1D', 'New 1W').
Size: Sets the font size of the period rollover labels.
Show Period Rollover Lines: When enabled, a translucent vertical dashed line will be drawn across the composite VA when one of the underlying periods rolls over.
Fill Composite Value Area: When enabled, the composite VA will be filled with a gradient coloring from the support line to the resistance line using their respective colors.
Smooth: When enabled, a smoothing moving average will be applied to the composite value area.
Smoothing Period: Set the lookback period for the smoothing average.
Smoothing Type: Set the calculation type for the smoothing average. Options include: Exponential, Simple, Weighted, Volume-Weighted, and Hull.
Enable: Include/exclude a timeframe's VA in the composite VA calculation.
Timeframe: Set the timeframe for this specific underlying VA.
Weighting %: Set the weighting percentage or 'importance' of this timeframe's value area in calculating the composite VA. Beware! The sum of the weighting percentages across all enabled timeframes must ALWAYS add up to 100 in order for this indicator to work as designed.

Dodge Trend [MyTradingCoder]Introducing the "Dodge Trend" indicator, an innovative variant of the Supertrend indicator designed to help traders better avoid fakeouts and maintain positions in established trends.
Like the Supertrend, the Dodge Trend uses Average True Range (ATR) but incorporates a unique adaptive adjustment feature that differentiates it from its counterparts. While the conventional Supertrend rises with the trend and only descends when the price crosses it, the Dodge Trend is designed to 'dodge' potential fakeouts.
This 'dodging' mechanism works by allowing the Dodge Trend to fall slightly during pullbacks, reducing the risk of a premature exit due to a temporary price drop. The recovery rate after the pullback is quicker but is slightly lower than the rate at which a new Dodge Trend high would be established in an uptrend. This unique adjustment feature allows the Dodge Trend to chase price action in an exponential fashion, potentially enabling a quicker exit when the trend shifts.
Key Settings:
Length: Adjust how much price action is taken into consideration for the ATR average. Lower values yield higher responsiveness to recent price action.
Size: Determines the initial deviation of the Dodge Trend when it resets after every flip/break.
Source: Specifies the data point (close, high, open, low, hl2, etc.) used for the Dodge Trend.
Dodge Intensity: Adjusts the intensity of the pullback effect. Higher values result in more intense pullbacks. Range is limited between 0 and 99, with 95 as the recommended default.
Bullish Color Setting: Sets the color for the uptrend Dodge Trend.
Bearish Color Setting: Sets the color for the downtrend Dodge Trend.
Dodge Trend is a powerful tool for traders looking to ride trends and avoid unnecessary exits due to short-term price fluctuations. While it offers a unique feature that may potentially improve trading outcomes, it should be used in conjunction with other indicators and analysis methods for a comprehensive trading strategy. As with all tools, it does not guarantee profitable trades but aims to give traders more actionable and precise information to base their decisions on.
Experience trend-following in a more adaptive and efficient manner with the Dodge Trend indicator, a tool designed to help you 'dodge' false exits and stay in line with the overall trend.

MTF Smoothable RSI Nexus [DarkWaveAlgo]🧾 Description:
A nexus is a connection, link, or neuronal junction where signals and information are transmitted between different elements.
The MTF Smoothable RSI Nexus indicator serves as a nexus between smoothable, MTF RSIs by facilitating the visualization and interaction of up to six multi-timeframe RSIs, each with its own customizable timeframe, period, coloring customization, and price source. By combining these various RSIs, it helps you create a comprehensive view of MTF momentum trends and dynamics.
It acts as a control center that brings together multiple MTF RSIs and allows you to visualize the interactions between them with exceptional ease-of-use and customizability, helping to provide you with valuable insights into potential trend reversals, momentum shifts, and trading opportunities.
💡 Originality and Usefulness:
While there are other multi-timeframe RSI indicators available, MTF Smoothable RSI Nexus' global smoothing settings offer a flexible take on the development of price momentum across various timeframes. Its semi-transparent overbought and oversold fill zones create a compounding opaqueness when RSIs from multiple timeframes coalesce - making visual assessment of momentum extremes incredibly easy. We also believe it stands above the rest with its sheer quantity and quality of settings, features, and usability.
✔️ Re-Published to Avoid Misleading Values
This script has been re-published to ensure that it does not use `request.security()` calls using lookahead_on to access future data when referencing RSIs from other timeframes. This decreases the likelihood that the indicator will provide deceiving values. This change has been made in accordance with the PineScript documentation: "Using barmerge.lookahead_on at timeframes higher than the chart's without offsetting the `expression` argument like in `close [ ]` will introduce future leak in scripts, as the function will then return the `close` price before it is actually known in the current context" and the Publishing Rule: "Do not use `request.security()` calls using lookahead to access future data". Historical and real-time values may differ when referencing timeframes other than the chart's.
💠 Features:
6 toggleable MTF Smoothable RSIs with customizable timeframes, periods, and price sources
Compounding overbought/oversold filled areas for easy MTF momentum analysis
Aesthetic and flexible coloring and color theme styling options
End-of chart labels and options for ease-of-use and legibility
⚙️ Settings:
Use a Color Theme: When this setting is enabled, all manual 'Bullish and Bearish Colors' are overridden. All plots will use the colors from your selected Color Theme - excepting those plots set to use the 'Single Color' coloring method.
Color Theme: When 'Use a Color Theme' is enabled, this setting allows you to select the color theme you wish to use.
Hide RSIs on Timeframes Lower Than the Chart: When this setting is enabled, any MTF RSI with a timeframe smaller than that of the chart the indicator is applied to will be hidden from view.
Overbought Level: Set the level value for the overbought line.
Oversold Level: Set the level value for the oversold line.
Overbought Color: When 'Use a Color Theme' is disabled, this will set the color for the Overbought Level line.
Oversold Color: When 'Use a Color Theme' is disabled, this will set the color for the Oversold Level line.
Fill Overbought/Oversold Areas: When enabled, the area between any MTF RSI and the Overbought/Oversold level will be filled with semi-transparent coloring if that RSI is above/below the respective level.
Smooth RSIs: When enabled, all MTF RSIs will be processed through an additional smoothing average calculation.
Smoothing Type: Set the calculation type for the smoothing process. Options include: Exponential, Simple, Weighted, Volume-Weighted, and Hull.
Enable: Show/hide a specific MTF RSI.
Timeframe: Set the timeframe for a specific MTF RSI.
Period: Set the lookback period for a specific MTF RSI.
Source Price: Set the source value used for a specific MTF RSI's calculation.
Coloring Method: Set the coloring method for this specific RSI. The coloring method defines how the RSI should be dynamically colored. Options include: 'Single Color' and 'Increasing/Decreasing'.
Bullish Color: When 'Use a Color Theme' is disabled, this will set the 'bullish color' for this specific MTF RSI.
Bearish Color: When 'Use a Color Theme' is disabled, this will set the 'bearish color' for this specific MTF RSI.
Single Color: When the 'Coloring Method' is set to Single Color for this specific RSI, this color option will set the RSI's color.
Enable Label: When enabled, a label will show at the end of the chart displaying the timeframe, period, smoothing type (if any), and current price value of this specific MTF RSI.
Size: Sets the font size of this specific MTF RSI's label.
Label Offset (in Bars): Sets the distance from the latest bar, in bars, at which this specific MTF RSI's label is displayed.
Show Label Line: When enabled, this specific MTF RSI's label will be accommodated by a dashed line connecting it to its plot.
📈 Chart:
The chart shown in this original publication displays the 15 minute chart on ETHUSDT. Displayed on the chart are 4 MTF RSIs: the 15m 14 WMA-Smoothed RSI, 1h 14 WMA-Smoothed RSI, 4h 14 WMA-Smoothed RSI, and the 1D 14 WMA-Smoothed RSI - offering an exemplary view of how you can easily use these MTF RSIs to your advantage in analyzing momentum relationship across multiple timeframes.

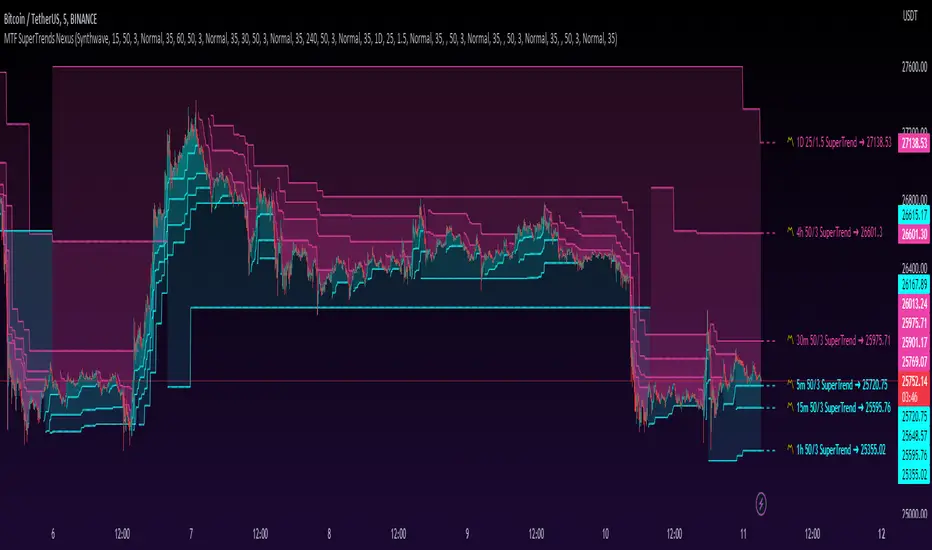
MTF SuperTrends Nexus [DarkWaveAlgo]🧾 Description:
A nexus is a connection, link, or neuronal junction where signals and information are transmitted between different elements.
The MTF SuperTrends Nexus indicator serves as a nexus between MTF SuperTrends by facilitating the visualization of up to eight multi-timeframe SuperTrends, each with its own customizable timeframe, period, factor, and coloring customization. By combining these various SuperTrends, it helps you create a comprehensive view of MTF trend dynamics and cross-timeframe confluence according to the SuperTrend indicator.
It acts as a utility/control center that brings together multiple MTF SuperTrends and allows you to visualize the interactions between them with exceptional ease-of-use and customizability, helping to provide you with valuable insights into potential trend reversals, momentum shifts, and trading opportunities.
💡 Originality and Usefulness:
While there are other multi-timeframe SuperTrend indicators available, MTF SuperTrends Nexus' semi-transparent fills create a compounding opaqueness when SuperTrends from multiple timeframes coalesce - making visual assessment of cross-timeframe confluence extremely easy. We also believe it stands above the rest with its sheer quantity and quality of settings, features, and usability.
✔️ Re-Published to Avoid Misleading Values
This script has been re-published to ensure that it does not use `request.security()` calls using lookahead_on to access future data when referencing SuperTrend calculations from other timeframes. This decreases the likelihood that the indicator will provide deceiving values. This change has been made in accordance with the PineScript documentation: "Using barmerge.lookahead_on at timeframes higher than the chart's without offsetting the `expression` argument like in `close [ ]` will introduce future leak in scripts, as the function will then return the `close` price before it is actually known in the current context" and the Publishing Rule: "Do not use `request.security()` calls using lookahead to access future data". Historical and real-time values may differ when referencing timeframes other than the chart's.
💠 Features:
8 toggleable MTF SuperTrends with customizable timeframes, periods, and factors
Compounding filled areas for easy MTF SuperTrend confluence analysis
Aesthetic and flexible coloring and color theme styling options
End-of chart labels and options for ease-of-use and legibility
⚙️ Settings:
Use a Color Theme: When this setting is enabled, all manual 'Bullish and Bearish Colors' are overridden. All plots will use the colors from your selected Color Theme - excepting those plots set to use the 'Single Color' coloring method.
Color Theme: When 'Use a Color Theme' is enabled, this setting allows you to select the color theme you wish to use.
Fill SuperTrend Areas: When enabled, the area between any MTF SuperTrend and the price bars will be filled with semi-transparent coloring.
Hide SuperTrends on Timeframes Lower Than the Chart: When this setting is enabled, any MTF SuperTrend with a timeframe smaller than that of the chart the indicator is applied to will be hidden from view.
Enable: Show/hide a specific MTF SuperTrend.
Timeframe: Set the timeframe for a specific MTF SuperTrend.
Period: Set the lookback period for a specific MTF SuperTrend.
Factor: Set the multiplier factor used for a specific MTF SuperTrend's calculation.
Bullish Color: When 'Use a Color Theme' is disabled, this will set the 'bullish color' for this specific MTF SuperTrend.
Bearish Color: When 'Use a Color Theme' is disabled, this will set the 'bearish color' for this specific MTF SuperTrend.
Enable Label: When enabled, a label will show at the end of the chart displaying the timeframe, period, factor, and current price value of this specific MTF SuperTrend.
Size: Sets the font size of this specific MTF SuperTrend's label.
Label Offset (in Bars): Sets the distance from the latest bar, in bars, at which this specific MTF SuperTrend's label is displayed.
Show Label Line: When enabled, this specific MTF SuperTrend's label will be accommodated by a dashed line connecting it to its plot.
📈 Chart:
The chart shown in this original publication displays the 5 minute chart on BTCUSDT. Displayed on the chart are 6 MTF SuperTrends: the 5m 50-period/3-factor SuperTrend, 15m 50-period/3-factor SuperTrend, 30m 50-period/3-factor SuperTrend, 1h 50-period/3-factor SuperTrend, 4h 50-period/3-factor SuperTrend, and the 1D 25-period/1.5-factor SuperTrend - offering an exemplary view of how you can easily use these MTF SuperTrends to your advantage in analyzing SuperTrend relationships across multiple timeframes.
MTF MAs and Crosses Nexus [DarkWaveAlgo]🧾 Description:
A nexus is a connection, link, or neuronal junction where signals and information are transmitted between different elements.
The MTF MAs and Crosses Nexus indicator serves as a nexus between MTF Moving Averages by facilitating the visualization and interaction of up to eight multi-timeframe moving averages, each with its own customizable timeframe, period, cross-over and cross-under alerts and plot markers, moving average calculation type, and price source.
It acts as a utility/control center that brings together multiple MTF moving averages (MTF MAs) and allows you to visualize the interactions between them with exceptional ease-of-use and customizability, helping to provide you with valuable insights into potential trend reversals, momentum shifts, and trading opportunities.
💡 Originality and Usefulness:
While there are other multi-timeframe moving average indicators available, MTF MAs and Crosses Nexus' customizable alert and signal settings offer intra-indicator MTF moving average cross markers and alerts not seen in other MTF MA indicators, allowing you to visualize the cross-over and cross-under relationships between the indicator's MAs with an 'all-in-one' experience. We also believe it stands above the rest with its sheer quantity and quality of settings, features, and usability.
✔️ Re-Published to Avoid Misleading Values
This script has been re-published to ensure that it does not use `request.security()` calls using lookahead_on to access future data when referencing moving averages from other timeframes. This decreases the likelihood that the indicator will provide deceiving values. This change has been made in accordance with the PineScript documentation: "Using barmerge.lookahead_on at timeframes higher than the chart's without offsetting the `expression` argument like in `close ` will introduce future leak in scripts, as the function will then return the `close` price before it is actually known in the current context" and the Publishing Rule: "Do not use `request.security()` calls using lookahead to access future data".
💠 Features:
8 toggleable MTF Moving Averages with customizable timeframes, periods, moving average calculation types, and price sources
Customizable cross-over and cross-under alert and chart signal options for each MTF MA (toggleable cross alerts and signals for crosses between intra-indicator MAs and bar price values)
Aesthetic and flexible coloring and color theme styling options
End-of chart labels and options for ease-of-use and legibility
⚙️ Settings:
Use a Color Theme: When this setting is enabled, all manual 'Bullish and Bearish Colors' are overridden. All plots will use the colors from your selected Color Theme - excepting those plots set to use the 'Single Color' coloring method.
Color Theme: When 'Use a Color Theme' is enabled, this setting allows you to select the color theme you wish to use.
Hide MAs on Timeframes Lower Than the Chart: When this setting is enabled, any MTF MA with a timeframe smaller than that of the chart the indicator is applied to will be hidden from view.
Enable: Show/hide a specific MTF MA.
Timeframe: Set the timeframe for a specific MTF MA.
Period: Set the lookback period for a specific MTF MA.
Type: Set the calculation type for a specific MTF MA. Options include: Exponential, Simple, Weighted, Volume-Weighted, and Hull.
Source Price: Set the source value used for a specific MTF MA's calculation.
Enable Cross Over Signals & Alerts: When enabled, cross-over chart signals (markers) and alerts are enabled for when this specific MTF MA crosses above its respective 'Cross Over Cross Source'.
Enable Cross Under Signals & Alerts: When enabled, cross-under chart signals (markers) and alerts are enabled for when this specific MTF MA crosses below its respective 'Cross Under Cross Source'.
Cross Source: Set the target plot which this specific MTF MA must cross (for either a cross-over or cross-under event) to trigger a chart signal and alert.
Marker Position: Set the position where this specific MTF MA's cross chart signal should appear. Options include: Above Bar, Below Bar, and On MA Line.
Coloring Method: Set the coloring method for this specific MA. The coloring method defines how the MA should be dynamically colored. Options include: Single Color, Increasing/Decreasing, and Over/Under Price.
Bullish Color: When 'Use a Color Theme' is disabled, this will set the 'bullish color' for this specific MTF MA.
Bearish Color: When 'Use a Color Theme' is disabled, this will set the 'bearish color' for this specific MTF MA.
Single Color: When the 'Coloring Method' is set to Single Color for this specific MA, this color option will set the MA's color.
Enable Label: When enabled, a label will show at the end of the chart displaying the timeframe, period, MA type, and current price value of this specific MTF MA.
Size: Sets the font size of this specific MTF MA's label.
Label Offset (in Bars): Sets the distance from the latest bar, in bars, at which this specific MTF MA's label is displayed.
Show Label Line: When enabled, this specific MTF MA's label will be accommodated by a dashed line connecting it to its plot.
📈 Chart:
The chart shown in this original publication displays the 15 minute chart on BTCUSDT. Displayed on the chart are 4 MTF MAs: the 15m 20 WMA, 30m 100 EMA, 1h 11 EMA, and 1D 7 VWMA - offering an exemplary view of how you can use these MTF MAs and crosses to your advantage in gauging trend relationships across multiple timeframes.

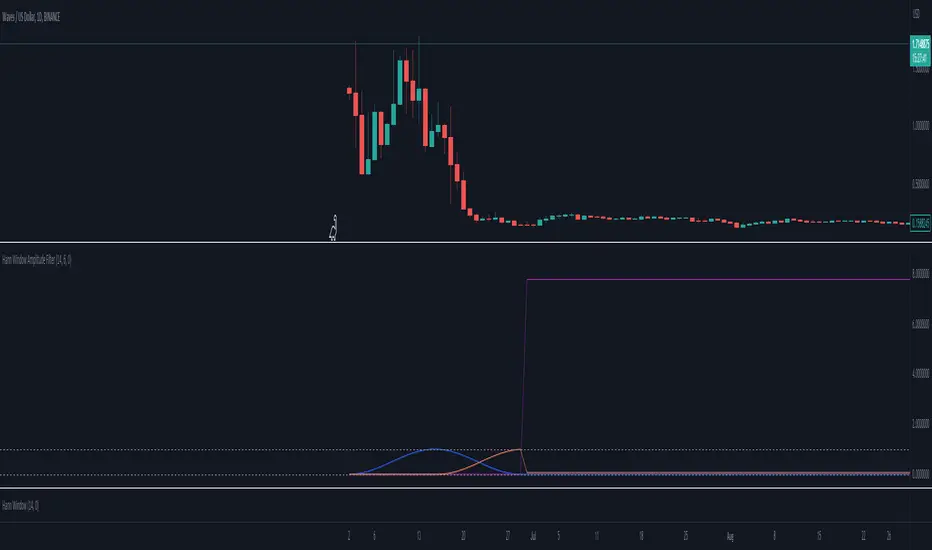
Hann Window Amplitude FilterThis script is designed to implement a multi-signal Hann filter, which is essentially a movable Hann window filter. The purpose of this filter is to allow users to select the periods or frequencies that best align with their trading strategy or market analysis.
The Hann window filter operates by enabling the selection of either lower or higher frequencies. The period of the window is twice the number of signals you wish to filter. As you shift the window by the number of your signals, the signal on one side will have an amplitude of 0, while the other side will have an amplitude of 1.
Continuing to shift the window will result in new values of 0. This feature is particularly useful for further filtering the frequencies or periods that you want to focus on for your trading decisions.
In summary, this script provides a flexible and customizable tool for filtering signals based on their frequency or period, which can be a valuable addition to any trader's technical analysis toolkit.
Price Action (ValueRay)With this indicator, you gain access to up to 5 moving averages from a selection of 15 different types. This flexibility allows you to customize your trading strategy based on your preferences and market conditions. Whether you're a fan of simple moving averages, exponential moving averages, or weighted moving averages, our indicator has got you covered! Additionally, all the MAs are Multi-Time-Frame!
The indicator also provides trading signals. By analyzing market trends and price movements, it generates accurate buy and sell signals, providing you with clear entry and exit points. You can choose between Fast, Mid, and Slow signal speeds.
Trendlines are another crucial aspect of effective trading, and our indicator seamlessly integrates them, helping you visualize the market's direction.
Furthermore, the indicator empowers you with recent highs and lows. By highlighting these key levels, it becomes easier than ever to spot support and resistance areas, aiding you in making well-informed trading choices.
Additionally, you can switch the ADR% (Average Daily Range as a Percentage) on and off. This number instantly provides you with information on how much the stock usually moves per day as a percentage.
Key Features:
Up to 5 Moving Averages, each with its own timeframe.
SMA, EMA, WMA, RMA, Triangular, Volume Weighted, Elastic Volume Weighted, Least Squares, ZLEMA, Hull, Double EMA, Triple EMA, T3, ALMA, KAMA (more to come in future versions).
Recent High and Low Pivot Points acting as support/resistance.
Trendline indicating the current trend.
Buy/Sell Signals (recommended for use as exit points, stop loss, or take profit levels).
Signals can have three different speeds: Fast, Mid, and Slow. You can switch them anytime depending on how quickly or slowly you want to exit a trade.
The predefined colors are best suited for a dark background, and the predefined settings provide a solid starting point that many traders use in their daily work.
Unlock the full potential of your trading strategy with our comprehensive indicator and start making informed trading decisions today!

Moving Averages + BB & R.VWAP StDev (multi-tf)█ Moving Averages + Bollinger Bands and Rolling Volume Weighted Average Price with Standard Deviation Bands (Multi Timeframe)
Multiple moving averages can be independently applied.
The length , type and timeframe of each moving average are configurable .
The lines and colors are customizable too.
This script can display:
Moving Averages
Bollinger Bands
Rolling VWAP and Standard Deviation Bands
Types of Moving Averages:
Simple Moving Average (SMA)
Exponential Moving Average (EMA)
Smoothed Moving Average (SMMA)
Weighted Moving Average (WMA)
Volume Weighted Moving Average (VWMA)
Least Squares Moving Average (LSMA)
Hull Moving Average (HMA)
Arnaud Legoux Moving Average (ALMA)
█ Moving Average
Moving Averages are price based, lagging (or reactive) indicators that display the average price of a security over a set period of time.
A Moving Average is a good way to gauge momentum as well as to confirm trends, and define areas of support and resistance.
█ Bollinger Bands
Bollinger Bands consist of a band of three lines which are plotted in relation to security prices.
The line in the middle is usually a Simple Moving Average (SMA) set to a period of 20 days (the type of trend line and period can be changed by the trader, a 20 day moving average is by far the most popular).
The SMA then serves as a base for the Upper and Lower Bands which are used as a way to measure volatility by observing the relationship between the Bands and price.
█ Rolling VWAP
The typical VWAP is designed to be used on intraday charts, as it resets at the beginning of the day.
Such VWAPs cannot be used on daily, weekly or monthly charts. Instead, this rolling VWAP uses a time period that automatically adjusts to the chart's timeframe.
You can thus use the rolling VWAP on any chart that includes volume information in its data feed.
Because the rolling VWAP uses a moving window, it does not exhibit the jumpiness of VWAP plots that reset.
Based on the previous script :

MTF Stationary Extreme IndicatorThe Multiple Timeframe Stationary Extreme Indicator is designed to help traders identify extreme price movements across different timeframes. By analyzing extremes in price action, this indicator aims to provide valuable insights into potential overbought and oversold conditions, offering opportunities for trading decisions.
The indicator operates by calculating the difference between the latest high/low and the high/low a specified number of periods back. This difference is expressed as a percentage, allowing for easy comparison and interpretation. Positive values indicate an increase in the extreme, while negative values suggest a decrease.
One of the unique features of this indicator is its ability to incorporate multiple timeframes. Traders can choose a higher timeframe to analyze alongside the current timeframe, providing a broader perspective on market dynamics. This feature enables a comprehensive assessment of extreme price movements, considering both short-term and longer-term trends.
By observing extreme movements on different timeframes, traders can gain deeper insights into market conditions. This can help in identifying potential areas of confluence or divergence, supporting more informed trading decisions. For example, when extreme movements align across multiple timeframes, it may indicate a higher probability of a significant price reversal or continuation.
To use the Multiple Timeframe Stationary Extreme Indicator effectively, traders should consider a few key points:
- Choose the Timeframes : Select the appropriate timeframes based on your trading strategy and objectives. The current timeframe represents the focus of your analysis, while the higher timeframe provides a broader context. Ensure the chosen timeframes align with your trading style and the asset you are trading.
- Interpret Extreme Movements : Pay attention to extreme movements that breach certain levels. Values above zero indicate a rise in the extreme, potentially signaling overbought conditions. Conversely, values below zero suggest a decrease, potentially indicating oversold conditions. Use these extreme movements as potential entry or exit signals, in conjunction with other indicators or confirmation signals.
- Validate with Price Action : Confirm the extreme movements observed on the indicator with price action. Look for confluence between the indicator's extreme levels and key support or resistance levels, trendlines, or chart patterns. This can provide added confirmation and increase the reliability of the signals generated by the indicator.
- Consider Volatility Filters : The indicator can be enhanced by incorporating volatility filters. By adjusting the sensitivity of the extreme differences calculation based on market volatility, traders can adapt the indicator to different market conditions. Higher volatility may require a longer lookback period, while lower volatility may call for a shorter one. Experiment with volatility filters to fine-tune the indicator's performance.
- Combine with Other Analysis Techniques : The Multiple Timeframe Stationary Extreme Indicator is most effective when used as part of a comprehensive trading strategy. Combine it with other technical analysis tools, such as trend indicators, oscillators, or chart patterns, to form a well-rounded approach. Consider risk management techniques and money management principles to optimize your trading strategy.
---------------------------------------------------------------------------------------------------------------------------------------------------------------
Remember that trading indicators, including the Multiple Timeframe Stationary Extreme Indicator, should not be used in isolation. They serve as tools to assist in decision-making, but they require proper context, analysis, and confirmation. Always conduct thorough analysis and consider market conditions, news events, and other relevant factors before making trading decisions.
It's recommended to backtest the indicator on historical data to assess its performance and effectiveness for your trading approach. This will help you understand its strengths and limitations, allowing you to refine and optimize your usage of the indicator.

RSI MTF DashboardThis is an RSI dashboard, which allows you to see the current RSI value for five timeframes across up to 8 tickers of your choice. This is a useful tool to gauge momentum across multiple timeframes, where you would look to enter a buy with high RSI values across the timeframes (and vice versa for sell positions).
Conversely, some traders use RSI to identify potential areas for reversals, so you would look to buy with low RSI values (and vice versa for sell positions).
In the settings, please select which 5 timeframes you require. Then select which tickers you wish to see, and you will find a dashboard on your chart to show the RSI values. The dashboard can be highlighted when the RSI value shows bearish momentum (a value under 50, of your choice) and bullish momentum (a value over 50, again of your choice). These colours and values are fully customisable.
In the settings you can also select the location of the dashboard, as well as some colour and transparency settings to enable the best possible view on screen.

Import Forex Volume from 5 biggest FX Brokers (single/combined) Some Brokers like Forex.com don't show Volume for FX. This indicator allows user to import Volume from a range of FX brokers that DO show volume
-Combine the reported volumes from all five brokers: FXCM, GLOBALPRIME, PEPPERSTONE, Currency.com, OANDA. Or pick a specific broker to import volume from.
-Image above shows combined Volume from the big 5 brokers, with added notes on the 2yr average of various broker's volumes; showing their size in descending order.
-Works across timeframes & FX pairs. Standard color formatting options Added.
//notes:
~default settings pull/combine volume from all 5 brokers. History goes back to Sept 2019 (due to GlobalPrime's later start date in publishing Volume data).
~~toggle ON 'only show FXCM, Pepperstone & Oanda' for a LONGER history, going back to June 2012.
~individual broker feeds: top checkbox toggled OFF, choose your preferred broker.
~~FXCM has both the longest history and the highest volume size of all the brokers.
~Table (toggle on/off) shows the broker feed (which broker(s) volume is on display) and the SMA 100 to give an idea of relative size.
//Cautionary note:
Volume is not as reliable in Forex as it is in Equities/commodities, due to unreported Inter-bank trades; the broker volumes do not give the full picture, but this is a best approximation of combined total volume based on brokers reported volume. The true volume will likely be much higher.
-Thank you @theEccentricTrader for the idea of pulling volume feed from other brokers.

support and resistance on multi timeframe [parsimaj] Description:
support and resistance and trendline on two timeframes by your choice
This indicator is capable of showing you the current and higher timeframe support and resistance by your strategy choice (two timeframes alongside each other). It also helps you to monitor the trend direction in short and long term by trend lines . You can change the depth of every levels and trend lines from the panel. Use this indicator in all markets because it follows the basic principles of levels but is unique in changing second timeframe by your choice.
_its smart , if the levels are too close together ,it will choose the deeper ones for you.
How it works:
By default, there is no higher timeframe and you can select your desire higher timeframe from the panel. Higher timelines will be displayed thicker and your current levels would be thin lines. (Levels that are higher than the current price will be red and those that are lower will be green). The number of levels to display is also by your choice, the default is 4 levels for each timeframe.
We have two types of trend lines , long terms as trend 1 (blue below and purple above trend line )- short term as trend 2(dashed ones).
Bouncing on levels and breaking trend line are the best triggers for entry and exit points.
Setting:
First, choose your higher timeframe then the depth of levels for each time (current and higher), The deeper it is, the more precise the lines. After that you can set the depth of trend lines by your choice. Trend 1 is the longer term So put it deeper and then set the short trend line (dashed ones) if you want to change it.
We have put the settings in the best mode, but you can also change it according to your strategy and inform us about the results.
This indicator has been obtained with hours of effort and codding , hope you enjoy