Bullish Structure (PAID) by @Crypto_alphabitTVC:GOLD
This script is for bullish structure........
___________________________________
to confirm the bullish structure , the price has to confirm the second higher low to confirm the uptrend ( ⬜️ The key level ) then the other levels will be automatic calculated with mathematic formula .
This indicator contains some important levels as below ....
__________________________________________________
🟥Stop Loss / lowest point
This level is the lowest point or 0 level & you can consider it as Stop Loss
🟫Strong support(0)
This level is very strong support and the price may not come back to that price after making the key level
⬜️The key Level
This level is the second higher low so the bullish structure confirmed for uptrend
🟪accumulation level(1) , 🟪accumulation level(2) , 🟪accumulation level(3)
The price is slowly moving between the 3 accumulation levels but if the price crossed the 3 levels with momentum , means we are in a very strong uptrend
🟫Strong Support(1) , 🟫Strong Support(2)
Those 2 levels are very strong support and strong resistance in the same time
⬜️Resistance
This level is very important as if the price closed above it so it is high probability that the price will go to the safe Exit
🟩Safe Exit
This is safest exit
🟨Golden Exit
This level is the golden exit if the price reached
🟦Extra Exit(1) , 🟦Extra Exit(2) , 🟦Extra Exit(3)
The price may or may not reach the 3 extra exit levels , it depends on the chart analysis, Gaps and momentum .
🟦Final Exit
This is the final target for that wave
In this indicator you can change some inputs to make it perfect as below ....
__________________________________________________
* Lookback Period for High/Low
* Line Width
* Show/ Hide Price Labels
* Label Size
* Extend Drawing for X Bars
* Swing Sensitivity ( Very important)
*** To confirm the bullish momentum you can add MACD indicator as a helper ***
*** To confirm the targets you can match the targets with Gaps ***
________________________________________________________________
This script is by @Crypto_alphabit
Chỉ báo và chiến lược

RMI Valid FVG & IFVGRMI • Valid FVG & iFVG (Smart Money Concept)
RMI • Valid FVG & iFVG is a precision-focused Fair Value Gap indicator designed for traders who follow Smart Money Concepts (SMC) / ICT logic and want to filter out low-quality, random gaps.
This indicator does not plot every FVG.
It highlights only structurally relevant FVGs that form in the direction of the trend and have a high probability of being filled.
Core Features
Bullish & Bearish Fair Value Gaps
Inverse Fair Value Gaps (iFVG)
Trend-aligned FVG filtering
Automatic invalidation after mitigation
Clean background zones for clear visibility
Optimized for intraday trading
Adjustable settings for scalping, intraday & swing trading
Smart Filtering Logic
FVGs are validated using market structure context
Only FVGs that form within the active trend are displayed
Weak or low-probability gaps are ignored
Inverse FVGs appear after strong displacement and rejection
Zones are visually faded once mitigated
This helps reduce chart noise and keeps the focus on high-probability reaction zones.
Best Use Cases
Entry refinement after BOS / CHoCH
Confluence with liquidity grabs
Premium / discount zone trading
Intraday & session-based trading
Works well with ICT, SMC, price action & structure-based strategies
Recommended Timeframes
Scalping: M1 – M5
Intraday (default): M5 – M15
Swing Trading: M15 – H1
(Default settings are optimized for intraday trading.)
Important Notes
This is not a signal indicator
No repainting
No buy/sell arrows
Designed as a decision-support tool, not an automated system
Always combine with proper risk management and confirmation.
RMI • Precision over noise.
Trade structure, not randomness.

VR Volume Ratio + Divergence (Pro)成交量比率 (Volume Ratio, VR) 是一項通過分析股價上漲與下跌日的成交量,來研判市場資金氣氛的技術指標。本腳本基於傳統 VR 公式進行了優化,增加了**「趨勢變色」與「自動背離偵測」**功能,幫助交易者更精準地捕捉量價轉折點。
Introduction
Volume Ratio (VR) is a technical indicator that measures the strength of a trend by comparing the volume on up-days versus down-days. This script enhances the classic VR formula with "Trend Color Coding" and "Auto-Divergence Detection", helping traders identify volume-price reversals more accurately.
核心功能與參數
公式原理: VR = (Qu + Qf/2) / (Qd + Qf/2) * 100
Qu: 上漲日成交量 (Up volume)
Qd: 下跌日成交量 (Down volume)
Qf: 平盤日成交量 (Flat volume)
參數 (Length):預設為 26 日,這是市場公認最有效的短中線參數。
關鍵水位線 (Key Levels):
< 40% (底部區):量縮極致,市場情緒冰點,常對應股價底部,適合尋找買點。
100% (中軸):多空分界線。
> 260% (多頭警戒):進入強勢多頭行情,但需注意過熱。
> 450% (頭部區):成交量過大,市場情緒亢奮,通常為頭部訊號。
視覺優化 (Visuals):
紅漲綠跌:當 VR 數值大於前一日顯示為紅色(動能增強);小於前一日顯示為綠色(動能退潮)。
背離訊號 (Divergence):自動標記量價背離。
▲ 底背離 (Bullish):股價創新低,但 VR 指標墊高(主力吸籌)。
▼ 頂背離 (Bearish):股價創新高,但 VR 指標走弱(買氣衰竭)。
Features & Settings
Formula Logic: Calculated as VR = (Qu + Qf/2) / (Qd + Qf/2) * 100.
Default Length: 26, widely regarded as the optimal setting for short-to-medium term analysis.
Key Zones:
< 40% (Oversold/Bottom): Extreme low volume, often indicating a market bottom and potential buying opportunity.
100% (Neutral): The balance point between bulls and bears.
> 260% (Bullish Zone): Strong uptrend, volume is expanding.
> 450% (Overbought/Top): Extreme high volume, often indicating a market top and potential reversal.
Visual Enhancements:
Color Coding: Line turns Red when VR rises (Momentum Up) and Green when VR falls (Momentum Down).
Divergence Signals: Automatically marks divergence points on the chart.
▲ Bullish Divergence: Price makes a lower low, but VR makes a higher low (Accumulation).
▼ Bearish Divergence: Price makes a higher high, but VR makes a lower high (Distribution).
應用策略建議
抄底策略:當 VR 跌破 40% 後,指標線由綠翻紅,或出現「▲底背離」訊號時,為極佳的波段進場點。
逃頂策略:當 VR 衝過 450% 進入高檔區,一旦指標線由紅翻綠,或出現「▼頂背離」訊號時,建議分批獲利了結。
Strategy Guide
Bottom Fishing: Look for entries when VR drops below 40% and turns red, or when a "▲ Bullish Divergence" label appears.
Taking Profit: Consider selling when VR exceeds 450% and turns green, or when a "▼ Bearish Divergence" label appears.
Disclaimer: This tool is for informational purposes only and does not constitute financial advice. / 本腳本僅供參考,不構成投資建議。

[Backtest Crypto] Cross MAThis script is designed for testing the moving average crossover strategy.
Script settings:
Select testing range
Indicator settings: Select moving average type (EMA, SMA, WMA, SMMA, HMA) and period
Trade management: Select risk-to-reward ratio, stop-loss defined as min/max for a certain number of candles (you can set a desired number), option to partially lock in a position by moving the stop-loss to breakeven, trailing stop, or close a position on an opposite signal.
Option to limit the stop-loss by ATR to prevent it from becoming too large during volatile movements.
===============================================================
Скрипт предназначен для тестирования стратегии пересечение скользящих средних.
Настройки скрипта:
Выбор диапазона тестирования
Настройки индикатора: выбор типа скользящей (EMA, SMA, WMA, SMMA, HMA) и периода
Сопровождение сделки: выбор соотношения риска к прибыли, стоп-лосс определяется как мин/мах за определенное количество свечей (можно устанавливать желаемое количество), возможность частичной фиксации позиции с переносом стоп-лосса в безубыток, трейлинг-стоп, или закрытие позиции по противоположному сигналу.
Возможность ограничения стоп-лосса по ATR, чтобы при волатильных движениях он не был слишком большим.


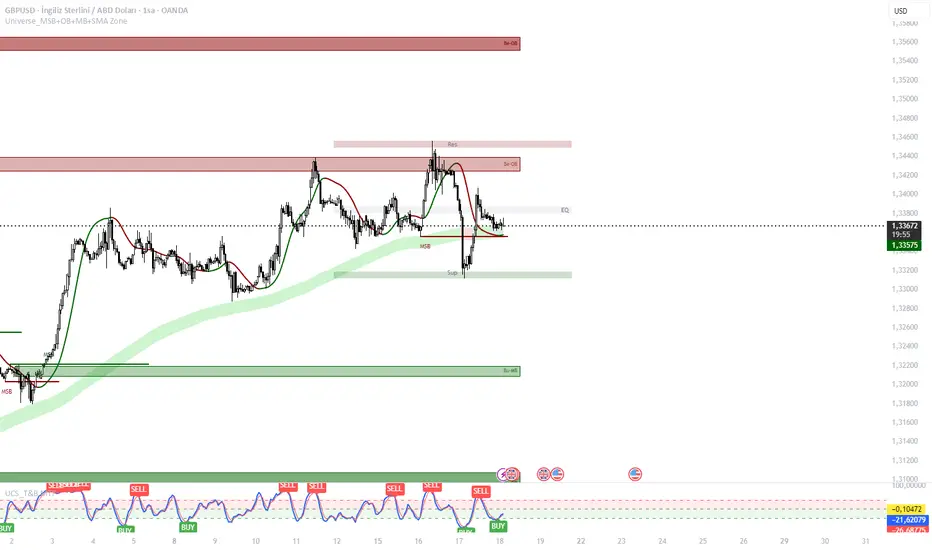
Universe Structure & Trend Zone [All-in-One]**Overview**
The "Universe Structure & Trend Zone" is a comprehensive all-in-one trading toolkit designed to combine Institutional Trend Following with Smart Money Concepts (SMC/ICT). It helps traders identify the dominant trend direction while providing precise entry points based on Market Structure Breaks (MSB) and Order Blocks.
This script aims to filter out market noise by allowing trades only when Price Action aligns with the long-term trend (SMA Zone).
**Key Features**
1. **Market Structure Breaks (MSB) & ZigZag:**
- Detects structural shifts in price (Bullish/Bearish MSB).
- Uses a default Signal Length of 10 to filter out minor swings and focus on significant structural changes.
- Visualizes high and low pivot points.
2. **Smart Trend Zone (SMA 200 Filter):**
- Incorporates a 200-period SMA Zone (Institutional Level) to determine the macro trend.
- **Trend Filter Logic:** The indicator intelligently filters signals. It displays Bullish Order Blocks only when the price is trending *above* the SMA Zone, and Bearish Order Blocks only *below* it. This drastically reduces false signals in choppy markets.
3. **Order Blocks (OB) & Breaker Blocks (BB):**
- Automatically identifies high-probability Order Blocks and Breaker Blocks.
- Includes optional filters for Volume and Premium/Discount zones to validate the blocks.
- Features an auto-cleanup mechanism to remove invalid or broken boxes, keeping the chart clean.
4. **Hull Moving Average (HMA):**
- A fast-reacting 55-period HMA is included to visualize short-term momentum shifts (Green for Bullish, Red for Bearish).
5. **Smart Range (Support/Resistance):**
- Plots the dynamic Highest High and Lowest Low of the selected timeframe (default 4H) to show the current trading range and Equilibrium (EQ) level.
**How to Use**
* **Step 1:** Check the **SMA Zone** (Gray/Green/Red Band). If Price > Zone, look for Longs. If Price < Zone, look for Shorts.
* **Step 2:** Wait for a **Market Structure Break (MSB)** label in the direction of the trend.
* **Step 3:** Look for an entry at the retest of an **Order Block (OB)** or **Breaker Block (BB)**.
* **Step 4:** Use the HMA color change as a confirmation trigger or trailing stop guide.
**Settings**
* **Signal Length:** Default is 10 (Optimized for standard swings).
* **Trend Filter:** Enabled by default (Recommended to stay with the trend).
* **Display:** You can toggle MSB lines, Boxes, and Labels on/off to suit your visual preference.
**Disclaimer**
This indicator is for educational purposes only and does not constitute financial advice. Always use proper risk management.
RSI Divergence LiquidityRSI Divergence Liquidity is an indicator designed to help you catch high-probability BUY reversals by combining two powerful concepts:
OANDA:XAUUSD
Liquidity Sweep / Swing Low: automatically marks swing-low levels and tracks when price sweeps below them and reacts back.
Bullish RSI Divergence: filters noise by comparing RSI at the swing area versus RSI at the retest, favoring reversals with stronger momentum confirmation.
How it works
The script draws Swing Low lines using Pivot Lows. When a new Swing Low forms, the previous one is cut/frozen .
When price retests a Swing Low and the candle conditions are met (bar n bullish, bar n-1 bearish), the script checks:
Whether RSI at n/n-1 is higher than the RSI at the swing (bullish divergence logic)
Whether min RSI at the swing is below a threshold (default < 36) to focus on oversold swing areas
If all conditions pass, the indicator prints an upward triangle right when bar n closes → a potential BUY signal.
How to use
Enter BUY when an up triangle appears at/near the Swing Low (liquidity sweep zone).
Stop Loss idea: below the most recent swing low / below the sweep wick.
Take Profit idea: nearest supply zone, prior high, or fixed RR such as 1:2 / 1:3 depending on your system.
Recommended settings
Best on: M5–H1 (depending on your style), especially effective when price is trending down and performs a clear sweep.
For stricter filtering: lower Max minRSI at Swing (x) to only take signals from deeper RSI lows.
Smaller Pivot Lookback → more swings/signals; larger values → fewer but cleaner swings.
Note: This tool improves probability, not certainty. Combine it with market structure / key levels and proper risk management for best results.

MA20 ATR Trend Failure FilterA volatility-adaptive filter designed to identify early trend invalidation.
This indicator combines a 20-period Moving Average (MA20) with Average True Range (ATR) to dynamically define a lower volatility boundary.
When price closes below this boundary, it signals that the current trend is no longer valid and risk is increasing.
Core Concept(核心思想)
MA defines the trend baseline
ATR measures current market volatility
MA − k × ATR forms a dynamic risk threshold
A close below this threshold = trend failure
👉 中文补充:
这不是反转指标,而是趋势失效过滤器,用于避免在趋势已经被破坏后继续持仓或加仓。
How It Works
Calculate MA20 as the trend reference
Calculate ATR(14) as volatility proxy
Build adaptive bands:
Upper Band = MA20 + k × ATR
Lower Band = MA20 − k × ATR
If close < Lower Band, trend is considered failed
The ATR multiplier k automatically adjusts the tolerance based on volatility, avoiding rigid fixed-percentage rules.
Visual Elements
Yellow line: MA20
Green band: MA20 + k × ATR
Red band: MA20 − k × ATR (key risk boundary)
Red triangle + “FAIL” label: Trend failure signal
Optional background shading to highlight risk zones
Typical Use Cases
Trend-following strategies (exit / reduce exposure)
Breakout strategies (filter false continuation)
Risk management overlay (non-intrusive, no repaint)
Combine with HMA, SuperTrend, structure-based entries
👉 中文补充:
非常适合作为**“不该再拿”的客观判断条件**,而不是频繁交易信号。
Why This Indicator
Volatility-adaptive (ATR-based)
No future data, no repaint
Simple logic, strong risk control
Works across stocks, crypto, futures, indices
This tool is designed to answer one question only:
Is the current trend still valid?
Parameters
MA Length (default: 20)
ATR Length (default: 14)
ATR Multiplier k (default: 0.8)
Lower k → stricter risk control
Higher k → more tolerance, fewer false signals SSE:600595

1 CMO200 Signals.Multiple Instrument ScreenerDescription
CMO200 Signals is an overlay indicator that combines a volume-based breakout signal system with multi-timeframe Support/Resistance levels and a 30-symbol screener table.
What it does:
Plots volume-driven BUY/SELL labels on the chart using three lookback presets: 200 / 388 / 500.
Builds higher-timeframe Support & Resistance lines using RSI + CMO conditions and pivot logic (configurable S/R timeframe).
Shows a multi-instrument screener table (up to 30 symbols) with each symbol’s RSI, current BUY/SELL status, last signal price, and trend bias vs MA 200 / MA 111 / MA 89.
Includes alerts for: BUY/SELL (200 lookback) and price crossing above/below MA200.
Inputs: RSI length, lookback settings, Less Ratio filter, S/R timeframe, and symbol enable toggles.
Disclaimer: This script is for educational/informational purposes only and is not financial advice. Always use proper risk management and confirm signals with additional analysis.

Daily Open Shift The "Daily Open Shift" System (V2.0)
1. The Setup (Indicators & Timeframe)
• Timeframe: 15-Minute Chart (Execution).
• Key Levels: Daily Open (DO) or New York Open (NYO).
• Trend Indicators:
o 24 & 42 EMA Ribbon (Exponential Moving Averages).
o 30-Minute Supertrend.
________________________________________
2. Phase 1: Establish The Bias (The Filter)
This is the V2 upgrade. We do not trade against the day's opening momentum.
1. Mark the Open: Draw a horizontal line at the Daily Open (00:00) or Session Open.
2. The "First 2H" Rule: Observe the price action for the first 2 hours after the open.
o First 2H are Green/Bullish? → You are LONG BIAS only for the rest of the session. (Ignore all sell signals).
o First 2H are Red/Bearish? → You are SHORT BIAS only for the rest of the session. (Ignore all buy signals).
________________________________________
3. Phase 2: The Signal (The Switch)
Wait for the chart to confirm your bias technically.
1. The Switch: Price must cross and close a 15M candle on the correct side of the Daily Open.
o Longs: Price switches from below to above DO.
o Shorts: Price switches from above to below DO.
2. Indicator Confluence:
o EMAs: Must be crossed in your direction (Green for Long, Red for Short).
o 30M Supertrend: Must match your direction.
________________________________________
4. Phase 3: The Entry (The Trigger)
We never chase the breakdown. We wait for the price to come to us.
1. The Pullback: Wait for the price to retrace and touch/wick into the 24/42 EMA Ribbon.
2. The Confirmation: Watch the candle that touches the EMA.
o It must reject the EMA (wick off it) and close respecting the trend.
o Do not enter if the candle closes forcefully through the EMA, breaking structure.
3. Execution: Enter Market Order immediately on that candle close.
________________________________________
5. Phase 4: Risk Management (The Math)
This is the V2 upgrade. We aim for higher profitability.
1. Stop Loss (SL):
o Longs: Placed strictly below the lowest EMA band.
o Shorts: Placed strictly above the highest EMA band.
o Logic: If price crosses the EMA band completely, the trend is dead. Get out.
2. Take Profit (TP):
o FIXED 3R (Reward = 3x Risk).
o Example: If Risk is $100, TP is set to make $300.
o Rule: Do not move the TP. Do not close early. Let the math play out.
________________________________________
Summary Checklist (Print This)
Time: Is the First 2H bias clear? (Green=Buy / Red=Sell)
Switch: Did price close above/below the Daily Open?
Trend: Are EMAs crossed and Supertrend agreeing?
Patience: Did I wait for the price to pull back to the EMA band?
Trigger: Did the candle close respecting the EMA?
Execution: Market Entry + Stop Loss behind EMA + Fixed 3R Target.
Mindset: Am I at "2/10" emotion? Set the trade and walk away.

Session Volume Profile Sniffer: HVN & Rejection ZonesA simple tool built for traders who rely on intraday volume structure.
What this script does
This script tracks volume distribution inside a selected session and highlights two key price levels:
High Volume Nodes (HVNs) — areas where price spent time building heavy participation.
Low Volume Nodes (LVNs) — thin zones where price moved quickly with very little interest.
Instead of plotting a full profile, this tool gives you the exact rejection-level lines you usually hunt manually.
Why these levels matter
HVN → price tends to react, stall, or flip direction
LVN → price often rejects strongly since liquidity is thin
Rejection patterns around these areas give clean entry signals
Positioning trades around HVN/LVN helps filter noise in choppy sessions
This script removes the trouble of drawing profiles, counting bins, or guessing node levels. Everything is calculated inside the session you choose.
How the detection works
Inside your session window, the script:
1. Tracks each tick-based price bucket
2. Accumulates raw volume for every bucket
Identifies:
HVNs = buckets with volume above a tier
LVNs = buckets with volume below a tier
3. Prints each level as a single clean line
4. Generates:
Long signal → bounce from LVN
Short signal → rejection from HVN
Built-in exits use ATR-based conditions for quick testing.
Features
Session-based volume mapping
HVN + LVN levels drawn automatically
Entry triggers based on rejection
ATR exits for experimental backtests
Clean, minimal visual output
Best use cases
Intraday futures
Index scalping
FX sessions (London / NY)
Crypto sessions (user-timed)
Anyone who trades around volume structure
Adjustable settings
Session window
Volume bin size
HVN multiplier
LVN multiplier
Enable/disable zone lines
This keeps it flexible enough for both scalpers and slow-paced intraday setups.
Important note
This script is built for study + idea testing.
It is not intended as a final system.
Once you identify how price behaves around these nodes, you can blend this tool into your own setup.

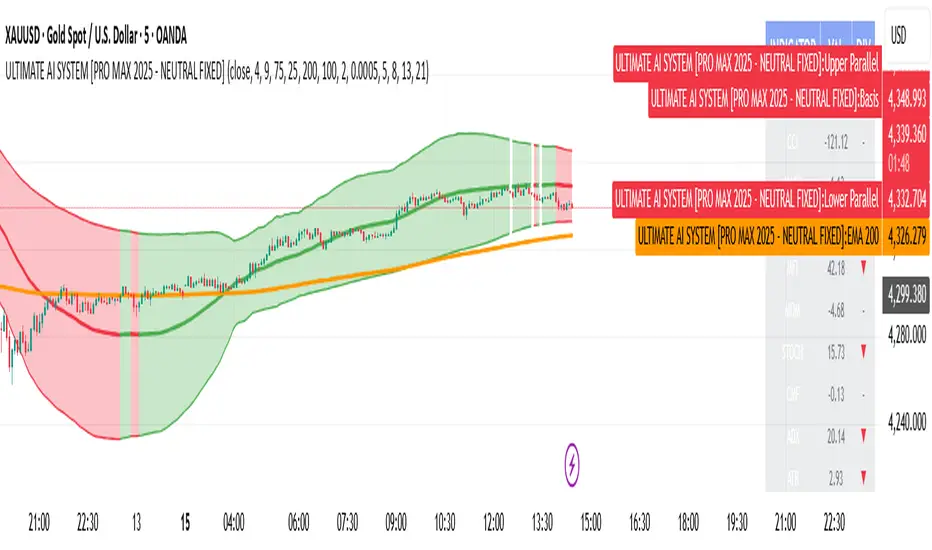
ULTIMATE AI SYSTEM [PRO MAX 2025 - NEUTRAL FIXED]🚀 Overview
The ULTIMATE AI SYSTEM is a next-generation trading toolkit designed to identify high-probability reversal setups within established trends. This Parallel Edition introduces a dynamic Linear Regression Channel combined with a powerful Multi-Divergence Engine capable of scanning 14 different oscillators simultaneously.
🔥 Key Features
1. Parallel Linear Regression Channel
This is the core of the trend filtering system. Unlike standard regression channels:
• Parallel Bands: The upper and lower bands are perfectly parallel to the baseline, calculated using Standard Deviation (Deviation 2.0 default).
• Dynamic Trend Coloring: The channel automatically changes color based on the slope:
• 🟢 Green: Uptrend (Bullish Bias)
• 🔴 Red: Downtrend (Bearish Bias)
• Mean Reversion Logic: It helps filter out trades that are over-extended (e.g., buying at the top of the channel).
2. AI Multi-Divergence Engine
The script scans 14 Indicators simultaneously across Fibonacci Lookback Periods (5, 8, 13, 21 candles) to find hidden momentum shifts.
• Indicators Scanned: RSI, CCI, MACD, OBV, MFI, MOM, STOCH, CMF, ADX, ATR, WPR, ROC, TSI.
• Algorithm: A signal is only triggered if a user-defined minimum number of indicators (default: 4) show divergence at the same time.
3. Smart Filtering Layer
To reduce false signals, every trade must pass 5 layers of confirmation:
1. Trend Filter: Price must be above/below the EMA 200 (optional).
2. Regression Filter: Buy signals are validated only if price is within the safe zone of the Linear Regression Channel.
3. RSI Guard: Prevents buying in Overbought or selling in Oversold conditions (optimized 75/25 levels).
4. Candle Validation: Buys require a Green candle; Sells require a Red candle.
5. Lookback Confirmation: Uses Fibonacci sequences to validate divergence strength.
4. Pro Dashboard
A real-time table on the chart displays:
• Current value of all oscillators.
• Live Divergence status (▲ for Bullish, ▼ for Bearish).
• Overall Market Sentiment score.
🛠 How It Works
• LONG (BUY) Signal:
1. Market Sentiment is Bullish (Minimum 4 indicators showing bullish divergence).
2. Price is above EMA 200 (Trend Confirmation).
3. Linear Regression Slope is Positive (or price is at the channel bottom).
4. RSI is below 75 (Not Overbought).
5. Candle closes Green.
• SHORT (SELL) Signal:
1. Market Sentiment is Bearish (Minimum 4 indicators showing bearish divergence).
2. Price is below EMA 200 (Trend Confirmation).
3. Linear Regression Slope is Negative (or price is at the channel top).
4. RSI is above 25 (Not Oversold).
5. Candle closes Red.
⚙️ Settings
• Min Confirmations: Number of indicators required to trigger a signal (Default: 4).
• Regression Length: Length for the Linear Regression Channel (Default: 100).
• Channel Deviation: Width of the parallel channel (Default: 2.0).
• EMA Filter: Toggle EMA 200 filtering On/Off.
• Lookback Periods: Customizable Fibonacci sequence for divergence detection.
⚠️ Disclaimer
This script is for educational and analytical purposes only. No indicator guarantees 100% accuracy. Always use proper risk management and combine signals with your own price action analysis.
Code Author:
Version: PRO MAX 2025 - PARALLEL EDITION
Unmitigated Liquidity ZonesUnmitigated Liquidity Zones
Description:
Unmitigated Liquidity Zones is a professional-grade Smart Money Concepts (SMC) tool designed to visualize potential "draws on liquidity" automatically.
Unlike standard Support & Resistance indicators, this script focuses exclusively on unmitigated price levels — Swing Highs and Swing Lows that price has not yet revisited. These levels often harbor resting liquidity (Stop Losses, Buy/Sell Stops) and act as magnets for market makers.
How it works:
Detection: The script identifies significant Pivot Points based on your customizable length settings.
Visualization: It draws a line extending forward from the pivot, labeled with the exact Price and the Volume generated at that specific swing.
Mitigation Logic: The moment price "sweeps" or touches a level, the script treats the liquidity as "collected" and automatically removes the line and label from the chart. This keeps your workspace clean and focused only on active targets.
Key Features:
Dynamic Cleanup: Old levels are removed instantly upon testing. No chart clutter.
Volume Context: Displays the volume (formatted as K/M/B) of the pivot candle. This helps you distinguish between weak structure and strong institutional levels.
High Visibility: customizable bold lines and clear labels with backgrounds, designed to be visible on any chart theme.
Performance: Optimized using Pine Script v6 arrays to handle hundreds of levels without lag.
How to trade with this:
Targets: Use the opposing liquidity pools (Green lines for shorts, Red lines for longs) as high-probability Take Profit levels.
Reversals (Turtle Soup): Wait for price to sweep a bold liquidity line. If price aggressively reverses after taking the line, it indicates a "Liquidity Grab" setup.
Magnets: Price tends to gravitate toward "old" unmitigated levels.
Settings:
Pivot Length: Sensitivity of the swing detection (default: 20). Higher values find more significant/long-term levels.
Limit: Maximum number of active lines to prevent memory overload.
Visuals: Toggle Price/Volume labels, adjust line thickness and text size.

BTC - ALSI: Altcoin Season Index (Dynamic Eras)Title: BTC - ALSI: Altcoin Season Index (Dynamic Eras)
Overview & Philosophy
The Altcoin Season Index (ALSI) is a quantitative tool designed to answer the most critical question in crypto capital rotation: "Is it time to hold Bitcoin, or is it time to take risks on Altcoins?"
Most "Altseason" indicators suffer from Survivor Bias or Obsolescence. They either track a static list of coins that includes "dead" assets from previous cycles (ghosts of 2017), or they break completely when major tokens collapse (like LUNA or FTT).
This indicator solves this by using a Time-Varying Basket. The indicator automatically adjusts its reference list of Top 20 coins based on historical eras. This ensures the index tracks the winners of the moment—capturing the DeFi summer of 2020, the NFT craze of 2021, and the AI/Meme narratives of 2024/2025.
Methodology
The indicator calculates the percentage of the Top 20 Altcoins that are outperforming Bitcoin over a rolling window (Default: 90 Days).
The "Win" Count: For every major Altcoin performing better than BTC, the index adds a point.
Dynamic Eras: The basket of coins changes depending on the date:
2020 Era (DeFi Summer): Tracks the "Blue Chips" of the DeFi revolution like UNI, LINK, DOT, and early movers like VET and FIL.
2021 Era (Layer 1 Wars): Tracks the explosion of alternative smart contract platforms, adding winners like SOL, AVAX, MATIC, and ALGO.
2022 Era (The Survivors): Filters for resilience during the Bear Market, solidifying the status of established assets like SHIB and ATOM.
2023 Era (Infrastructure & Scale): Captures the rise of "Next-Gen" tech leading into the pre-halving year, introducing TON, APT (Aptos), and ARB (Arbitrum).
2024/25 Era (AI & Speed): Tracks the current Super-Cycle leaders, focusing on the AI narrative (TAO, RNDR), High-Performance L1s (SUI), and modern Memes (PEPE).
Chart Analysis & Strategy ( The "Alpha" )
As seen in the chart above, there is a strong correlation between ALSI Peaks and local tops in TOTAL3 (The Crypto Market Cap excluding BTC & ETH).
The Entry (Rotation): When the indicator rises above the neutral 50 line, it signals that capital is beginning to rotate out of Bitcoin and into Altcoins. This has historically been a strong confirmation signal to increase exposure to high-beta assets.
The Exit (Saturation): When the indicator hits 100 (or sustains in the Red Zone > 75), it means every single Altcoin is beating Bitcoin. Historically, this extreme exuberance often marks a local top in the TOTAL3 chart. This is the zone where smart money typically sells into strength, rather than opening new positions.
How to Read the Visuals
🚀 Altcoin Season (Red Zone > 75): Strong Altcoin dominance. The market is "Risk On."
🛡️ Bitcoin Season (Blue Zone < 25): Bitcoin dominance. Alts are bleeding against BTC. Historically, this is a defensive zone to hold BTC or Stablecoins.
Data Dashboard: A status table in the bottom-right corner displays the live Index Value, current Regime, and a System Check to ensure all 20 data feeds are active.
Settings
Lookback Period: Default 90 Days. Lowering this (e.g., to 30) makes the index faster but noisier.
Thresholds: Adjustable zones for Altcoin Season (Default: 75) and Bitcoin Season (Default: 25).
Credits & Attribution
This open-source indicator is built on the shoulders of giants. I acknowledge the original creators of the concept and the pioneers of its implementation on TradingView:
Original Concept: BlockchainCenter.net. - They established the industry standard definition: 75% of the Top 50 coins outperforming Bitcoin over 90 days = Altseason..
TradingView Implementation: Adam_Nguyen - He implemented the "Dynamic Era" logic (updating the coin list annually) on TradingView. Our code structure for the time-based switching is inspired by his methodology. See also his implementation in the chart. ( Altcoin Season Index - Adam) .
Comparison: Why use ALSI | RM?
While inspired by the above, ALSI introduces three key improvements:
Open Source: Unlike other popular TradingView versions (which are closed-source), this script is fully transparent. You can see exactly which coins are triggering the signal.
Sanitized History (Anti-Fragile): Historical Top 20 snapshots are not blindly used. "Dead" coins (like LUNA and FTT) from previous eras are manually filtered out. A raw index would crash during the Terra/FTX collapses, giving a false "Bitcoin Season" signal purely due to bad actors. The curated list preserves the integrity of the market structure signal.
Narrative Relevance: The 2024/25 basket was updated to include TAO (Bittensor) and RNDR, ensuring the index captures the dominant AI narrative, rather than tracking fading assets from the previous cycle.
You can compare the ALSI indicator with other available tradingview indicators in the chart: Different indicators for the same idea are shown in the 3 Pane window below the BTC and Total3 chart, whereas ALSI is the top pane indicator.
Important Note on Coin Selection Baskets are highly curated: Dead/irrelevant coins (FTT, LUNA, BSV) are excluded for clean signals. This prevents historical breaks and ensures Era T5 captures current narratives (AI, Memes) via TAO/RNDR. See above. Users are free to adjust the source code to test their own baskets.
Disclaimer
This script is for research and educational purposes only. Past correlations between ALSI and TOTAL3 do not guarantee future results. Market regimes can change, and "Altseasons" can be cut short by macro events.
Tags
bitcoin, btc, altseason, dominance, total3, rotation, cycle, index, alsi, Rob Maths

Quarter Levels Auto recentering - With Advance mode📌 Indicator Description
Quarter Levels — Auto Recentering (Advanced Mode) plots a structured set of quarter-price levels around the current market price and keeps them auto-centered as price moves.
These levels represent natural price decision zones where markets frequently pause, react, reject, break, or retest.
The indicator is designed to support price-action trading across futures, stocks, crypto, and forex.
This is a decision-support tool, not a buy/sell signal system.
🔢 Understanding The Quarter Levels
The indicator plots multiple types of quarter levels, each serving a different purpose.
Think of them as a price map, not targets or predictions.
🟦 00 / 25 / 50 / 75 — Core Structure Levels
These are the primary quarter levels and form the backbone of the system.
00 → Whole number / major psychological level
25 & 75 → Mid-range reaction levels inside the block
50 → Equilibrium / balance point of the range
How price behaves here:
Strong reactions and pauses
Common areas for consolidation
Frequent support or resistance flips
These levels are ideal for:
Structure analysis
Scaling in or out
Identifying balance vs. imbalance
🟪 10 / 80 — Rejection & Extension Zones
These levels sit just inside the edge of the quarter block.
10 → Shallow rejection / early defense zone
80 → Late extension / exhaustion zone
How price behaves here:
Fast reactions
Sharp rejections or continuations
Momentum decision points
These levels often act as:
Early warning zones
“Last defense” areas before a break
Extension points during strong moves
🟥 35 / 65 / 90 — Momentum & Continuation Levels
These levels represent momentum checkpoints inside and beyond the quarter structure.
35 & 65 → Internal momentum acceptance zones
90 → High-pressure continuation or failure point
How price behaves here:
Acceptance above/below suggests continuation
Failure often leads to rotation back toward balance
Useful for trend confirmation or invalidation
These levels help answer:
“Is price accepting higher or lower?”
“Is this move real, or failing?”
🔍 Advanced Glow (Optional)
When Advanced Mode is enabled, the indicator automatically highlights:
The strongest confirmed support below price
The strongest confirmed resistance above price
These highlights:
Are based on recent touches and candle behavior
Lock on candle close to keep the display stable
Help reduce clutter by focusing attention on the most important nearby levels
🧭 How Traders Commonly Use This Indicator
Identify key support and resistance zones
Wait for price reaction, not prediction
Trade with structure, not into it
Use the next quarter level as a logical checkpoint
Combine with trend, volume, VWAP, or higher-timeframe bias
Each level is a decision area, not a signal.
📉 Hybrid Trailing Stop (Visual Only)
An optional visual trailing stop can be displayed:
Anchored to confirmed quarter structure
Updates on candle close
Intended only as a risk-management reference
It does not place trades or generate signals.
⚠️ Important Notes
This indicator does not repaint
It does not provide buy/sell signals
It is designed for price-action traders
Always manage risk appropriately
✅ Best Use Cases
✔ Intraday & scalping
✔ Futures, stocks, crypto, forex
✔ Structure-based trading
✔ Traders who want clarity without clutter

KC Multi-TF ATR TableThis indicator is a comprehensive risk management tool designed to help traders gauge market volatility and determine rational Take Profit (TP) and Stop Loss (SL) levels. It allows you to analyze both the current timeframe and higher timeframes (15m, 1H, 4H, Daily) at a single glance.
Key Features:
Multi-Timeframe (MTF) Dashboard:
Displays ATR (Average True Range) values for fixed periods: 15 Minutes, 1 Hour, 4 Hours, and Daily, alongside your current chart timeframe.
Allows you to monitor whether general market volatility is expanding or contracting from a single panel.
Auto TP & SL Calculation:
Lists potential Long and Short targets for each timeframe based on your custom ATR multipliers.
Logic:
Buy TP: Close Price + (ATR x TP Multiplier)
Buy SL: Close Price - (ATR x SL Multiplier)
(Inverted logic applies for Sell setups.)
Dynamic On-Chart Lines:
Draws the calculated TP and SL levels directly on the chart for the current timeframe.
Lines extend 10 bars into the future, providing a visual reference for how close the price is to your targets.
Full Customization:
Calculation: You can adjust the ATR period and TP/SL multipliers to fit your strategy.
Visuals: Table position, text size, and all colors (buy, sell, background) can be personalized via the settings menu.
How to Use:
Trend Following: If ATR values on higher timeframes are increasing, it may indicate a strengthening trend.
Risk Management: Check the SL levels in the table before entering a trade to adjust your stop loss dynamically based on volatility.
Scalping: Use the on-chart lines as dynamic targets during support/resistance breakouts.

Market + Direction + Entry + Hold + Exit v1.5 FINALOverview
This script is a complete trend-based trading framework designed to filter market conditions, determine directional bias, detect high-quality pullback entries, manage active trades, and identify trend-weakening exit points.
It is optimized for NQ futures, Gold (XAUUSD), and Bitcoin, with adaptive parameters for each asset.
The logic focuses on trading only when conditions are favorable, aligning entries with the primary trend, and avoiding low-probability setups.
1. Market Condition Filter
Before any signal appears, the script checks whether the market is active using three conditions:
ATR compared to ATR moving average (volatility condition)
Volume compared to average volume (liquidity condition)
Price distance from VWAP (suppression of mean-reversion environments)
A trade environment is considered active when at least two of these three conditions are positive.
2. Trend Direction Filter
Directional bias is defined by:
EMA21 relative to EMA55
Price relative to VWAP
Heikin-Ashi structure
When these conditions align, the script switches into long-only or short-only mode.
No counter-trend signals are displayed.
3. Entry Logic (L, L2, L3 and S, S2, S3)
The system identifies pullback entries within a confirmed trend.
Long entries require:
Uptrend confirmation
Price dipping toward EMA21 or EMA55
A constructive Heikin-Ashi candle
Market environment active
Short entries mirror the same structure in bearish conditions.
Re-entries (L2, L3, S2, S3) are given only if the trend remains intact after the first entry.
4. Hold Logic
A hold signal appears if momentum remains aligned with the trend.
Momentum is evaluated using the Stochastic indicator (K and D lines).
5. Exit Logic
An exit signal appears when:
The recent structural low (for longs) or high (for shorts) is broken, and
The EMA slope indicates weakening trend strength
This combination identifies high-probability trend exhaustion.
How to Use
Add the script to your chart.
Select an asset preset (NQ, GOLD, BTC).
Wait for the market to be active.
Follow the entry signals (L, L2, L3 or S, S2, S3).
Hold signals help confirm continuation.
Exit signals indicate potential trend reversal or weakness.
Feature Summary
Market environment filter
Trend direction filter
Pullback-based entry system
Multi-stage re-entry framework
Momentum-based hold signal
Structure-based exit
Asset-adaptive parameters
Clean chart visualization
Disclaimer
This script is for research and educational use.
It does not constitute financial advice.
Always backtest before using in live markets.
개요
이 스크립트는 시장 상태 필터링, 추세 방향 판단, 고품질 눌림목 진입, 보유 판단, 추세 약화 기반 청산까지 모두 포함하는 완전한 트레이딩 프레임워크입니다.
NQ, 골드(XAUUSD), 비트코인에 맞게 최적화되어 있습니다.
1. 시장 필터
다음 세 가지 중 두 가지 이상이 충족될 때만 매매 환경을 ‘활성’으로 판단합니다.
ATR 기준 변동성 체크
거래량 활성도 체크
가격의 VWAP 거리 체크
2. 방향(추세) 필터
다음 조건을 기반으로 상승·하락 추세를 결정합니다.
EMA21 vs EMA55
가격 vs VWAP
Heikin-Ashi 구조
이 조건이 일치할 때만 롱 전용 또는 숏 전용 모드로 진입합니다.
3. 진입 로직
추세가 유지되는 상태에서 EMA21 또는 EMA55까지 눌림이 나올 때
L 또는 S 신호를 제공합니다.
추세가 유지되면 L2/L3, S2/S3 재진입 신호가 추가로 발생합니다.
4. 보유(Hold)
모멘텀이 추세 방향과 일치할 때 보유 신호를 제공합니다.
5. 청산(Exit)
다음 두 조건이 동시에 나타날 때 청산 신호가 표시됩니다.
직전 구조(스윙)가 붕괴될 때
EMA 기울기가 약화될 때
사용 방법
차트에 스크립트를 추가합니다.
자산 프리셋(NQ, GOLD, BTC)을 선택합니다.
시장이 활성일 때만 신호를 참고합니다.
L/S 진입 신호와 보유/청산 신호를 활용해 매매 흐름을 관리합니다.

Body Direction Ratio (Fixed Range)Overview
The Body Direction Ratio (Fixed Range) indicator measures directional participation inside a user-defined time range by analyzing candle bodies only.
Instead of counting candles, the indicator sums the actual body size of bullish and bearish candles within the selected range and displays their percentage relationship. This provides a clear view of who was in control during that period: buyers or sellers.
What the indicator does
Within the selected time range, the indicator:
Calculates bullish body size (close > open)
Calculates bearish body size (open > close)
Sums both values
Computes the percentage ratio between bullish and bearish bodies
Draws a range box covering the high/low of the selected period
Assigns a Bullish or Bearish bias
Colors the box automatically based on that bias
There is no “Balanced” state by design. The result is always either Bullish or Bearish, ensuring a clear directional context.
Bias Logic
Bullish Bias: Bullish body sum ≥ Bearish body sum
Bearish Bias: Bearish body sum > Bullish body sum
The box color reflects the detected bias instantly.
Fixed Range Control
Fully manual start and end time
Optional Auto End = Current Bar toggle
End time is always guaranteed to come after start time
No automatic extending unless explicitly enabled
This ensures precise and reproducible analysis.
How to use it (recommended workflow)
This indicator is not a signal tool. It is a context and participation tool.
A powerful use case is applying the indicator on lower timeframes at higher-timeframe points of interest.
Examples of points of interest:
Higher-timeframe support and resistance levels
Supply and demand zones
Daily or weekly key levels
Session ranges and reaction areas
Workflow example:
Identify a higher-timeframe level (e.g. daily resistance)
Switch to a lower timeframe (e.g. 5m or 15m)
Select a fixed range around the reaction area
Observe whether buyers or sellers dominated inside that range
Use the result as contextual information, not as an entry trigger
This helps answer questions such as:
Was the reaction buyer-driven or seller-driven?
Is participation expanding or fading?
Does price acceptance or rejection make structural sense?
Input Parameters
Time Range
Start Time
Defines the beginning of the fixed analysis range. Only candles whose time is equal to or after this timestamp are included in the calculation.
End Time
Defines the end of the fixed analysis range. Only candles whose time is equal to or before this timestamp are included in the calculation.
Auto End = Current Bar
When enabled, the end time is automatically set to the current bar. This allows the range to extend dynamically while keeping the start time fixed. When disabled, the range remains strictly fixed between Start Time and End Time.
Visual
Bullish Box Color
Sets the box color when bullish body participation is greater than or equal to bearish body participation.
Bearish Box Color
Sets the box color when bearish body participation is greater than bullish body participation.
Text Color
Defines the text color used for the information label displayed on the chart.
Important notes
This indicator does not predict price
It does not generate buy or sell signals
It should always be used together with structure, levels, and higher-timeframe context
Key benefits
Measures real participation instead of candle count
Works on any timeframe
Especially effective on lower timeframes around HTF levels
Clear directional bias without ambiguity
Clean, non-lagging, fixed-range logic

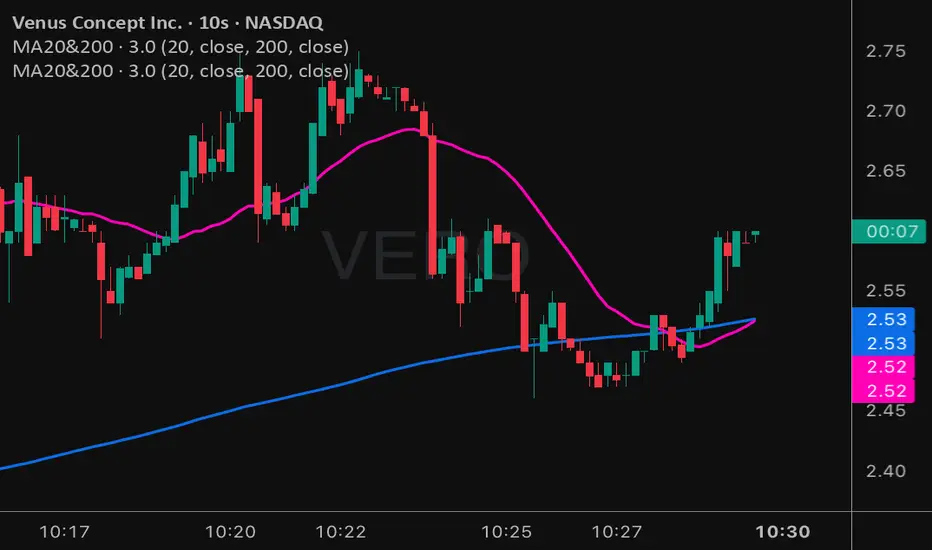
Moving Averages 20 & 200Moving Averages 20&200. Help you decide buy signal to find bullish or bearish.
50% level of Daily RangeThe 50% or midpoint between the current days highest and lowest points be used to divide the premium and discount of the days range. Price often reacts at this point and it can be used as a target for reversal trades. This indicator plots the level as it moves through out each day so is useful for backtesting as well as determining whether the current price is in premium or discount.

Supply and Demand Zones [BigBeluga]🔵 OVERVIEW
The Supply and Demand Zones indicator automatically identifies institutional order zones formed by high-volume price movements. It detects aggressive buying or selling events and marks the origin of these moves as demand or supply zones. Untested zones are plotted with thick solid borders, while tested zones become dashed, signaling reduced strength.
🔵 CONCEPTS
Supply Zones: Identified when 3 or more bearish candles form consecutively with above-average volume. The script then searches up to 5 bars back to find the last bullish candle and plots a supply zone from that candle’s low to its low plus ATR.
Demand Zones: Detected when 3 or more bullish candles appear with above-average volume. The script looks up to 5 bars back for a bearish candle and plots a demand zone from its high to its high minus ATR.
Volume Weighting: Each zone displays the cumulative bullish or bearish volume within the move leading to the zone.
Tested Zones: If price re-enters a zone and touches its boundary after being extended for 15 bars, the zone becomes dashed , indicating a potential weakening of that level.
Overlap Logic: Older overlapping zones are removed automatically to keep the chart clean and only show the most relevant supply/demand levels.
Zone Expiry: Zones are also deleted after they’re fully broken by price (i.e., price closes above supply or below demand).
🔵 FEATURES
Auto-detects supply and demand using volume and candle structure.
Extends valid zones to the right side of the chart.
Solid borders for fresh untested zones.
Dashed borders for tested zones (after 15 bars and contact).
Prevents overlapping zones of the same type.
Labels each zone with volume delta collected during zone formation.
Limits to 5 zones of each type for clarity.
Fully customizable supply and demand zone colors.
🔵 HOW TO USE
Use supply zones as potential resistance levels where sell-side pressure could emerge.
Use demand zones as potential support areas where buyers might step in again.
Pay attention to whether a zone is solid (untested) or dashed (tested).
Combine with other confluences like volume spikes, trend direction, or candlestick patterns.
Ideal for swing traders and scalpers identifying key reaction levels.
🔵 CONCLUSION
Supply and Demand Zones is a clean and logic-driven tool that visualizes critical liquidity zones formed by institutional moves. It tracks untested and tested levels, giving traders a visual edge to recognize where price might bounce or reverse due to historical order flow.

Universe PACut through the noise: The "Universe PA" Strategy
You don't need to get lost in thousands of complex terms like Order Flow, PO3, or Judas Swing. This indicator is based on the purest and most effective form of Price Action: Simplicity.
The Core Philosophy: While many traders focus on old history, the real opportunity lies in the last valid break (BOS). We call this the "Magic Line". The key is the Supply/Demand zone that caused that specific break.
Key Features:
Magic Line (BOS): Automatically marks the level where structure is broken.
Auto Supply & Demand Zones: Identifies the origin of the move (Order Block) that caused the break and draws a zone.
Smart Clean: Keeps your chart clean by automatically removing old/invalid zones, focusing only on the latest opportunity.
Entry Signals: Detects Pinbar (P) and Engulfing (E) patterns to help you time your entry perfectly within the zones.
How to Use:
Identify the "Magic Line" break and the Zone on higher timeframes (e.g., H4).
Wait for price to return (retest) to the Zone.
Look for "P" or "E" signals inside the zone for confirmation.
Simplicity pays.

NVentures Liquidity Radar Pro**NVentures Institutional Liquidity Radar Pro (NV-ILR Pro)** is a comprehensive liquidity analysis tool engineered for traders who understand that price moves from liquidity to liquidity. This indicator reveals where stop orders cluster, where institutional players left their footprints, and where the next liquidity grab is likely to occur.
Unlike conventional support/resistance indicators, ILR Pro combines multiple institutional concepts into a unified confluence scoring system — helping you identify high-probability zones where significant price reactions are most likely.
⯌ **Multi-Layer Liquidity Detection**
> The core engine identifies swing-based liquidity pools where retail stop-losses typically cluster. Each zone is dynamically sized using ATR, ensuring relevance across all timeframes and instruments. Zones automatically fade over time through a freshness decay system, keeping your chart focused on what matters now.
⯌ **Institutional Order Block Detection**
> Order Blocks mark the last opposing candle before a strong institutional move — the footprint of smart money entering positions. ILR Pro automatically detects both bullish and bearish Order Blocks using volume confirmation and consecutive candle validation. When price returns to these zones, institutions often defend their positions.
⯌ **Fair Value Gap Integration (Optional)**
> FVGs represent price imbalances where aggressive orders created inefficiencies. These gaps often act as magnets for price or provide optimal entry zones for mean-reversion strategies. FVG detection is disabled by default for a cleaner chart experience — enable it in settings when you want the full picture.
⯌ **Smart Confluence Scoring**
> Each liquidity zone receives a confluence score based on multiple factors:
- Overlapping swing levels (+1 per overlap)
- Nearby Order Blocks (+1)
- Higher Timeframe alignment (+2 bonus)
Zones with scores of 4+ are highlighted as high-confluence areas where institutional activity is most concentrated.
⯌ **Higher Timeframe Confluence**
> A liquidity zone on your current timeframe gains significant weight when it aligns with HTF structure. ILR Pro automatically checks for HTF swing alignment and awards bonus confluence points — no manual multi-timeframe analysis required.
⯌ **Liquidity Sweep Detection**
> Not every break of a level is a true breakout. ILR Pro identifies sweep patterns where price penetrates a liquidity zone but closes back inside, indicating that liquidity was grabbed without genuine continuation. Swept zones are visually marked, helping you avoid false breakout traps.
⯌ **Mitigation & Test Tracking**
> The indicator tracks how many times price has tested each zone and automatically marks Order Blocks as mitigated once price fully trades through them. This helps you focus on fresh, untested levels with higher reaction probability.
⯌ **Volume-Weighted Significance**
> Zones formed on high relative volume carry more weight. The volume scoring system identifies where significant participation occurred, filtering out noise from low-volume price action.
**PRACTICAL APPLICATION**
**For Breakout Traders**
> Identify where liquidity pools cluster above/below current price. When price sweeps these zones and reverses, you have confirmation of a liquidity grab — often the precursor to the real move in the opposite direction.
**For Mean-Reversion Traders**
> Enable FVG detection and look for price returning to unfilled gaps within high-confluence liquidity zones. The combination of gap-fill tendency and institutional defense creates high-probability reversal setups.
**For Trend Traders**
> Use Order Blocks as pullback entry zones within established trends. When price retraces to a bullish OB in an uptrend (or bearish OB in a downtrend), institutions often step in to defend their positions.
**For Multi-Timeframe Analysts**
> The HTF confluence system does the work for you. Zones marked with "HTF" in the label align with higher timeframe structure — these are your highest conviction levels.
**CONFIGURATION GUIDE**
**Essential Settings**
- Swing Detection Length: 5-8 for intraday, 8-15 for swing trading
- HTF Timeframe: One or two timeframes above your trading TF (e.g., D for H4 charts)
- Min Confluence to Display: 2 for comprehensive view, 3-4 for only high-probability zones
**Visual Clarity**
- FVGs are disabled by default — enable under "Fair Value Gaps" section when needed
- Zone transparency adjustable from 50-95%
- Label size options: tiny, small, normal
**Performance Optimization**
- Reduce Max Zones/OBs/FVGs for faster loading on lower-end systems
- Decrease Lookback Period for intraday scalping
**WHAT MAKES THIS DIFFERENT**
Most liquidity indicators simply draw lines at swing highs and lows. ILR Pro goes further:
→ **Confluence over quantity** — Not all levels are equal. The scoring system highlights where multiple institutional concepts align.
→ **Dynamic relevance** — Freshness decay ensures old, tested levels fade while fresh zones remain prominent.
→ **Sweep intelligence** — Distinguishes between genuine breakouts and liquidity grabs through wick analysis.
→ **Institutional integration** — Combines retail liquidity pools with smart money concepts (OBs, FVGs) in one unified tool.
→ **HTF awareness** — Automatic higher timeframe validation without switching charts.
**STATISTICS PANEL**
The built-in statistics table displays:
- Active resistance/support zones
- High confluence zone count
- Swept zone count
- Active Order Blocks
- Active FVGs (when enabled)
- Current ATR value
- Selected HTF
**ALERTS INCLUDED**
- Price approaching high confluence zone
- Liquidity sweep detected
- Bullish/Bearish Order Block formed
- Bullish/Bearish FVG detected (when enabled)
**NOTES**
This indicator works on all markets and timeframes. For optimal results on Forex, consider using Daily as your HTF for H1-H4 trading. For indices and crypto, Weekly HTF often provides stronger confluence.
The indicator uses User-Defined Types (UDTs) for clean data management and respects Pine Script's drawing limits (500 boxes/labels/lines).
**DISCLAIMER**
This indicator is for educational and informational purposes only. It does not constitute financial advice. All trading decisions are solely your responsibility. Past performance of any trading system or methodology is not indicative of future results.
