Clean Pivot Lines with AlertsTechnical Overview
This Script is designed for detecting untouched pivot highs and lows. It draws horizontal levels only when those pivots remain unviolated within a configurable lookback window and removes them automatically upon price breaches or sweeps.
Key components include:
Pivot detection logic : Utilizes ta.pivothigh()/ta.pivotlow() (or equivalent via request.security for HTF) with parameterized pivotLength to ensure flexibility and adaptability to different timeframes.
Cleanliness filtering : Checks lookbackBars prior to line creation to skip levels already violated, ensuring only uncontaminated pivots are used.
Dynamic level tracking : Stores active levels in arrays (highLines, lowLines) for continuous real-time monitoring.
Violation logic : Detects both close-based breaks (breakAbove/breakBelow) and wick-based sweeps (sweepAbove/sweepBelow), triggering alerts and automatic teardown.
Periodic housekeeping : Every N (10) confirmed bars, re-verifies “clean” status and removes silently invalidated levels—maintaining chart hygiene and avoiding stale overlays.
Customization options : Supports pivot timeframe override, colors, line width/style, lookback length, and alert toggling.
Utility
This overlay script provides a disciplined workflow for drawing meaningful support/resistance levels, filtering out contaminated pivot points, and signaling validations (breaks/sweeps) with alerts. Its modular design and HTF support facilitate integration into systematic workflows, offering far more utility than mere static pivot plots.
Usage Instructions
1. Adjust `pivot_timeframe`, `pivot_length`, and `lookback_bars` to suit your strategy timeframe and volatility structure.
2. Customize visual parameters as required.
3. Enable alerts to receive in-platform messages upon pivot violations.
4. Use HTF override only if analyzing multi-timeframe pivot behavior; otherwise, leave empty to default to chart timeframe.
Performance & Limitations
- Pivot lines confirmation lags by `pivot_length` bars; real-time signals may be delayed.
- Excessive active lines may impact performance on low-TF charts.
- The “clean” logic is contingent on the `lookback_bars` parameter; choose sufficiently high values to avoid false cleanliness.
- Alerts distinguish between closes beyond and wick-only breaches to aid strategic nuance.
Các điểm Pivot

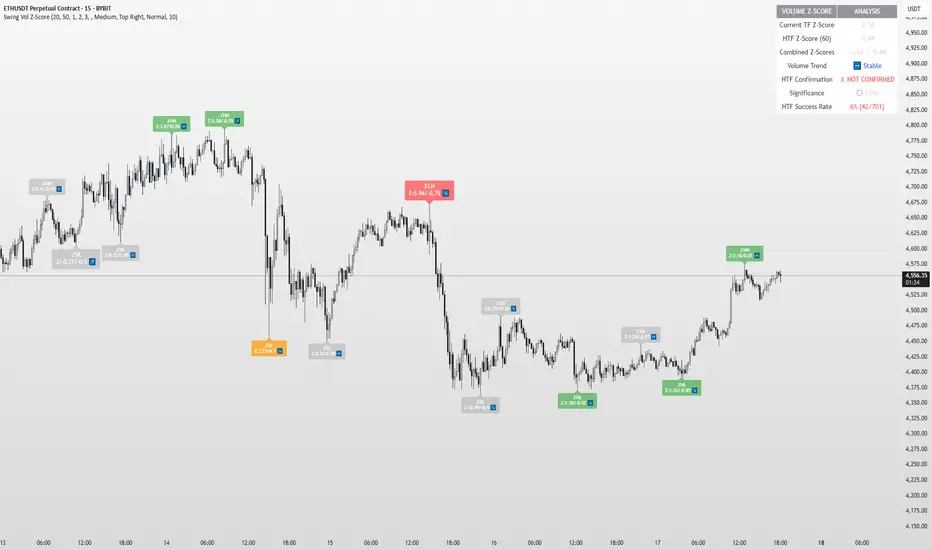
Swing Point Volume Z-ScoreSWING POINT VOLUME Z-SCORE INDICATOR
A volume analysis tool that identifies statistical volume spikes at swing points with optional higher timeframe confirmation.
This indicator uses Leviathan's method of swing detection. All credit to him for his amazing work (and any mistakes mine). I was also inspired by Trading Riot, who's Capitulation indicator gave me the idea to create this one.
WHAT IT DOES
This indicator combines three analytical approaches:
- Volume Z-score calculation to measure volume significance statistically
- Automatic swing point detection (higher highs, lower lows, etc.)
- Optional higher timeframe volume confirmation
The Z-score measures how many standard deviations current volume is from the average, helping identify when volume activity is genuinely elevated rather than relying on visual assessment.
VISUAL SYSTEM
The indicator uses a color-coded approach for quick assessment:
GREEN - Normal Activity (Z-Score 1.0-2.0)
Above-average volume levels
ORANGE - Elevated Activity (Z-Score 2.0-3.0)
High volume activity that may indicate increased interest
RED - Potential Institutional Activity (Z-Score 3.0+)
Very high volume levels that could suggest significant market participation
HIGHER TIMEFRAME CONFIRMATION
When enabled, the indicator checks volume on a higher timeframe:
- Checkmark symbol indicates HTF volume also shows elevation
- X symbol indicates HTF volume doesn't confirm
- Auto-selects appropriate higher timeframe or allows manual selection
KEY FEATURES
Statistical Approach: Uses Z-score methodology rather than arbitrary volume thresholds
Adaptive Thresholds: Can adjust based on market volatility conditions
Swing Focus: Concentrates analysis on structurally important price levels
Volume Trends: Shows whether volume is accelerating or decelerating
Success Tracking: Monitors how often HTF confirmation proves effective
DISPLAY OPTIONS
Basic Mode: Essential features with clean interface
Advanced Mode: Additional customization and analytics
Label Sizing: Four size options to fit different screen setups
Table Position: Moveable info table with transparency control
Custom Colors: Adjustable for different chart themes
PRACTICAL APPLICATIONS
May help identify:
- Volume spikes at support/resistance levels
- Potential accumulation or distribution zones
- Breakout confirmation with volume backing
- Areas where larger market participants might be active
Works on all liquid markets and timeframes, though generally more effective on 15-minute charts and higher.
USAGE NOTES
This is an analytical tool that highlights statistically significant volume events. It should be used as part of a broader analysis approach rather than as a standalone trading system.
The indicator works best when combined with:
- Price action analysis
- Support and resistance identification
- Trend analysis
- Proper risk management
Default settings are designed to work well across most instruments, but users can adjust parameters based on their specific needs and trading style.
TECHNICAL DETAILS
Built with Pine Script v5
Compatible with all TradingView subscription levels
Open source code available for review and learning
Works on stocks, forex, crypto, futures, and other liquid instruments
The statistical approach helps remove some subjectivity from volume analysis, though like all technical indicators, it should be used thoughtfully as part of a complete trading plan.
Prev D/W/M + Asia & London Levels [Oeditrades]Prev D/W/M + Asia & London Levels
Author: Oeditrades
Platform: Pine Script® v6
What it does
Plots only the most recent, fully completed:
Previous Day / Week / Month highs & lows
Asia and London session highs & lows
Levels are drawn as true horizontal lines from the period/session start and extended to the right for easy confluence reading. The script is non-repainting.
How it works
Prev Day/Week/Month: Uses completed HTF candles (high / low ) so values are fixed for the entire next period.
Sessions (NY time): Asia (default 20:00–03:00) and London (default 03:00–08:00) are tracked in America/New_York time. High/low are locked when the session ends, and the line is anchored at that session’s start.
Inputs & customization
Visibility: toggle Previous Day/Week/Month, Asia, London, and labels.
Colors: highs default red; lows default green (user-configurable). Session highs default pink, lows aqua (also editable).
Style: line style (solid/dotted/dashed) and width.
Sessions: editable time windows for Asia and London (still interpreted in New York time).
Disclaimer: optional on-chart disclaimer panel with editable text.
Notes
Works on any timeframe. For intraday charts, the HTF values remain constant until the next HTF bar completes.
If your market’s overnight hours differ, simply adjust the session windows in Inputs.
Lines intentionally show only the latest completed period/session to keep charts clean.
Use cases
Quick view of PDH/PDL, PWH/PWL, PMH/PML for bias and liquidity.
Intraday planning around Asia/London range breaks, retests, and overlaps with prior levels.
Disclaimer
This tool is for educational purposes only and is not financial advice. Markets involve risk; past performance does not guarantee future results.

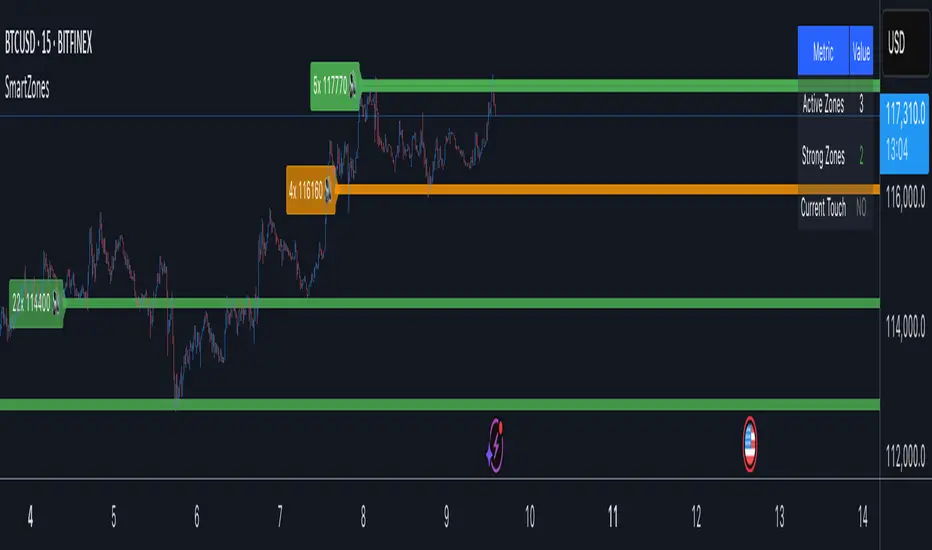
Smart Zone Detector by Mihkel00Advanced support/resistance indicator with dynamic zones and volume confirmation.
Smart Zone Detector automatically identifies key support and resistance zones using pivot points with following features:
Dynamic ATR-based zones that adapt to market volatility
Volume confirmation to filter out weak levels
Touch counting with strength classification (3x, 8x, 13x+ touches)
What You Get
Active Zones: Current qualified S/R levels (3+ touches)
Strong Zones: High-confidence areas with multiple confirmations
Color-coded zone strength (Green=Strong, Orange=Medium, Red=Weak)
Touch count labels showing zone significance
How to Use
Zone Identification: Look for zones with 3+ touches - these are qualified levels
Strength Assessment: Higher touch counts (8x, 13x+) = stronger zones
Volume Confirmation: volume-backed zones (more reliable)
Zone Interactions: Green/red X-crosses show real-time support/resistance tests
Dynamic Sizing: Zones automatically adjust width based on ATR
Settings
Lookback: How far back to scan for pivots (default: 100 bars)
Min Touches: Qualification threshold (default: 3 touches)
Volume Confirmation: Enable for higher-quality zones
Zone Tolerance: Sensitivity for merging nearby levels
Dynamic S/R Zones Pro [By TraderMan]Dynamic S/R Zones Pro
Short pitch:
Dynamic S/R Zones Pro automatically maps support and resistance levels using pivot highs/lows and draws surrounding zones. It displays lines, labels and a table — making it fast to spot relevant price areas on your chart. 📊✨
🔎 What does this indicator do?
Detects pivot highs/lows and converts them into dynamic S/R levels.
Draws a zone around each level (upper & lower bands) so you can see the interaction area. 🟢🔴
Counts how often each level was tested and writes that “strength” in the table — so you can prioritize levels.
Fully configurable colors, line styles, zone width and table display. 🎛️
Note: Pivot-based S/R is a widely used, objective way to map price levels — see pivot basics.
Investopedia
⚙️ How it works (technical)
Uses pivotRange = 10 to search for highs/lows inside that window.
Looks back analysisPeriod (284 in your script) and selects meaningful pivots; filters by strengthSR threshold.
channelPercent and zonePercent define band thickness (zone), with zoneWidthPercent applied over the last 300 bars.
Strength = number of times price tested that band; used for filtering and the table.
High/Low Zones option draws wide reference bands around the period’s highest/lowest pivots.
(Pivot logic here is pivot-based SR mapping — not classical static pivot formulas, but the same principle of marking widely watched price levels.)
Investopedia
🛠️ How to use (step-by-step)
Enable SR: toggle S/R drawing on/off.
Strength (strengthSR): increase to show only well-tested levels, decrease to show more levels.
Line Style / Width: readability and aesthetics.
Show Zones / Zone Width %: enable zones and set width (e.g. 2% of recent range).
Show High/Low Zones: draw wide reference zones for the highest/lowest pivots.
Extend SR: extend lines across the chart (past/future) for clarity.
Show Table: display levels, zone boundaries and strength in the top-right table. 📋
🎯 Trade entry ideas (examples)
Not financial advice — examples of how traders commonly use S/R zones.
1) Bounce Long (support zone buy)
Condition: Price arrives at a support zone and shows a bullish confirmation candle (e.g., hammer, bullish engulfing).
Extra confirmation: oversold RSI or supportive volume.
Entry: on confirmed candle close (market or limit).
SL: slightly below the zone’s lower band.
TP: next resistance or target R:R ≥ 1:2. (Retest confirmations reduce false-breakout risk.)
fxopen.com
Investopedia
2) Breakout Long
Condition: Price breaks resistance with increased volume.
Tactic: wait for a retest of the broken resistance (now support). Enter on confirmation.
SL: below the retest low or zone lower band.
TP: next zone / predetermined R:R target. Breakouts need volume/retest confirmation to avoid fakeouts.
Investopedia
fxopen.com
3) Scalp
Use narrower zones, smaller TF, very tight SL and smaller R:R (e.g., 1:1), account for spreads/fees.
🛡️ Risk management
Don’t risk too much per trade — follow a fixed % (e.g., 1–2% max).
cmegroup.com
Plan SL & TP before entry; avoid emotional adjustments.
Investopedia
Calculate risk/reward; aim for a favorable R:R and backtest your rules.
CenterPoint Securities
✔️ Practical tips
Filter by strength to remove noisy levels.
Timeframe matters: higher TF = stronger levels.
Combine with other indicators (volume, RSI, MAs) for better confirmation.
Backtest the script and your entry rules before deploying live.
Quick summary: Dynamic S/R Zones Pro is a pivot-based S/R & zone mapper that highlights strong levels and helps you trade bounces, breakouts and retests — but always use SL/TP and solid risk management.
Investopedia
+2
Investopedia
+2
fxopen.com
Disclaimer: Not financial advice. Trading involves risk. 🔒

Key Session Levels (KUUUMZ)
📜 Summary
Tired of manually drawing the same key levels every single trading day? The KUUMZ-Key Session Levels indicator automates this entire process, plotting the most critical intraday and previous day levels directly on your chart. This tool provides a clean, dynamic framework of potential support and resistance zones, allowing you to focus on your trading strategy, not on chart setup.
Built for day traders and scalpers of US equities, this indicator helps you instantly visualize the market's structure from the moment the session begins.
🎯 Key Levels Plotted
This indicator automatically identifies and draws horizontal lines for the following session levels:
Previous Day High (PDH) & Low (PDL): The highest and lowest points of the prior trading day, which often act as major psychological support and resistance magnets.
Pre-Market High & Low (PMH/PML): The range established during the pre-market session (4:00 - 9:30 AM ET). A breakout from this range can often signal the initial directional bias.
5-Minute Opening Range High & Low (OR5): The high and low of the first 5 minutes of the regular session (9:30 - 9:35 AM ET). A crucial level for opening range breakout (ORB) strategies.
15-Minute Opening Range High & Low (OR15): The high and low of the first 15 minutes (9:30 - 9:45 AM ET), providing a slightly broader view of the initial balance area.
📈 How to Use This Indicator
These levels are fundamental to many intraday trading strategies:
Support & Resistance: Watch how price reacts as it approaches these levels. A bounce or rejection can signal a potential reversal, while a clean break can indicate continuation.
Breakout Trading: A strong, high-volume move through one of these levels (e.g., breaking above the Pre-Market High) can be an entry signal for a breakout trade.
Market Context: Quickly gauge market sentiment. Is the price trading above or below the previous day's range? Is it trapped within the opening range? These levels provide immediate context to the current price action.
Setting Targets & Stops: Use these levels to set logical profit targets or place stop-loss orders. For example, if you go long on a breakout of the 5-min OR, the Pre-Market High or Previous Day High could be your first target.
⚙️ Features & Customization
The script is designed to be flexible and clean, allowing you to tailor it to your specific charting style.
Toggle Any Level: Enable or disable any set of levels (Previous Day, Pre-Market, etc.) to reduce clutter.
Full Style Control: Customize the Color, Width, and Style (Solid, Dotted, Dashed) for each pair of high/low lines independently.
Optional Labels: A master switch allows you to show or hide all price labels (like "PDH", "PM Low", etc.) with a single click.
Automatic & Dynamic: Levels are calculated and drawn in real-time as each session concludes and are automatically cleared and reset for the next trading day.

The Barking Rat ReversionsMean Reversion with Multi-Layered Precision
The Barking Rat Reversions is a short-term mean reversion strategy tailored for high-volatility markets. It combines several well-established technical tools in a configuration to identify overextended price movements likely to revert toward equilibrium. The goal is to isolate high-quality, short-term reversal opportunities while filtering out low-conviction setups.
At its core, our strategy triggers off Fair Value Gaps (FVGs) that occur a considerable distance away from a dynamically defined equilibrium band. It then validates these gaps by checking proximity to recent support and resistance drawn from swing extremes.
Additional confirmation comes from momentum filters and wick-rejection patterns, ensuring each entry aligns with both price structure and stretched momentum. Exits use volatility-adjusted profit targets. Keeping the approach disciplined and adaptive.
🧠Core Logic: Selectivity & Structure
This strategy is intentionally very selective. We have designed it to filter out roughly 95% of all market noise, highlighting only setups that pass multiple validation layers outlined below.
Fair Value Gaps (FVGs) as the Primary Trigger
FVGs identify imbalance zones where price historically retraces. These inefficient zones often become magnets for reversion as the market seeks to rebalance.
Dynamic Equilibrium Band + S/R
Defines a fair value zone with a long-term moving average and combines it with shorter-term swing pivots to establish support/resistance. Only FVGs that occur outside the band and near recent pivots are considered, ensuring reversals are sufficiently distanced and not taken too close to the mean.
Proximity to Support/Resistance
Setup validity depends on location. The strategy filters for FVGs near well-defined structural levels — areas where price has previously turned (i.e., recent swing highs or lows). This increases the likelihood that reversals are occurring at legitimate zones of confluence.
Wick-Rejection Confirmation
Confirms potential exhaustion through characteristic candle wick patterns beyond the equilibrium region. This acts as another filter to improve signal accuracy.
Sequential Filtered Signals
Custom logic ensures that a new signal in any direction must improve upon the previous one, preventing repetitive or suboptimal entries.
Multi-Step Confirmation
All validation layers must coincide on the same bar before a signal triggers, dramatically reducing false positives.
📈Chart Visuals: Designed for Clarity
To ensure transparency and easy interpretation, the script overlays intuitive visuals:
Green “▲” below a candle: Indicates a potential long entry
Red “▼” above a candle: Indicates a potential short entry
Green “✔️”: Marks exit from a trade when ATR target is met
Background shading (green/red): Indicates trade direction while active
Support/Resistance lines: Auto-plotted from recent swing levels
🔔Alerts: Stay Notified Without Watching
The strategy supports real-time alerts on candle close, ensuring that signals are only triggered once fully confirmed.
You must manually set up alerts within your TradingView account. Once configured, you’ll be able to set up one alert per instrument. This one alert covers all relevant signals and exits — ideal for hands-free monitoring.
⚙️Strategy report properties
Position size: 25% equity per trade
Initial capital: 10,000.00 USDT
Pyramiding: 10 entries per direction
Slippage: 2 ticks
Commission: 0.055% per side
Backtest timeframe: 1-minute
Backtest instrument: HYPEUSDT
Backtesting range: Jul 21, 2025 — Aug 7, 2025
Note on Sample Size:
You’ll notice the report displays fewer than the ideal 100 trades in the strategy report above. This is intentional. The goal of the script is to isolate high-quality, short-term reversal opportunities while filtering out low-conviction setups. This means that the Barking Rat Reversions strategy is ultra-selective, filtering out over 95% of market noise by enforcing multiple validation layers. The brief timeframe shown in the strategy report here illustrates its filtering logic over a short window — not its full capabilities. As a result, even on lower timeframes like the 1-minute chart, signals are deliberately sparse — each one must pass all criteria before triggering.
We conducted a broader backtest covering the period from December 5, 2024 to July 31, 2025, during which the strategy identified 968 high-probability setups on the same instrument and timeframe as the strategy report.
For a larger dataset:
Once the strategy is applied to your chart, users are encouraged to expand the lookback range or apply the strategy to other volatile pairs to view a full sample.
💡Why 25% Equity Per Trade?
While it's always best to size positions based on personal risk tolerance, we defaulted to 25% equity per trade in the backtesting data — and here’s why:
Backtests using this sizing show manageable drawdowns even under volatile periods
The strategy generates a sizeable number of trades, reducing reliance on a single outcome
Combined with conservative filters, the 25% setting offers a balance between aggression and control
Users are strongly encouraged to customize this to suit their risk profile.
🔍What Makes This Strategy Unique?
Multi-factor confirmation using FVGs, EMA deviation, RSI, wick rejection, and S/R
Clean, Intuitive Chart Experience
Real-time alerts triggered only on confirmation
Variables monitor prior reversal points, guaranteeing each new signal offers an improved entry
Tracks active positions and resets filters upon exit.

Session High/Low/PD Selector with Realtime AlertsThis indicator displays key intraday and multi-day price levels directly on the chart for short-term traders. It includes:
Session Highs and Lows for Asia, London, and New York sessions
→ Automatically plots each completed session’s high and low, with lines extended to the right and labeled.
Previous Day High, Low, and Close
→ Draws levels from the prior daily candle with adjustable colors and labels.
Previous Week High and Low
→ Weekly key levels are plotted just like daily ones.
Real-time Alerts
→ Optional alerts trigger immediately when price touches or breaks any session, PDH/PDL, or PWH/PWL levels.
Fully Customizable
→ Toggle sessions, previous day/week levels, label positions, and colors per user preference.

Multi-Timeframe SFP + SMTImportant: Please Read First
This indicator is not a "one size fits all" solution. It is a professional and complex tool that requires you to learn how to use it, in addition to backtesting different settings to discover what works best for your specific trading style and the assets you trade. The default settings provided are my personal preferences for trading higher-timeframe setups, but you are encouraged to experiment and find your own optimal configuration.
Please note that while this initial version is solid, it may still contain small errors or bugs. I will be actively working on improving the indicator over time. Also, be aware that the script is not written for maximum efficiency and may be resource-intensive, but this should not pose a problem for most users.
The source code for this indicator is open. If you truly want to understand precisely how all the logic works, you can copy and paste the code into an AI assistant like Gemini or ChatGPT and ask it to explain any part of the script to you.
Author's Preferred Settings (Guideline)
As a starting point, here are the settings I personally use for my trading:
SFP Timeframe: 4-Hour (Strength: 5-5)
Max Lookback: 35 Bars
Raid Expiration: 1 Bar
SFP Lines Limit: 1
SMT Timeframe 1: 30-Minute (Strength: 2-2) with 3-Minute LTF Detection.
SMT Timeframe 2: 15-Minute (Strength: 3-3) with 3-Minute LTF Detection.
SMT Timeframe 3: 1-Hour (Strength: 1-1) with 3-Minute LTF Detection.
SMT Timeframe 4: 15-Minute (Strength: 1-1) with 3-Minute LTF Detection.
Multi-Timeframe SMT: An Overview
This indicator is a powerful tool designed to identify high-probability trading setups by combining two key institutional concepts: Swing Failure Patterns (SFP) on a higher timeframe and Smart Money Technique (SMT) divergences on a lower timeframe. A key feature is the ability to configure and run up to four independent SMT analyses simultaneously, allowing you to monitor for divergences across multiple timeframes (e.g., 15m, 1H, 4H) from a single indicator.
Its primary purpose is to generate automated signals through TradingView's alert system. By setting up alerts, the script runs server-side, monitoring the market for you. When a setup presents itself, it will send a push notification to your device, allowing you to personally evaluate the trade without being tied to your screen.
The Strategy: HTF Liquidity Sweeps into LTF SMT
The core strategy is built on a classic institutional trading model:
Wait for a liquidity sweep on a significant high timeframe (e.g., 4-hour, Daily).
Once liquidity is taken, look for a confirmation of a shift in market structure on a lower timeframe.
This indicator uses an SMT divergence as that confirmation signal, indicating that smart money may be stepping in to reverse the price.
How It Works: The Two-Step Process
The indicator's logic follows a precise two-step process to generate a signal:
Step 1: The Swing Failure Pattern (SFP)
First, the indicator identifies a high-timeframe liquidity sweep. This is configured in the "Swing Failure Pattern (SFP) Timeframe" settings.
It looks for a candle that wicks above a previous high (or below a previous low) but then closes back within the range of that pivot. This action is known as a "raid" or a "swing failure," suggesting the move failed to find genuine momentum.
Step 2: The SMT Divergence
The moment a valid SFP is confirmed, the indicator's multiple SMT engines activate.
Each engine begins monitoring the specific SMT timeframe you have configured (e.g., "SMT Timeframe 1," "SMT Timeframe 2," etc.) for a Smart Money Technique (SMT) divergence.
An SMT divergence occurs when two closely correlated assets fail to move in sync. For example, after a raid on a high, Asset A makes a new high, but Asset B fails to do so. This disagreement suggests weakness and a potential reversal.
When the script finds this divergence, it plots the SMT line and triggers an alert.
The Power of Alerts
The true strength of this indicator lies in its alert capabilities. You can create alerts for both unconfirmed and confirmed SMTs.
Enable Alerts LTF Detection: These alerts trigger when an unconfirmed, potential SMT is spotted on the lower "LTF Detection" timeframe. While not yet confirmed, these early alerts can notify you of a potential move before it fully happens, allowing you to be ahead of the curve and find the best possible trade entries.
Enable Alerts Confirmed SMT: These alerts trigger only when a permanent, confirmed SMT line is plotted on your chosen SMT timeframe. These signals are more reliable but occur later than the early detection alerts.
Key Concepts Explained
What is Pivot Strength?
Pivot Strength determines how significant a high or low needs to be to qualify as a valid structural point. A setting of 5-5, for example, means that for a candle's high to be considered a valid pivot high, its high must be higher than the highs of the 5 candles to its left and the 5 candles to its right.
Higher Strength (e.g., 5-5, 8-8): Creates fewer, but more significant, pivots. This is ideal for identifying major structural highs and lows on higher timeframes.
Lower Strength (e.g., 2-2, 3-3): Creates more pivots, making it suitable for identifying the smaller shifts in momentum on lower timeframes.
Raid Expiration & Validity
An SFP signal is not valid forever. The "Raid Expiration" setting determines how many SFP timeframe bars can pass after a raid before that signal is considered "stale" and can no longer be used to validate an SMT. This ensures your SMT divergences are always in response to recent liquidity sweeps.
Why You Must Be on the Right Chart Timeframe to See SMT Lines
Pine Script™ has a fundamental rule: an indicator running on a chart can only "see" the bars of that chart's timeframe or higher.
When the SMT logic is set to the 15-minute timeframe, it calculates its pivots based on 15-minute data. To accurately plot lines connecting these pivots, you must be on a 15-minute chart or lower (e.g., 5-minute, 1-minute).
If you are on a higher timeframe chart, like the 1-hour, the 15-minute bars do not exist on that chart, so the indicator has no bars to draw the lines on.
This is precisely why the alert system is so powerful. You can set your alert to run on the 15-minute timeframe, and TradingView's servers will monitor that timeframe for you, sending a notification regardless of what chart you are currently viewing.

CPR by myBiniyogCPR by myBiniyog
Purpose:
Clearly plots the Central Pivot Range (CPR), Support, and Resistance levels daily, weekly, and monthly (optional). CPR levels help intraday traders identify potential market direction, trends, and reversal points. CPR lines plotted clearly (blue), Support levels (green), and Resistance levels (red).
Calculation Method:
Pivot (P) = (High + Low + Close) / 3
Bottom Central (BC) = (High + Low) / 2
Top Central (TC) = Pivot + (Pivot - BC)
Support (S1-S3) and Resistance (R1-R3) levels calculated traditionally from pivot formulas.
Uniqueness & Originality:
Fully original script combining multi-timeframe (Daily/Weekly/Monthly) pivots.
Unique, clear visual representation designed for ease of use.
Closed-source to protect custom visual style and original logic.
Recommended Timeframes:
For optimal clarity and performance, use on 5-minute, 10-minute, or 15-minute intraday charts.
Compliance Statement:
Fully compliant with TradingView House Rules. Original work, not derived from publicly available scripts.

ICT OTE StrategyStrategy Overview
This strategy is designed to automate a specific trading setup based on the concepts of Inner Circle Trader (ICT). Its primary goal is to identify significant market structure swings, frame a Fibonacci retracement over the most recent price leg, and execute a trade when the price pulls back to a key user-defined level. It is a counter-trend entry strategy, meaning it looks to enter a trade during a pullback within an established trend.
How It Works: Step-by-Step
1. Swing Detection:
The strategy first identifies significant swing highs and swing lows.
A swing high is confirmed only if it's higher than a specific number of bars to its left and right (defined by "Left Strength" and "Right Strength" in the settings).
The same logic applies to swing lows, which must be lower than the bars around them. This filtering ensures only structurally important turning points are considered.
2. Defining the Trading Range:
Once a new swing is confirmed, the strategy defines the most recent dealing range.
If a new swing high forms, the range is drawn from the previous swing low up to this new high. This is considered a bullish leg.
If a new swing low forms, the range is drawn from the previous swing high down to this new low. This is considered a bearish leg.
3. Fibonacci Retracement & Trade Setup:
An automatic Fibonacci retracement tool is drawn over this newly defined dealing range. The 0.0 level is placed at the end of the move, and the 1.0 level is at the beginning.
The strategy then prepares to enter a trade based on this range.
4. Trade Execution:
Entry: A limit order is placed at a specific Fibonacci level within the range, waiting for the price to retrace. The default entry is the 0.618 level, but this can be changed in the settings.
For a bullish leg, it places a LONG (Buy) order, anticipating that the price will bounce from the retracement level.
For a bearish leg, it places a SHORT (Sell) order, anticipating that the price will be rejected from the retracement level.
Stop Loss: The Stop Loss is automatically placed at the 1.0 level of the Fibonacci range. This is the point where the original trade idea is invalidated.
Take Profit: The Take Profit is automatically placed at the 0.0 level of the Fibonacci range. This is the target at the end of the price leg.
Key Features & Customization
Automated Trade Logic: The entire process, from identifying the setup to placing the entry, stop loss, and take profit, is fully automated.
Visual Aid: The script draws the swing points and the Fibonacci retracement on the chart, so you can visually confirm the setups the strategy is taking.
Customizable Entry: You can change the "Entry Level" in the settings to test different Fibonacci levels, such as the Optimal Trade Entry (OTE) at 0.705.
Toggle Visuals: You can turn the Fibonacci drawing on or off to keep your chart clean while still allowing the strategy to run in the background.

Price Widget on ScreenSimple yet useful script, to see the PRICE/CHANGE of the chart you are on. I use it in my 6/8 charts screen, so you can see the graph and the price.

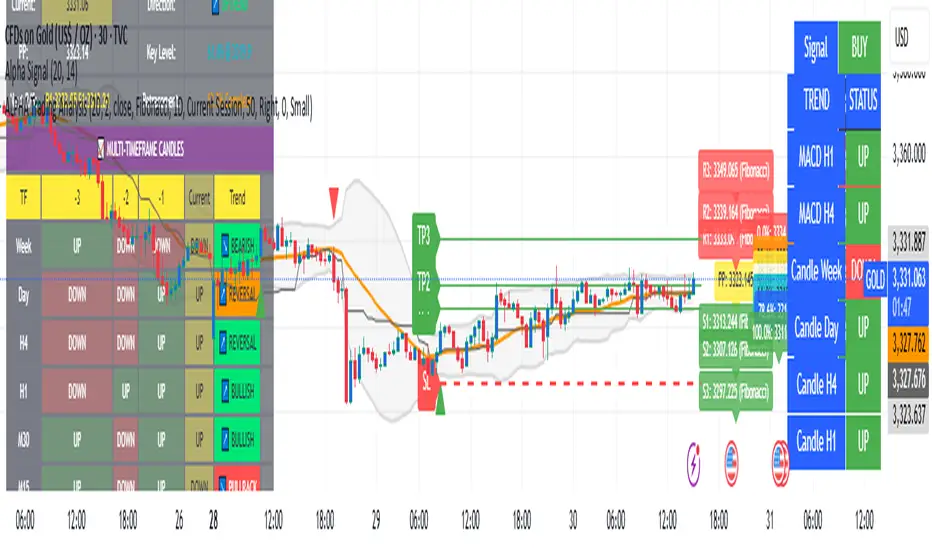
Alpha Trading AnalysisAlpha Trading Dashboard Analysis
- Candle Analysis
- Pivot Point and Fibonacci
- Bollinger band
Hurst Criticality EngineThe Hurst Criticality Engine (HCE) is an advanced trading indicator designed to detect potential breakout (BUY) and exhaustion (SELL) conditions by combining multi‑scale Hurst exponent analysis with tactical confirmations such as VWAP, RSI, volume spikes, Fibonacci log‑periodic patterns and price channels.
It is optimized for traders seeking structured confluence in volatile or trending markets, and can be applied across different timeframes, from intraday scalping (1m–15m) to swing trading (1h–4h).
What It Does
HCE identifies potential turning points and momentum shifts by evaluating market persistence and volatility across several dimensions. It generates three main types of labels:
CRITICAL Signals: Triggered when multiple Hurst scales align and tactical validations confirm the setup. These can indicate breakout (BUY) or exhaustion (SELL) conditions.
CPC (Critical Pivot Confirmation): Appears at structural highs or lows validated by Hurst exponent alignment and VWAP context.
PIVOT Labels: Marks confirmed structural highs (▼) and lows (▲) that can be used to anticipate reversals or continuation setups.
A dynamic Tactical Panel shows real‑time information on signal strength, VWAP zones, last confirmed signals and the current alignment of the Hurst scales.
How It Works
The indicator integrates several analytical components, each designed to filter noise and add context:
Hurst Exponent Analysis:
Evaluates price persistence across up to five customizable time scales (default: 10, 20, 40, 80, 160 bars).
A signal is considered when at least a minimum number of scales (default: 3) align as bullish (>0.6) or bearish (<0.4).
Rolling VWAP with Standard Deviation Bands:
Plots a rolling VWAP and three customizable bands (±1σ, ±2σ, ±3σ).
Signals are validated if price is correctly positioned relative to VWAP (above for BUY, below for SELL) or if it breaks the outermost band, suggesting volatility extremes.
RSI and Volume Confirmation:
Uses RSI (default: 14‑period) to confirm momentum alignment (e.g., oversold for BUY, overbought for SELL).
Incorporates volume spikes (default: 1.5× average) as an additional confirmation of institutional participation.
Fibonacci Log‑Periodic Patterns:
Validates critical signals by checking whether price oscillations align with harmonic Fibonacci ratios (default: 0.618).
Channel Detection:
Runs a 50‑bar regression channel to identify structural boundaries.
Signals are reinforced when price interacts significantly with channel extremes or breaks out from them.
Dynamic Scoring System:
Every signal receives a score from 0 to 8 based on the confluence of all the above factors.
Scores ≥6 indicate strong alignment, 4–5 medium, 2–3 weak and ≤1 neutral.
Why This Combination?
Each component provides different insights: the Hurst exponent captures market persistence, VWAP defines value areas, RSI and volume confirm momentum and participation, while Fibonacci and channels provide structural references. This synergy allows HCE to filter noise and focus on conditions where multiple factors align, increasing the reliability of the setups.
How to Use It
Add the Indicator to the Chart:
Works on any instrument and timeframe (e.g., 1m, 5m, 15m for scalping; 1h, 4h for swing trading).
Configure Settings:
General Parameters: Set the minimum number of Hurst scales, cooldown between signals and spacing mode (manual or adaptive).
Tactical Validations: Enable or disable RSI, volume, Fibonacci or channel filters.
VWAP Settings: Adjust length (default: 50 bars) and deviation bands.
Hurst Scales: Enable up to five scales and customize their lengths.
Tactical Panel and Labels: Choose compact or detailed view and toggle the display of CRITICAL, CPC, PIVOT or Observation labels.
Interpret Signals:
CRITICAL (B/S): Labels appear above/below price with tooltips showing the signal score, VWAP status and momentum context.
CPC (⚡CPC↑ / ⚡CPC↓): Indicates critical pivots confirmed at structural highs or lows.
PIVOT (▲ / ▼): Marks confirmed highs/lows for additional context.
Observation Labels (⚠️): Highlight potential setups not meeting full CRITICAL criteria.
Monitor the Tactical Panel:
Displays the VWAP zone, number of aligned Hurst scales, signal score and last confirmed signals.
Recommendations
Use HCE as a confluence filter, not as a standalone entry tool.
Focus on signals with Medium (4–5) or Strong (≥6) scores.
Combine CPC and PIVOT labels with broader context for swing or reversal trades.
Apply on clean charts (without overlapping indicators) for optimal visualization.
Always use proper risk management, as no indicator can predict outcomes with certainty.
Chart Setup and Alerts
The script includes customizable alerts for CRITICAL, CPC, PIVOT and VWAP breakouts.
For clear visualization, use it on charts without clutter.
Works best on liquid markets (e.g., forex, crypto, stocks) and in volatile or trending conditions

🔁 A.X.I.S Fibonacci Engine V2 – Smart Projected Pathway🔁 A.X.I.S Fibonacci Engine V2 – Smart Projected Pathway indicator
The A.X.I.S Fibonacci Engine V2 is a next-generation Fibonacci projection tool designed for traders seeking advanced, adaptive levels that respond to true multi-timeframe market structure. Built from the ground up for active traders—scalpers, swing traders, and position players—it fuses traditional Fibonacci logic with dynamic price projection and smart anchor logic.
How It Works:
Multi-Timeframe Anchoring:
Anchors your Fibonacci levels to High Timeframe (HTF) pivots for powerful bias and “macro” market structure, while also utilizing Low Timeframe (LTF) swing detection for precise “micro” projection and pathway analysis.
Dynamic Pathway Projection:
Beyond static lines, this engine allows Fibonacci levels to be projected forward, following the price path between significant swings—giving you projected targets and active “pathways” instead of just fixed retracement bands.
Trend-Adaptive Logic:
Determines bullish/bearish bias based on where HTF price closes relative to a moving average (HTF EMA-20), meaning the plotted fibs automatically adjust to uptrends or downtrends. No need to guess direction.
Auto-Cleanup & Smart Management:
Old lines and labels are deleted automatically to keep your chart clean, and levels are recalculated with every new significant swing (“leg”)—no manual intervention needed.
Key Features:
Multi-Timeframe Input:
Choose both HTF (for “anchor” pivots) and LTF (for “projection” pivots) independently.
Fine-tune swing sensitivity for both anchors and pathway pivots.
Classic + Projected Mode:
Choose between standard horizontal Fibs or enable Dynamic Pathway Mode to project levels diagonally into future bars, creating “fib pathways.”
Color Customization:
Individualize bullish/bearish fib colors, line style (solid, dashed, dotted), thickness, label position, and transparency.
Special “golden zone” highlighting for the most critical levels (0.618/0.786).
Visual Anchors:
Optionally plot markers for HTF swing pivots for extra clarity.
Chart Cleanliness:
Script manages and deletes its own objects—no more chart clutter!
Real-Time Auto-Update:
All levels and pathways update in real time as market structure changes.
User-Friendly Labels:
Toggle on/off fib level labels, with position and background adjustments.
Practical Trading Applications:
Swing/Position Trading:
Use HTF pivots for macro context, then project LTF fibs into the future for potential reversal/extension targets.
Scalping:
Deploy on lower timeframes with micro pivots for intraday levels and short-term projected moves.
Dynamic Take-Profit & Entry Zones:
Identify evolving TP and re-entry zones as price carves out new swings, even in choppy or trending conditions.
Trend Confirmation:
Let the engine determine trend direction, so your fibs are always aligned with prevailing momentum.
How to Use:
Add to Chart:
Apply the indicator to any chart or timeframe.
Set Your Anchors:
Pick the HTF (anchor) and LTF (projection) timeframes.
Adjust swing sensitivity (lookback) as needed.
Enable/Disable Dynamic Pathway:
For regular fibs, leave off.
For projected “pathways,” turn it ON—lines will project forward along the likely path of the next move.
Adjust Colors, Labels, and Styles:
Fine-tune everything for clarity and your personal style.
Watch for Changes:
As new pivots form, the script will update levels in real time, keeping your roadmap fresh.
(Optional) Show Macro Swings:
Toggle on/off to plot markers for the most recent HTF pivots.
Who Is It For?
Day traders, scalpers, and swing traders wanting true projected price targets—not just static fibs.
Traders tired of redrawing fibs after every new swing.
Anyone who wants a clean, dynamic, and truly adaptive fib tool that blends macro and micro market structure into one engine.
What Makes It Different?
True multi-timeframe awareness:
Adapts to both macro (HTF) and micro (LTF) structure.
Automatic trend recognition:
Fibs align with price action—no manual flipping.
Projected, not just static:
See where fib levels could land, not just where they were.
Cleanest chart management:
Deletes its own lines and labels on every update—no mess, ever.
Note:
This tool is for educational and informational purposes only. Not financial advice. Always use proper risk management!
Any issues or feature requests? Drop a comment below or reach out!
Happy trading and welcome to the A.X.I.S revolution.
— I5X-Albatross

Buy The Dip - ENGThis script implements a grid trading strategy for long positions in the USDT market. The core idea is to place a series of buy limit orders at progressively lower prices below an initial entry point, aiming to lower the average entry price as the price drops. It then aims to exit the entire position when the price rises a certain percentage above the average entry price.
Here's a detailed breakdown:
1. Strategy Setup (`strategy` function):
`'거미줄 자동매매 250227'`: The name of the strategy.
`overlay = true`: Draws plots and labels directly on the main price chart.
`pyramiding = 15`: Allows up to 15 entries in the same direction (long). This is essential for grid trading, as it needs to open multiple buy orders.
`initial_capital = 600`: Sets the starting capital for backtesting to 600 USDT.
`currency = currency.USDT`: Specifies the account currency as USDT.
`margin_long/short = 0`: Doesn't define specific margin requirements (might imply spot trading logic or rely on exchange defaults if used live).
`calc_on_order_fills = false`: Strategy calculations happen on each bar's close, not just when orders fill.
2. Inputs (`input`):
Core Settings:
`lev`: Leverage (default 10x). Used to calculate position sizes.
`Investment Percentage %`: Percentage of total capital to allocate to the initial grid (default 80%).
`final entry Percentage %`: Percentage of the *remaining* capital (100 - `Investment Percentage %`) to use for the "semifinal" entry (default 50%). The rest goes to the "final" entry.
`Price Adjustment Length`: Lookback period (default 4 bars) to determine the initial `maxPrice`.
`price range`: The total percentage range downwards from `maxPrice` where the grid orders will be placed (default -10%, meaning 10% down).
`tp`: Take profit percentage above the average entry price (default 0.45%).
`semifinal entry price percent`: Percentage drop from `maxPrice` to trigger the "semifinal" larger entry (default -12%).
`final entry price percent`: Percentage drop from `maxPrice` to trigger the "final" larger entry (default -15%).
Rounding & Display:
`roundprice`, `round`: Decimal places for rounding price and quantity calculations.
`texts`, `label_style`: User interface preferences for text size and label appearance on the chart.
Time Filter:
`startTime`, `endTime`: Defines the date range for the backtest.
3. Calculations & Grid Setup:
`maxPrice`: The highest price point for the grid setup. Calculated as the lowest low of the previous `len` bars only if no trades are open. If trades are open, it uses the entry price of the very first order placed in the current sequence (`strategy.opentrades.entry_price(0)`).
`minPrice`: The lowest price point for the grid, calculated based on `maxPrice` and `range1`.
`totalCapital`: The amount of capital (considering leverage and `per1`) allocated for the main grid orders.
`coinRatios`: An array ` `. This defines the *relative* size ratio for each of the 11 grid orders. Later orders (at lower prices) will be progressively larger.
`totalRatio`: The sum of all ratios (66).
`positionSizes`: An array calculated based on `totalCapital` and `coinRatios`. It determines the actual quantity (size) for each of the 11 grid orders.
4. Order Placement Logic (`strategy.entry`):
Initial Grid Orders:
Runs only if within the specified time range and no position is currently open (`strategy.opentrades == 0`).
A loop places 11 limit buy orders (`Buy 1` to `Buy 11`).
Prices are calculated linearly between `maxPrice` and `minPrice`.
Order sizes are taken from the `positionSizes` array.
Semifinal & Final Entries:
Two additional, larger limit buy orders are placed simultaneously with the grid orders:
`semifinal entry`: At `maxPrice * (1 - semifinal / 100)`. Size is based on `per2`% of the capital *not* used by the main grid (`1 - per1`).
`final entry`: At `maxPrice * (1 - final / 100)`. Size is based on the remaining capital (`1 - per2`% of the unused portion).
5. Visualization (`line.new`, `label.new`, `plot`, `plotshape`, `plotchar`):
Grid Lines & Labels:
When a position is open (`strategy.opentrades > 0`), horizontal lines and labels are drawn for each of the 11 grid order prices and the "final" entry price.
Lines extend from the bar where the *first* entry occurred.
Labels show the price and planned size for each level.
Dynamic Coloring: If the price drops below a grid level, the corresponding line turns green, and the label color changes, visually indicating that the level has been reached or filled.
Plotted Lines:
`maxPrice` (initial high point for the grid).
`strategy.position_avg_price` (current average entry price of the open position, shown in red).
Target Profit Price (`strategy.position_avg_price * (1 + tp / 100)`, shown in green).
Markers:
A flag marks the `startTime`.
A rocket icon (`🚀`) appears below the bar where the `final entry` triggers.
A stop icon (`🛑`) appears below the bar where the `semifinal entry` triggers.
6. Exit Logic (`strategy.exit`, `strategy.entry` with `qty=0`):
Main Take Profit (`Full Exit`):
Uses `strategy.entry('Full Exit', strategy.short, qty = 0, limit = target2)`. This places a limit order to close the entire position (`qty=0`) at the calculated take profit level (`target2 = avgPrice * (1 + tp / 100)`). Note: Using `strategy.entry` with `strategy.short` and `qty=0` is a way to close a long position, though `strategy.exit` is often clearer. This exit seems intended to apply whenever any part of the grid position is open.
First Order Trailing Stop (`1st order Full Exit`):
Conditional: Only active if `trail` input is true AND the *last* order filled was "Buy 1" (meaning only the very first grid level was entered).
Uses `strategy.exit` with `trail_points` and `trail_offset` based on ATR values to implement a trailing stop loss/profit mechanism for this specific scenario.
This trailing stop order is cancelled (`strategy.cancel`) if any subsequent grid orders ("Buy 2", etc.) are filled.
Final/Semifinal Take Profit (`final Full Exit`):
Conditional: Only active if more than 11 entries have occurred (meaning either the "semifinal" or "final" entry must have triggered).
Uses `strategy.exit` to place a limit order to close the entire position at the take profit level (`target3 = avgPrice * (1 + tp / 100)`).
7. Information Display (Tables & UI Label):
`statsTable` (Top Right):
A comprehensive table displaying grouped information:
Market Info (Entry Point, Current Price)
Position Info (Avg Price, Target Price, Unrealized PNL $, Unrealized PNL %, Position Size, Position Value)
Strategy Performance (Realized PNL $, Realized PNL %, Initial/Total Balance, MDD, APY, Daily Profit %)
Trade Statistics (Trade Count, Wins/Losses, Win Rate, Cumulative Profit)
`buyAvgTable` (Bottom Left):
* Shows the *theoretical* entry price and average position price if trades were filled sequentially up to each `buy` level (buy1 to buy10). It uses hardcoded percentage drops (`buyper`, `avgper`) based on the initial `maxPrice` and `coinRatios`, not the dynamically changing actual average price.
`uiLabel` (Floating Label on Last Bar):
Updates only on the most recent bar (`barstate.islast`).
Provides real-time context when a position is open: Size, Avg Price, Current Price, Open PNL ($ and %), estimated % drop needed for the *next* theoretical buy (based on `ui_gridStep` input), % rise needed to hit TP, and estimated USDT profit at TP.
Shows "No Position" and basic balance/trade info otherwise.
In Summary:
This is a sophisticated long-only grid trading strategy. It aims to:
1. Define an entry range based on recent lows (`maxPrice`).
2. Place 11 scaled-in limit buy orders within a percentage range below `maxPrice`.
3. Place two additional, larger buy orders at deeper percentage drops (`semifinal`, `final`).
4. Calculate the average entry price as orders fill.
5. Exit the entire position for a small take profit (`tp`) above the average entry price.
6. Offer a conditional ATR trailing stop if only the first order fills.
7. Provide extensive visual feedback through lines, labels, icons, and detailed information tables/UI elements.
Keep in mind that grid strategies can perform well in ranging or slowly trending markets but can incur significant drawdowns if the price trends strongly against the position without sufficient retracements to hit the take profit. The leverage (`lev`) input significantly amplifies both potential profits and losses.

SMT Divergences V2 [OutOfOptions]Smart Money Technique (SMT) Divergence is designed to identify discrepancies between correlated assets within the same timeframe. It occurs when two related assets exhibit opposing signals, such as one forming a higher low while the other forms a lower low. This technique is particularly useful for anticipating market shifts or reversals before they become evident through other Premium Discount (PD) Arrays.
This indicator works by identifying the highs and lows that have formed for an asset on the current chart and the correlated symbol defined in the settings. Once a pivot on either asset is formed, it checks if the pivot has taken liquidity as identified by the previous pivot in the same direction (i.e., a new high taking out a previous high). If this is the case and the corresponding asset has not taken a similar pivot, the condition is determined to be a potential valid divergence. The indicator will then filter out SMTs formed by adjacent candles, requiring at least one candle difference between the candles forming the SMT.
If the “Candle Direction Validation” setting is enabled, the indicator will further check both assets to ensure that for bullish SMTs, the last high on both assets was formed by down candle, and for bearish SMTs, the low was formed by an up candle. This check can often eliminate low-probability SMTs that are frequently broken.
The referenced chart shows divergence between Nasdaq (NQ) and S&P 500 (ES) futures, which are normally closely correlated assets that move in the same direction. The lines shown represent bullish and bearish divergences between the two when they are formed. As you can see from the chart, SMT Divergences may not always indicate a reversal, or a reversal might be just a short-term retrace. Therefore, SMT Divergences should not be used independently. However, in conjunction with other PD arrays, they can provide strong confirmation of a change in market direction.
Configurability:
Pivot strength - Indicates how many bars to the left/right of a high for pivot to be considered, recommended to keep at 1 for maximum detection speed
Candle Direction Validation - Additional SMT validation to filter out weak/low-probability SMTs be examining candle direction
Remove Broken SMTs - Keeps the chart clean by removing broken (invalidate) SMTs from the chart, once price moves beyond the outmost edge of the SMT
Work in Realtime - Enabled real-time mode for even faster detection of SMTs
Line Styling for Bullish/Bearish SMTs - Ability to customize line style, color & width for bullish/bearish SMTs
Label Control - Whether or not to show SMT label and if shown what font size & color should be used and if labels should include a tooltip containing information about the SMT
What makes this indicator different:
When used on NQ/ES it will automatically detect the matching the corresponding ticker, i.e. if you have chart on NQU2025 it'll automatically match to ESU2025 and vice-versa. Works for mini/micro/continuous contract
Unlike other SMT indicators, this indicator has an option to remove broken (no longer valid SMTs)
Allows real-time detection of SMTs prior to the pivot being fully formed
Allows validation of SMTs to only display high-probability SMTs, that are more likely to signal a possible reversal
Includes alerting capability for both SMT creation and when the SMT is broken (invalidated)

Multi-Timeframe SMTSummery
The Multi-Timeframe SMT indicator is designed to identify and visualize Higher Timeframe (HTF) data on a Lower Timeframe (LTF) chart, allowing traders to see the broader market context without changing their current chart's resolution. It accurately draws pivots and SMT divergences from higher timeframes on the corresponding candles of your current lower timeframe chart.
Its core features include:
Multi-Timeframe Analysis: Configure and monitor pivots on up to four independent timeframes, from intraday to monthly.
Customizable Pivot Detection: Define the strength of pivots by adjusting the number of bars to the left and right.
SMT Divergence: Automatically identifies bullish and bearish SMT divergences by comparing the price action of the main chart symbol with a chosen correlated asset.
Early SMT Detection: A unique feature that monitors a lower "detection timeframe" to provide early warnings of potential SMT setups before they're confirmed on the main timeframe. Note that this early detection is only shown on timeframes equal to or lower than the "Detection timeframe" you have set.
Visual Cues & Alerts: Clear on-chart labels, lines, and fully customizable alerts notify you of confirmed pivots and SMT divergences, ensuring you don't miss key opportunities.
Important Nuance Regarding Pivot Label Display
Due to a self-imposed limit within this script's drawing management logic, the indicator might quickly reach its drawing capacity if you enable pivot crosses for multiple timeframes simultaneously. When this internal drawing limit is exceeded, the script is designed to automatically remove the oldest drawings to make space for new ones.
Therefore, to ensure optimal performance and visibility of the most recent and relevant pivots, it's highly recommended to only enable the "Show Pivot Crosses" option for one timeframe at a time. If you wish to view pivots for a different timeframe, simply disable the pivot crosses for the currently active timeframe and then enable them for your desired one. This approach prevents the rapid cycling and disappearance of pivot labels, providing a clearer and more stable visual experience.
In-Depth Explanation of the Logic
This script is built on two primary concepts: pivot points and Smart Money Technique (SMT) divergence. It systematically collects historical data on multiple timeframes, identifies pivots, and then compares them between two assets to find divergences.
Pivot Point Identification
A pivot is a turning point in the market. A pivot high is a candle that has a higher high than the candles to its immediate left and right. Conversely, a pivot low is a candle with a lower low than its neighbors.
How it Works in the Script:
The script tracks the highest high and lowest low for each period of the selected timeframe (e.g., for each 4-hour candle). When a new high-timeframe candle closes, it stores that high/low value and its bar index in an array. The checkForPivot() function then checks if a recently stored high or low qualifies as a pivot.
Key Inputs:
Left Strength (leftBars1): The number of candles to the left that must have a lower high (for a pivot high) or higher low (for a pivot low).
Right Strength (rightBars1): The number of candles to the right that must meet the same criteria.
For example, with Left Strength and Right Strength both set to 3, a pivot high is only confirmed when its high is greater than the highs of the 3 previous high-timeframe candles and the 3 subsequent high-timeframe candles. Increasing these values will identify more significant, longer-term pivots.
Smart Money Technique (SMT) Divergence
SMT Divergence is a concept popularized by The Inner Circle Trader (ICT). It occurs when two closely correlated assets fail to move in sync. For instance, if Asset A makes a higher high but Asset B fails to do so and instead makes a lower high, this creates a bearish SMT divergence. It suggests that the "smart money" may not be supporting the move in Asset A, signaling a potential reversal.
Bearish SMT: Main asset makes a higher high, while the correlated asset makes a lower high. This is a potential sell signal.
Bullish SMT: Main asset makes a lower low, while the correlated asset makes a higher low. This is a potential buy signal.
How it Works in the Script:
Data Request: For each timeframe, the script uses the request.security() function to fetch the high and low data for both the main chart symbol (syminfo.tickerid) and the chosen Comparison Asset.
Pivot Comparison: When a new pivot is confirmed on the main asset, the script checks if a corresponding pivot also formed on the comparison asset at the same time.
Divergence Check: It then compares the direction of the pivots. For a bearish SMT, it checks if the main asset's new pivot high is higher than its previous pivot high, while the comparison asset's new pivot high is lower than its previous one. The logic is reversed for bullish SMT.
Visualization: If a divergence is found, the script draws a red (bearish) or green (bullish) line connecting the two pivots on your chart and places an "SMT" label.
Early SMT Detection
This is a proactive feature designed to give you a heads-up. Waiting for a 4-hour or daily pivot to form can take a long time. The early detection system looks for SMT divergences on a much smaller, user-defined Detection timeframe (e.g., 15-minute).
How it Works in the Script:
Awaiting Setup: After a primary pivot (Pivot A) is formed on the main timeframe (e.g., a Daily pivot high), the script begins monitoring.
Intraday Monitoring: It then watches the Detection timeframe (e.g., 15-minute) for smaller intraday pivots.
Potential Divergence: It looks for an intraday pivot that forms a divergence against the primary Pivot A.
Watchline & Alert: When this "potential" divergence occurs, the script draws a dashed white line and triggers a "Potential SMT" alert. This isn't a confirmed SMT on the main timeframe yet, but it's a powerful early warning that one may be forming.
Drawing & Object Management
To keep the chart clean and prevent performance issues, the script manages its drawings (lines and labels) efficiently. It stores them in arrays and uses a drawing limit to automatically delete the oldest drawings as new ones are created, ensuring your TradingView remains responsive.
How to Use the Indicator
Configuration
Enable Timeframes: Use the checkboxes (Enable Timeframe 1, Enable Timeframe 2, etc.) to activate the timeframes you want to monitor. It's often best to start with one or two to keep the chart clean.
Select Timeframes: Choose the higher timeframes you want to analyze (e.g., 240 for 4-hour, D for Daily, W for Weekly).
Set Pivot Strength: The default of 3 for Left/Right strength is a good starting point. Increase it to find more significant market structure points or decrease it for more frequent, shorter-term pivots.
Configure SMT:
Check Enable SMT for the timeframes where you want to detect divergence.
Enter a Comparison Asset . This is crucial. Ensure the assets are correlated.
To use the early warning system, check Enable early SMT detection and select an appropriate Detection timeframe (e.g., 15 or 60 minutes for a Daily analysis).

[Top] Trend Lines with Strength DetectionThe Auto Trend Lines with Strength Detection indicator automatically detects and draws dynamic support and resistance lines based on pivot highs and lows. These trend lines adapt to market structure in real time, increasing in opacity as they accumulate additional touches. Numbers are also printed above each line indicating the number of times that line has been tested and held.
Unlike most trend line indicators, this one does not consider a brief wick to have broken the line. Nor does it break the line if the current candle is testing it. The candle must fully close on the oppose side of a trend line for this indicator to remove that line.
On the chart above you can see that the current candle is in the process of breaking the two resistance lines. If the candle closes above the lines, they will be broken and removed from the chart. If it's not able to close above the resistance lines, they will remain intact and accumulate another touch point.
Key features include:
Pivot-based detection: Lines are drawn between valid swing points while filtering out intermediate price violations.
Strength visualization: Each time price comes into proximity with a trend line, the “touch count” is incremented and both the line and its label darken accordingly.
Break handling: Lines are automatically removed once the body of a candle closes beyond them, reducing clutter from broken levels.
Customization options: Users can adjust pivot sensitivity, maximum lines to retain, line styles, widths, and colors independently for support and resistance.
Pivot History: You can decide how far back you want the script to look for valid trends.
⸻
Potential Uses:
Identifying strong support/resistance zones: As trend lines accumulate touches, they become visually stronger, helping traders spot high-confluence levels.
Breakout and breakdown filtering: Detects and removes invalidated trend lines only after a full candle body breach, reducing false breakouts caused by wicks.
Trend structure analysis: Helps visualize emerging or weakening trends by observing how support/resistance lines evolve and how price interacts with them.
Strategy development: Can be used as a component in breakout, mean-reversion, or range-based trading systems.

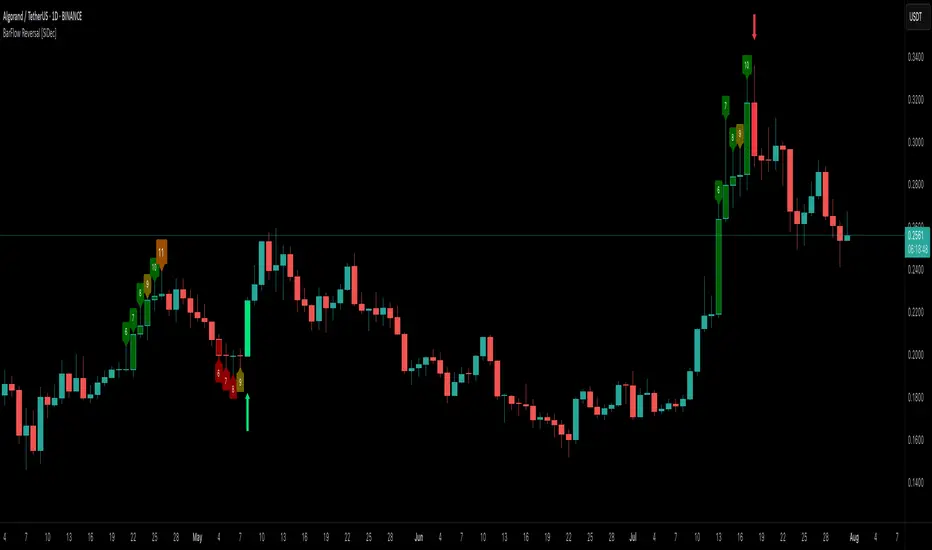
BarFlow Reversal [SiDec]BarFlow Reversal is a powerful indicator designed to help traders spot momentum exhaustion and potential turning points using consecutive candle streaks. It tracks up- and down-runs, highlights key exhaustion counts (like 9, 11, 13, 15), and provides clean visual signals alongside an optional multi-timeframe dashboard — giving you a powerful, customisable momentum map right on your chart.
Overview
Main Components
1. Run Counters
gCnt increments on up‑closes or dojis; rCnt increments on down‑closes or dojis.
seqCount is the larger of those two, and only streaks at or above your Min Consecutive
Special “strong” counts are emphasised with larger labels and unique colours.
2. Reversal Signals
➡️ An arrow plots when a streak of at least your Reversal Threshold is followed by:
A candle closing opposite the streak
Volume above a configurable multiple of its 25‑bar average
ATR expanding
➡️ Arrows come in three strengths (Weak, Strong, Max) based on the prior streak length and your predefined “strong” counts.
3. Bar Shading
Optionally tint each bar during an active run for instant visual feedback on trend direction and strength.
4. Multi‑Timeframe Dashboard
Displays current vs. previous run counts on 1H, 4H, 12H, Daily, Weekly, and Monthly.
Colour‑coded cells show direction and highlight special counts, so you can quickly assess broader momentum.
5. Clean Label Management
Automatically removes outdated streak labels to keep your chart uncluttered.
Labels are positioned just above or below bars and offset slightly to avoid overlap.
Inputs at a Glance
Appearance: Choose Classic, Mono, or Manual theme; set Dark/Light background.
Counting: Define minimum streak length, list of strong counts, and toggle bar shading.
Trend & Filters: Adjust volume multiplier, reversal threshold, and enable/disable arrow plotting.
Dashboard & Cleanup: Show or hide the multi‑timeframe table; auto‑clear old labels.
Colours: Fully customise run labels, special counts, arrows, and dashboard.
Important Trading Note
BarFlow Reversal is not a standalone indicator.
It’s designed to be used in combination with other confluence factors — such as key support/resistance levels, supply/demand zones, VWAP, Fibonacci, liquidity zones, or your preferred price action setups.
While BarFlow Reversal can help you identify moments of exhaustion or likely reversals, it does not provide full trade signals on its own.
Make sure to combine it with proper confirmation tools and risk management before entering trades.
Here are some example screenshots of this indicator in action:
Quick Start
Once you click “Add to favorites,” you’ll find BarFlow Reversal under Indicators for quick use on any chart.
Tweak inputs to match your trading style: set streak lengths, arrow sensitivity, and colour themes.
Watch as BarFlow Reversal highlights exhaustion points and reversal opportunities—across all your favorite timeframes.
If you find it helpful, feel free to leave a like or comment and let me know how you use BarFlow Reversal in your own trading!
Happy trading! 📈
Multi Pivot Point & Central Pivot Range - Nadeem Al-QahwiThis indicator combines four advanced trading modules into one flexible and easy-to-use script:
Traditional Pivot Points:
Calculates classic support and resistance levels (PP, R1–R5, S1–S5) based on previous session data. Ideal for identifying key turning points and mapping out the daily, weekly, or monthly structure.
Camarilla Levels:
Provides six upper and lower pivot levels (H1–H6, L1–L6) derived from volatility and closing price formulas. Especially effective for intraday reversal, mean reversion, and finding overbought/oversold extremes.
Central Pivot Range (CPR):
Plots the median, top, and bottom of the value area each session. CPR width instantly highlights whether the market is likely to trend (narrow CPR) or remain range-bound (wide CPR).
Developing CPR projects the evolving range for the current period—essential for real-time analysis and pre-market planning.
Dynamic Zone Levels (DZL):
Automatically detects and highlights clusters of pivots to reveal high-probability support/resistance zones, filtering out market “noise.”
DZL alerts notify you whenever price breaks or retests these key areas, making it easier to spot momentum trades and avoid false signals.
Key Features:
Multi-timeframe flexibility: Use with daily, weekly, monthly, yearly, or custom timeframes—even rare ones like biyearly and decennial.
Modular design: Activate or hide any system (Traditional, Camarilla, CPR, DZL) as you need.
Bilingual interface: Every setting and label is shown in both English and Arabic.
Full customization: Control visibility, color, style, and placement for every level and label.
Historical depth: Plot up to 5,000 pivot/zones back for deep analysis and backtesting.
Smart alerts: Get instant notifications on true S/R breakouts or retests (from DZL).
How to Use:
Trend Trading:
Watch for a very narrow CPR to identify potential trending days—trade in the breakout direction above/below the CPR.
Range Trading:
When CPR is wide, expect sideways movement. Fade reversals at R1/S1 or within the CPR boundaries.
Breakouts:
Use DZL alerts to capture momentum as price breaks or retests dynamic support/resistance zones.
Multi-Timeframe Confluence:
Combine CPR and pivot levels from multiple timeframes for higher-probability entries and exits.
All calculations and logic are fully open.

Liquidity Swings [Nix]Liquidity Swings Indicator!
It marks recent swing highs and lows on the chart using lines and labels.
Another great feature is that it tracks whether those swing levels are SWEPT (price crosses them again) and either:
Removes swept levels, or
Fades them to indicate they’ve been taken.
You can customize:
Number of swings shown.
Colors, styles, and visibility of lines/labels.
Whether to show highs, lows, or both.
Useful for liquidity analysis.
Usually when these special swings are swept, you can consider moving stops to BE. This is because there should be enough stop losses at the swing points to liquidate others and give more fuel to your trade direction!
