Parallel Pivot Lines [LuxAlgo]Displays lines connecting past pivot high/low points with each line having the slope of a linear regression. This slope can also be controlled by the user with the 'Slope' setting. Each line can be used as a support or resistance by the user.
Settings
Length : Pivot length. Use higher values for having lines connected to more significant pivots points.
Lookback : Number of lines connecting a pivot high/low to display, with a total of lines equal to Lookback*2
Slope : Allows the user to multiply the linear regression slope by a number within -1 and 1
Limitations
The script has currently several real time behavior limitations. Lines are displayed retrospectively and will not update with the arrival of new bars. Readjusting the indicator to newer pivots will require the user to either hide/unhide the indicator or change its settings.
High Length or Lookback values might not return any lines if the location of a pivot point is outside the defined buffer size of the indicator (set as 5000 bars).
How To Use
The indicator can be used to get supports and resistances and is more so closer to a drawing tool due to its limitations. The lines not updating with the arrival of new bars have the advantage of providing fixed supports/resistances.
The Slope setting allows the user to control the angle and direction of the lines. Using a Slope of 1 will return lines with the same slope as the one of a linear regression fit from the farthest pivot point displayed by the indicator to the most recent bar.
The chart above shows the indicators and a linear regression in orange.
If you want to have horizontal lines, use a Slope equal to 0.
Finally using a negative slope value will allow the user to have lines in opposite directions to the main trend.
Conclusion
We hope you like this indicator (drawing tool) and find it useful for drawing your support & resistances in a unique way!
Các điểm Pivot

VWAP Oscillator CandlesThe VWAP oscillator plots VWAP as the zero line with price, relative to VWAP. This can be use the same way you would traditionally use VWAP, with a much clearer picture of deviation from VWAP. Also, after creating the script, I noticed divergence was extremely noticeable here!

VWAP OscillatorI like a clean chart and trade primarily with price action alone, but the power of VWAP is undeniable, which is why VWAP is the basis of most of my scripts.
The VWAP oscillator plots VWAP as the zero line with exponential average price, relative to VWAP. This can be use the same way you would traditionally use VWAP, but after creating the script, I noticed divergence was also extremely noticeable here!

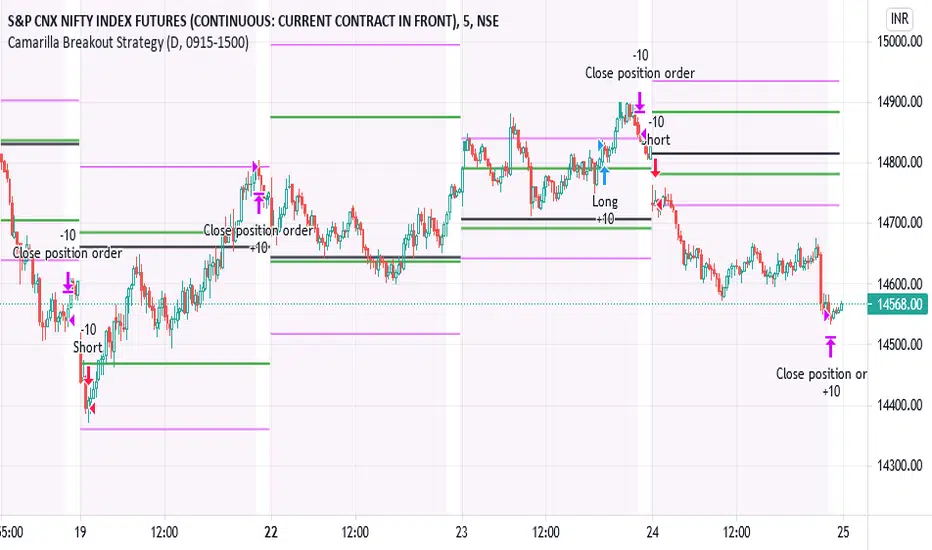
IPB_CamBOTSThis is an intraday strategy.
Camarilla Level 3 breakout strategy.
Conditions are long above Camarilla R3 only under certain circumstances related to the distance between Central Pivot and Level 3 pivots and also the location of the Opening price of the day.
Exit is assumed to be at the end of the day. It is suggested to exit the trade if price falls back below Camarilla R3 in case of longs.
Logic similar for shorts as well but on the other end.
Position Sizing :
10 lots of Nifty futures assumed for backtesting.
The margin required for 10 lots of Nifty futures is around 10-12 lacs. Hence 25,00,000 capital is assumed which is roughly double the margin required for taking positions in the real market. In other words not all capital is used if 10 lots of futures is traded. Brokerage assumed is 50 per order as against the 20 per order in real market with respect to retail brokers. Currency assumed is INR. However there is no option to choose INR and therefore you might see the currency as USD. Hence please assume the currency as INR.
Disclaimer:
Past performance does not reflect the future perfomance. Hence the author is not responsible for any trading loss arising out of this strategy. Please use at your own risk and responsibility.
High_Low level plots for yesterday, pre market , regular, and AHthis study will plot yesterdays, high and low price, pre market's high and low price, regular day's high and low price and post markets high and low price.

RBR/DBDThis script is used to identify market structures, specifically RBR (rally base rally) and DBD (drop base drop) structures.
A rally base rally structure indicates that the market has created a demand zone (can be interpreted as a support) while a drop base drop structure indicates that the market has created a supply zone (can be interpreted as resistance). While RBRs and DBDs can be found on literally any timeframe, like with anything chart-related, the lower the timeframe, the more noise and/or the weaker the sentiment. In other words, try to stick to longer timeframes such as 4H, 1D, 1W because anything lower, while may end up being valid, can have a relatively high probability of not being tradeable.
So how can you trade these market structures? Very simply to be quite honest. Once a demand or support zone is identified, simply wait for price to enter the zone and confirmation that the zone didn't break and enter either a long position or short position. Keep in mind that when a demand zone or support zone breaks, it can no longer be treated as a regular RBR/DBD; however, what's interesting is that you will find that even broken demand/support zones continue to be key levels.
Let's look at an example below:
A demand zone was found, as indicated by the "D" label as well as the blue shaded area.
In rectangle 1, price comes into the demand zone and holds around the 212 area. Price then proceeded to the 218 area in the following days.
In rectangle 2, price comes into demand again, and even though the wicks cross through the demand zone identified, the body does not break the zone. Price holds within the demand zone and then proceeds to :rocket: :rocket: :rocket:. Keep in mind though that the more demand zones are touched, the weaker that demand zone becomes. Same with supply zones.
In rectangle 3, price finally breaks through the demand zone and so this can no longer be treated as a regular RBR anymore; however, notice how price struggles to get back over the old RBR.
Currently, the script will show zones as a single zone that changes over time. For example, if a RBR is identified today and then another one identified the next day, you'll see how the blue shaded area will shift to only reflect the most recent. This does not mean that the RBR identified previously is not valid. It is on the to-do list to change this behavior so that each RBR is distinct and separate.
TO-DO:
Make each RBR/DBD separate and unique from each other
Option to remove broken demand and supply zones
More robust identification of RBR/DBD
Add alert conditions when a RBR/DBD is identified

Higher Order PivotsFirst order pivot points are defined as 3 or 5 bar "V" shaped patterns. For example a high with a lower high either side of the peak and in the case of the 5 bar variant with lower highs adjacent to a high below the peak.
Second order pivot points are defined by three first order pivots in the same manner. For example a peak pivot high with a lower pivot high to either side.
Third order pivots follow the same pattern, a peak second order pivot high with two adjacent second order pivot highs.
As it can take a significant and variable amount of time before higher order pivots are confirmed, it is generally inadvisable to use higher order pivots for live trading!
However they can be used for historical analysis. For example to delineate market structure of major market inflections.
For example :
Delineating market structure using 2nd order pivots derived from 3 bar, 1st order pivots
Major market inflections from 3rd order pivots derived from 5 bar, 1st order pivots

MasterChartsTrading Price Action Indicators-6.0These are upgraded MasterChartsTrading Price Action Indicators with future projections
---
How to understand price action.
It is very easy to read price action if you have a reference point. These support/resistance lines are there to help you read where the buyers and sellers are likely to make a stand.
You can also think of these indicators as moving pivot points .
MasterChartsTrading Price Action Indicators show good price levels to enter or exit a trade.
The Blue indicator line serves as a Bullish Trend setter.
If your instrument closes above the Blue line, we think about going Long (buying).
For commodities and Forex, when your trading instrument closes below the Red line, we think about Shorting (selling).
For Stocks, I prefer to use the Yellow line as my Bearish Trend setter (on Daily charts ). A stock has to close below the Yellow line first, then rally towards the Red line and top out there. This is where I would short it.

IPB_AOPM_BOThis is an intraday trading strategy.
Concept :
Underlying concept is that Amateurs open the market and Professionals close the market. Hence this system tries to capture the breakout in the afternoon session. After One PM Breakout (AOPM breakout). This essentially means that one has to go long once the high of the market till 1 pm is broken out and similarly go short once the low of the market till 1 pm is broken down.
Position sizing:
This strategy assumes taking 10 lots of Indian Market Index which approximately requires a margin of around INR 25,00,000. Hence capital is chosen as INR 25,00,000. Currency is assumed to be INR , however the system shows USD as currency as there is no INR option available. Commissions assumed to be at INR 50 per order as against the INR 20 per charged by retail brokers in India in real world market.
Disclaimer:
Past performance is not representative of future performance. Hence the author is not responsible for any trading loss arising out of implementing this strategy. Hence please implement at your own risk. Trading can result in loss of entire capital.

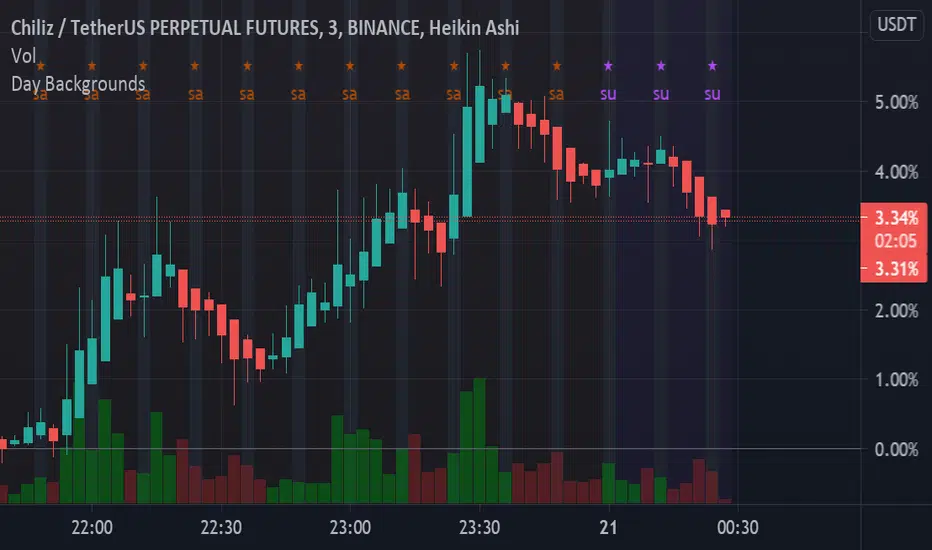
Days Colorized (31 day / weekdays / weekends)Very Simple study script to colorize every day of the month a unique color, with stripes on Saturday and Sunday, and small text at the top to note the current day of the week. Currently set to GMT-7, feel free to change it to your own time zone. Thanks to all the pine coders out there for the inspiration and massive thanks to the open-source community for all the things I learn from playing with your scripts.
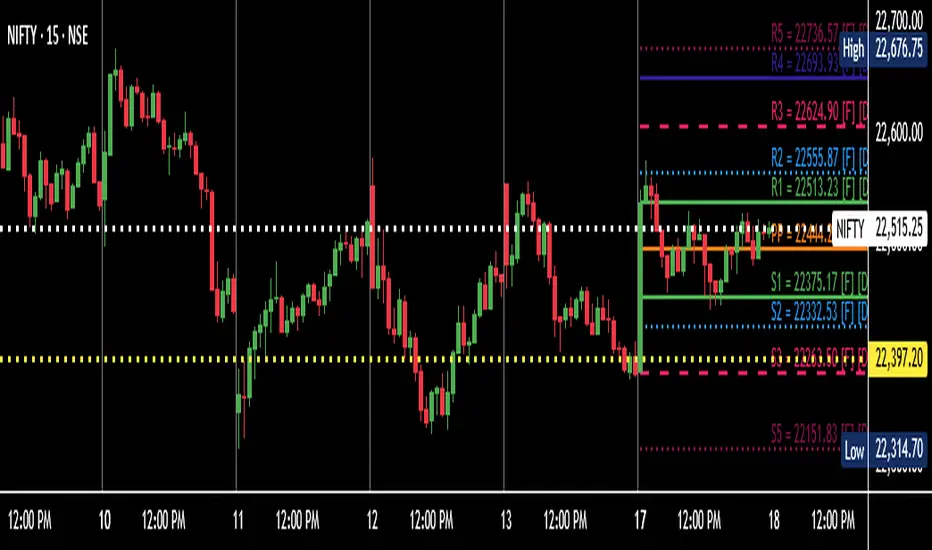
Daily Pivot (Fibonacci)Hello All
-
This is Daily Pivot (Fibonacci).
Simple and very useful tool for traders.
Show R5 to S5 levels.
.
Feel free to comment.
Thank you.
[SK] Fibonacci Auto Trend ScouterThe FATS - Fibonacci Auto Trend Scouter automatically draws active trends from 2 different timeframes along with Fibonacci Support and Resistance levels. It also has a Sights feature for each timeframe which points from it's middle towards the current price. The tool is also highly customizable for you to take this indicator over 9000. If you like the tool and it adds value to you - share the love on the like button and visit my profile to check out my other indicators and subscribe, so you're notified of my next scripts and ideas!
Automatic Trend Lines
The indicator takes in 2 timeframes to detect High and Low values from which to draw the trend lines of each timeframe.
As the values change with price movement, the lines are updated. They are color coded for uptrend and downtrend based on the direction of each individual line. Trend lines can be set up to color with only the default value on the configurations panel.
- Toggle on/off Color Coded
- Change Default, Uptrend, Downtrend color
- Change Line Width
- Change Line Style
- Toggle on/off Line Extensions
- Change Extended Line Width
- Change Extended Line Style
- Toggle On/Off labels for 7 data points of each timeframe
Automatic Trend Sights
This is a neat feature that may help you get a better feel for the direction the current movement is heading towards in correlation with the short or medium length timeframe trends. The sight draws a line from the middle vertical point of the trend coordinates towards the current price. They are toggled off by default but can be enabled in the configurations panel.
- Toggle on/off sight on each timeframe
- Change Width
- Change Line Style
Automatic Fibonacci Levels
The tool has a very useful feature to automatically detect the highest and lowest value from the short timeframe to calculate Fibonacci support and resistant levels. To keep the chart area clean, the lines are drawn short by default towards the right side of the price but provide inputs to increase the size of the level lines towards the left and right direction. A triangle label appears to the side of each line which holds the Fibonacci level and price data inside the tooltip, hover over them to activate.
- Toggle on/off color coded
- Change Default, Resistance, Support colors
- Change line size towards the left and right side
- Change line width
- Change Resistance line style
- Change Support line style
- Toggle on/off High and Low source line
- Toggle on/off High and Low source labels

Example - HTF Values Without 'Security()'This is an example of how to reference higher timeframe data without the
need for a 'security()' call.
I have attempted to create the function example:
f_insecurity()
with the purpose of wrapping up and pumping out all common relevent HTF
price data that's needed for your everyday indicators in a reliable fashion.

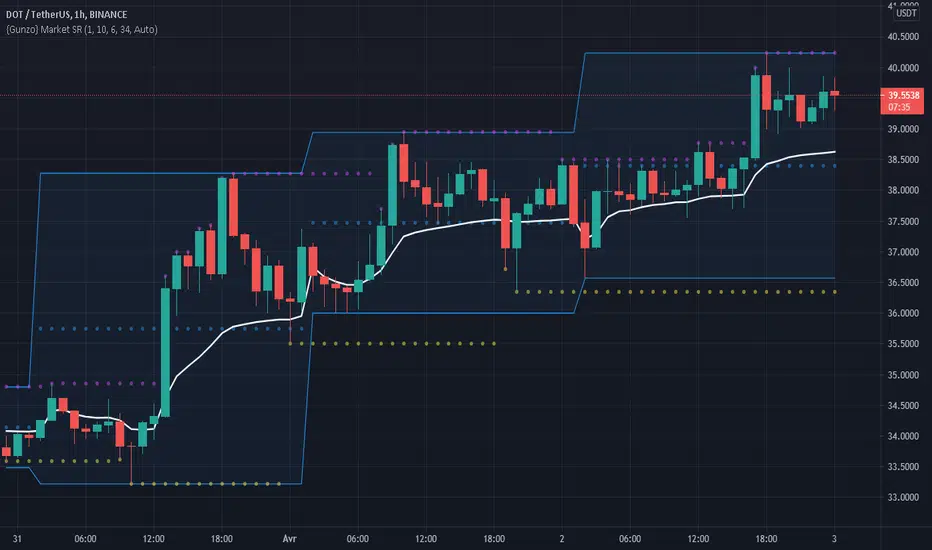
Gunzo Market SRGunzo Market SR is a set of 3 tools combined for trend analysis on day trading strategy.
VWAP (Volume Weighted Average Price) :
The VWAP indicator is generally used for trend analysis. For example if the VWAP line is under the closing price for a long period of time, the trend is strong. In this script, the VWAP has been optimized for day trading as the indicator is calculated inside the daily range, and resets when a new day starts. This way the indicator reflects the daily trend and not the overall trend. You can also use the position of closing price according to the VWAP to find optimal entry points according to the indicator.
Highs / Lows :
The Highs / Lows are generally used for trend analysis too. The High / Lows are mainly used to identify prices that have been key during the past and that we can use as an indication for the following candles. In this script, the Highs / Lows are computed on the daily period and then displayed on the current period (recommended to use on a daily period or lower). This way the indicator reflects the highest point and the lowest point of the day (can be modified to have a longer range of pivot days even if I recommend to stay on 1 day for day trading).
Support / Resistance :
The Support / Resistance is generally used for trend analysis too. The Support / Resistance are found by searching local high and lows. The longer the supports and resistance are, the strongest it can be considered. In this script, the Highs / Lows are computed by default on a lower time frame (usually 3-4 times lower). For example on a 15 minute graph, the Highs / Lows will be computed on the 5 minute graph (can be modified if the displayed result is not optimized for your asset).
How to use this set of tools :
I personally recommend to use this tool at the start of your day of trading. This way you will get a clear vision of the daily situation and try to identify key prices and the trend for the current day. I then suggest to set up an alert on the key price to be notified when you're getting close to it.
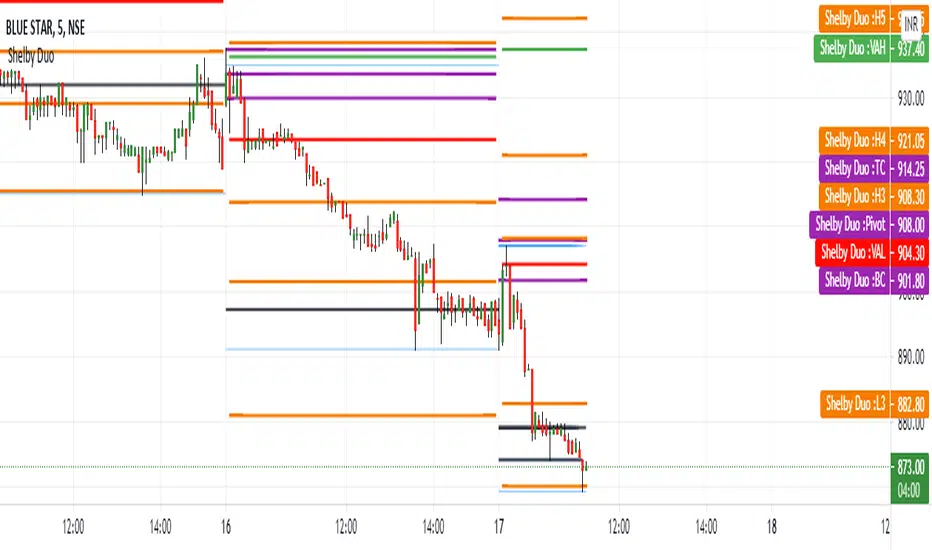
Shelby Duo Shelby Duo indicator is a combination of the following:
1. Central Pivot Range
2. Floor Pivots
3. Camarilla Pivots
4. Volume Point Of Contact
5. Value Area High and Value Area Low
All the pivot calculations are based on Secret of Pivot Boss book by Frank Ochoa .
One can also view tomorrow's central pivot range by today end of the day.
How to use it:
The Golden Pivot Zone is the method given by Frank Ochoa in his book "The Secret of Pivot Boss"
Here, he discusses its types and how to use them efficiently.
There are two types of GPZ,
1.) BEARISH GPZ
2.) BULLISH GPZ
BEARISH GPZ:
A bearish GPZ occurs when H3 of the Camarilla Equation, or any of the Money Zone levels, is mixed within the central pivot range. Therefore, a GPZ is present if any of the following pivots falls within the boundaries of the central pivot range:H3, VAL, VAH, POC, or VPOC. Any bullish advance that fails at the GPZ typically leads to a drop back toward the next area of pivot support, which is generally S1 or L3.
BULLISH GPZ:
A bullish GPZ occurs when L3 of the Camarilla Equation, or any of the Money Zone levels, is mixed within the central pivot range. Therefore, a GPZ is present if any of the following pivots falls within the boundaries of the central pivot range: L3, VAL, VAH, POC, or VPOC. A sell-off or pullback to a bullish GPZ generally leads to an advance back toward the next area of pivot resistance, which is usually R1 or H3.
Entry and Exit Conditions:
BEARISH GPZ: Entry can be taken when it touches the zone. Exit can be done when the price reaches PDL/L3.
BULLISH GPZ: Entry can be taken when it touches the zone. Exit can be done when the price reaches PDH/H3.
Strongholds - Objective & Accurate Reference Points / StructuresVery early in my trading career, I came across Pivot Points only to find out that there are as many calculations as one pleases. It was hard to find out which ones work. Most of them probably did only out of randomness, so I ditched the strategy and looked for something else.
I previously used my Oracle Eye and Reference Points scripts but it is time for an upgrade.
Stronghold is a script I have used for quite some time now. I ditched daily and weekly closing prices as not that important. Instead, Strongholds are equipped with:
►Daily High & Low • Azure color
►Weekly High & Low • Dark blue
►Weekly old High & Low • Semi-transparent dark circles
►Monthly High & Low • Wizardly purple
There is an option to print:
►4h High & Low • Semi-transparent red
►VWAP • Lovely purple
►Weekly VWAP • Black
All of the levels and lines are set for 1m, 5m, 10m, 15m, 30m, 1h, 4h, 1D timeframes. If you use any alien timeframe, you may need to enter the code.
You can opt-in and out for certain timeframes. For example, daily levels are visible from 15m or 30, so the indicator won't draw them unless you want to. However, they will not be seen on higher timeframes as there is no reason to show them and oversaturate the chart with lines.
▬▬▬▬▬▬▬▬▬▬▬▬▬▬▬▬▬▬▬▬▬▬
Remember that if you use this script with auto-scale, you need to tick Scale Price Chart Only . Otherwise, your chart will fly to the moon!
Good luck & have fun!

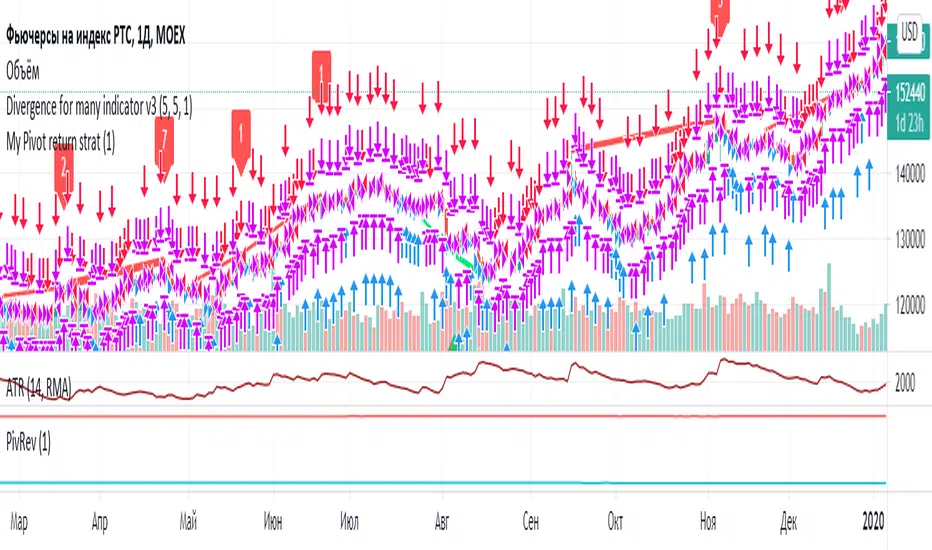
Pivot reverseВозвраты к средней пивот по фьючам по статистике с конца 2011 года:
Ri 72% возвращаются к зеленому в первый день, 14% еще в течение следующих трех;
Si 69% и 14%;
Br 72% и 14%
Gd 73% и 13%.
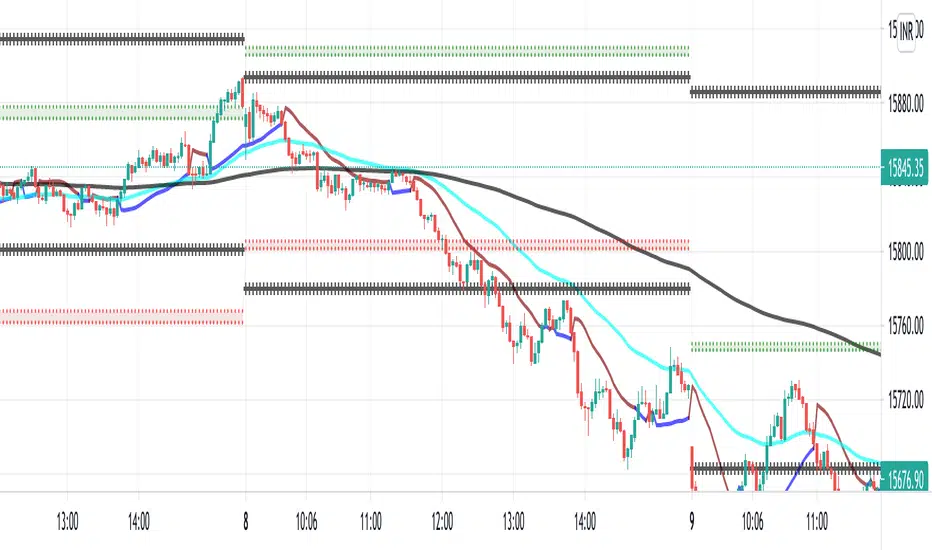
Phát Support and resistant This indicator provides basicSupport and Resistance Levels to the user whilst displaying Break signal tags. It also has the ability to let the user display more significant breaks
Only more significant breaks of these basic levels are displayed to the user when optimized which avoids noise and messy signals.
It will also display breaks with candles it deems to be bullish (e.g. having a longer upper or lower wick).
Notation
The notation of "Buy/Sell" denotes a break of either a Support or Resistance level with a volume greater than the threshold.
The notation of "Buy breakout/sellbrekout" denotes a bullish or bearish candle on the break.
Usage & Details:
Knowing when S/R level is broken with significance can be of great help to a trader. Many times significant levels may not be broken with significant force and the move is therefore weaker and possibly not worth trading.
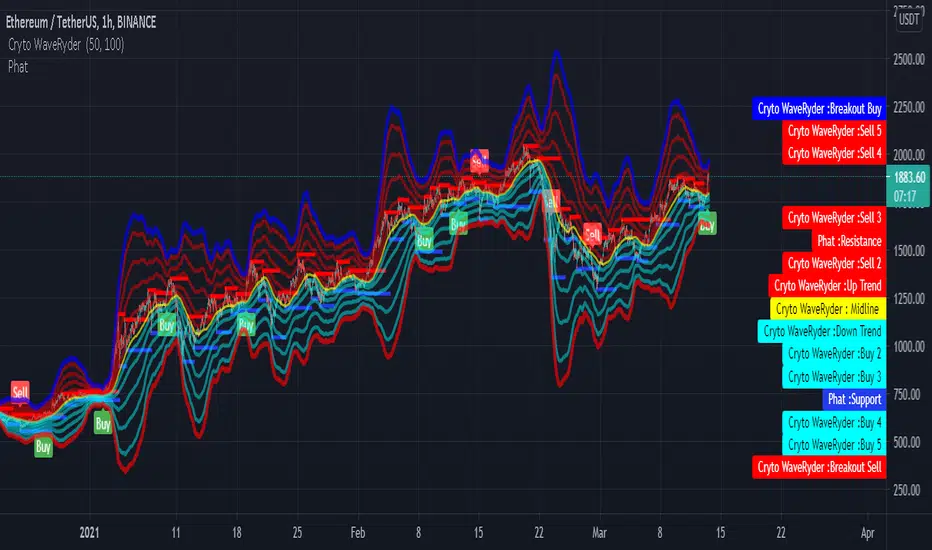
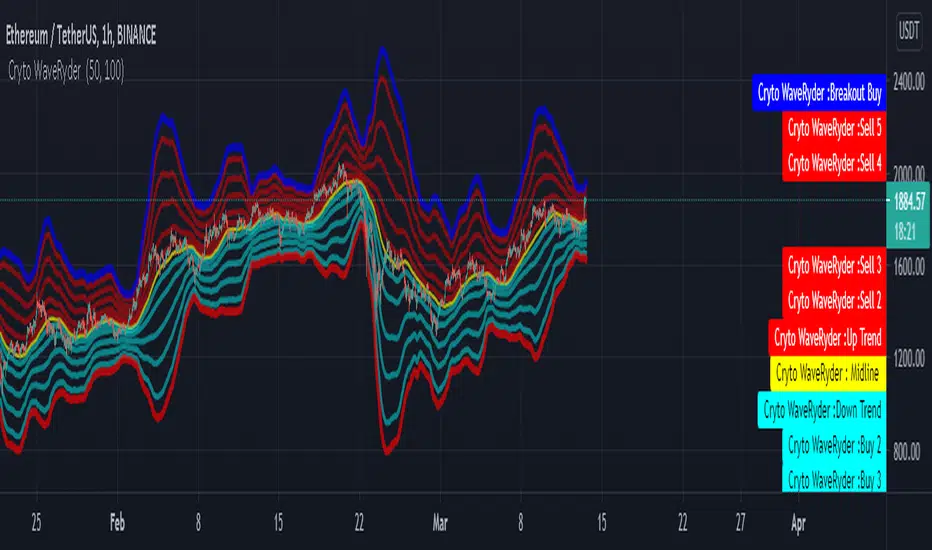
Cryto WaveRyder ------ Phat Cryto WaveRyder are envelopes plotted at a standard deviation level above and below a simple moving average of the price. ... Cryto WaveRyder helps determine whether prices are high or low on a relative basis. They are used in pairs, both upper and lower bands and in conjunction with a moving averange.
I create a lot of Buy/Sell entry, therefore tranders can know where it is the best entry to take the place. Let's make some money with this indicator
Whole NumbersThis is a simple indicator for the whole numbers.
It breaks down every pair for 10 pips.
Its also simple and nice to use

RR 2
Software signal with Trend of the market/Central Pivot Range combined with RR1 for better results.

RR 1
Software signal with Pivots/Previous day high/Previous day low combined with RR2 for better results.
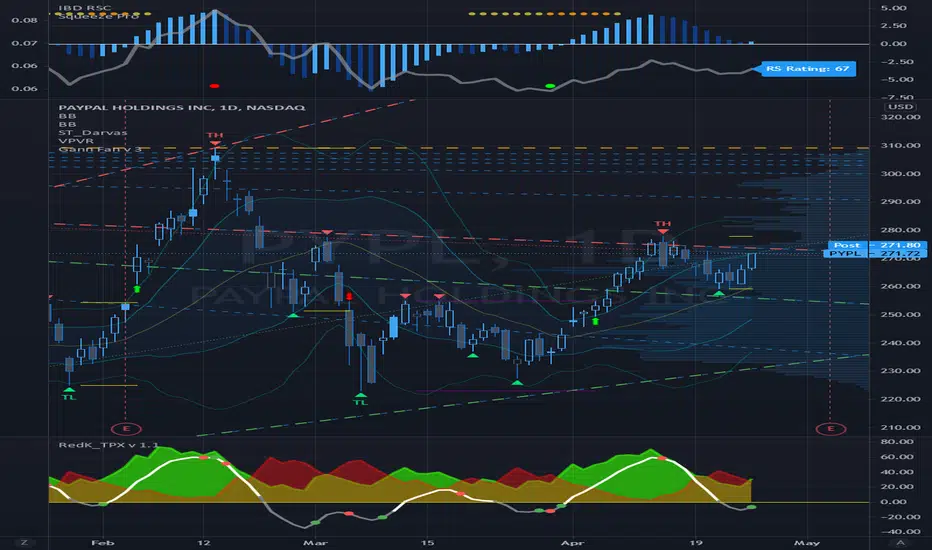
Gann Fan Analysis v 3.0The openness of this community is amazing and I have gained a lot from being a member. Hopefully you think this is useful so I can give something back.
This indicator constructs a reference framework of Support and Resistance levels based on Gann Fan ratios. Two fans are created: Support or Bullish fan, and a Resistance or Bearish fan. The origin of the analysis is the lowest pivot in the analysis window set by the length input. The upper bound of the analysis is the highest pivot in the analysis window. This is the only user input that affects the fan calculation. The remaining user input controls the visualization of the fans. The fan calculations are updated as the high and low within the analysis window change. The resistance fan range is based on an assumed 70% retracement.
Indicator also highlights the active Support and Resistance lines of each fan. An alert is also included, based on the price crossing one of these active levels.
Currently I can't figure out how to get the analysis to extend beyond 278 or so bars (not sure what the limitation is) so it isn't really useful for intraday timeframes, but it is reliable on daily and above. I use it on a Weekly view with the analysis length set to 52, and on a daily timeframe with the length set to 260.
I included fractal visualization using Ricardo Santos' Fractals v9 script as a means of confirming the Gann Fan pivots. The two methods seems to correlate well, in my opinion.
The coding is terrible, I'm sure, so please overlook that as this my first complex effort. I'm a total amateur!