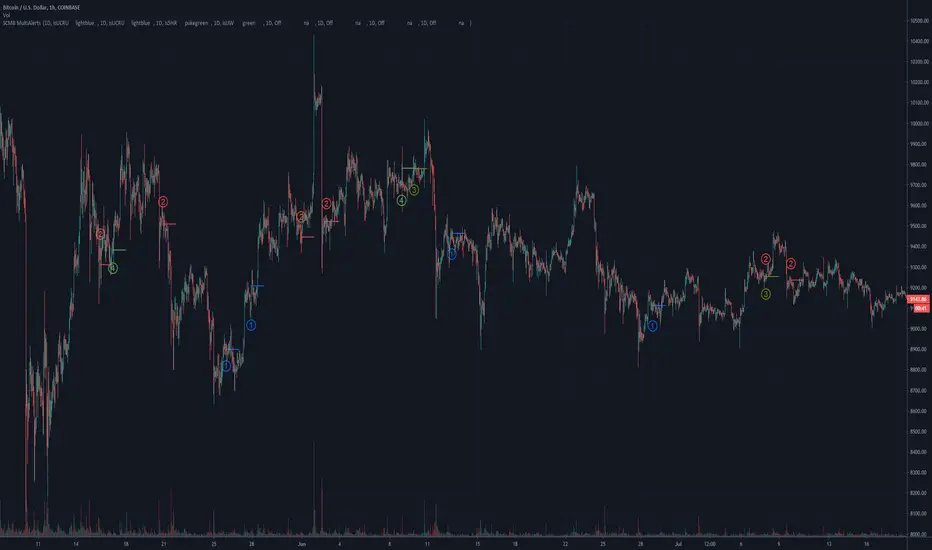
Double Top Double Bottom [MS]Automatic Double Top and Double Bottom pattern scanner for any time frame, any asset.
Simple to use, just add to your chart, and set the size (in the settings) for the patterns you want to find.
• Green patterns are bullish
• Red patterns are bearish
• Alerts are available for when new patterns are displayed
• When a pattern completes (at the neckline), it will change from dotted lines to solid lines.
To scan for multiple sizes of patterns, add the script to your chart multiple times.
Use the link below or PM us to obtain access to this indicator.
Các điểm Pivot

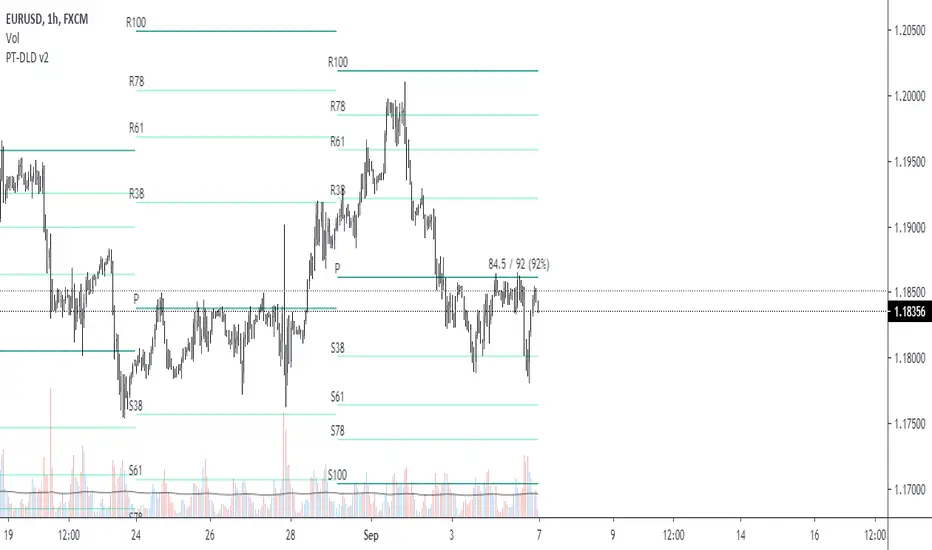
Pivot Fibonacci TradingWe use fibonacci in many things, why not the Pivot? Hey, it does works, price does reacts to the fibonacci off the pivot.
Pivots are road map for the price, fibonacci are just some stops or gas stations appear on the road, with these additional lines, there's more time for price to think about which way it'd move, therefore, more time for us traders to track and follow.
I know they usually use Daily pivot in H1, Weekly in H4 and Monthly in Daily timeframe, but since there are more lines now, price now needs space to travel between line. I recommend using Weekly Pivot for intraday(H1,...), Monthly for H4 and Yearly for Daily.
I also add some text that shows current day's range in pips (High - Low = range) and compare it to Average Daily Range. I thinks this is helpful if you use it for day trading.
I'll let this as a open sources as you may find something to customize in your own way.
Hope this helps you in someway, community :)
Happy trading!
#Thanks to @Davit on forexfactory for the idea
Trend Following with Moving AveragesHello Traders,
With the info "Trend is Your Friend ", you should not take position against the trend. This script checks multipte moving averages if they are above/below the closing price and try to find trend. The moving averages with the length 8, 13, 21, 34, 55, 89, 144, 233, 377 used. these are fibonacci numbers, but optionally you can change the lengths of each moving averages. while it's green you better take long positions, while it's red you better take short positions according to other indcators or tools.
Optionally you have "smoothing" option to get rid of whipsaws. it's enabled by default.
You have option to use following moving average types: EMA, SMA, RMA, WMA, VWMA. by default it's EMA
Also the script has "Resolution" option. with this option you can get the trend for other time frames, in following example 1h was set as for higher time frame on 15m chart:
This should not be used as buy/sell signal indicators as it's tries to find trend but not entry points, you should use other indicators (such RSI, Momentum) or other tools to find buy/sell signals.
Enjoy!

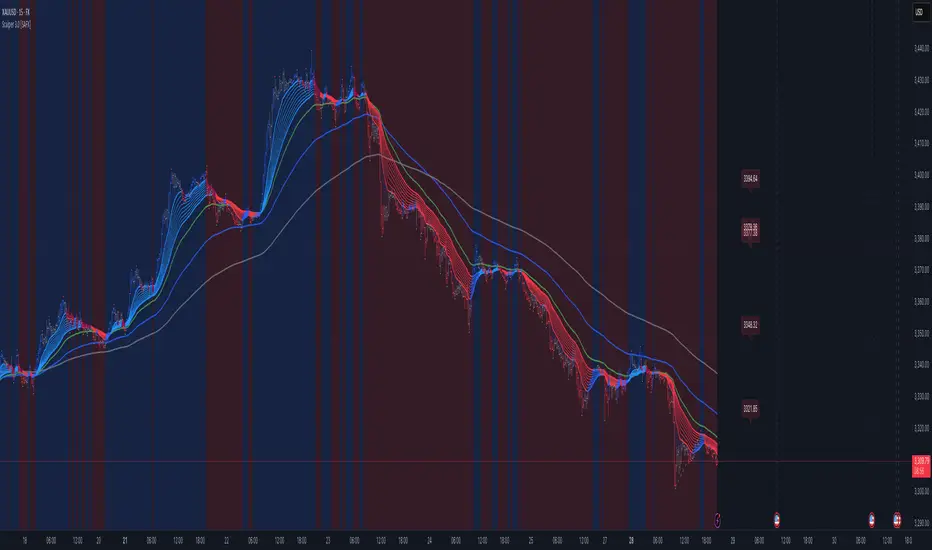
Scalper [SystemAlpha]This is a scalping tool designed for a two pane chart layout.
Includes:
- EMAs
- Price Action Channel
- Bar Color based on PAC, Impulse and TTM
- Pivot HL - Price, Shape, Text
- Pivot Extensions
- Dynamic Support Resistance
Reference:
- Scalping Swing Trading Tool R1-4 by JustUncle
- Support Resistance - Dynamic by LonesomeTheBlue
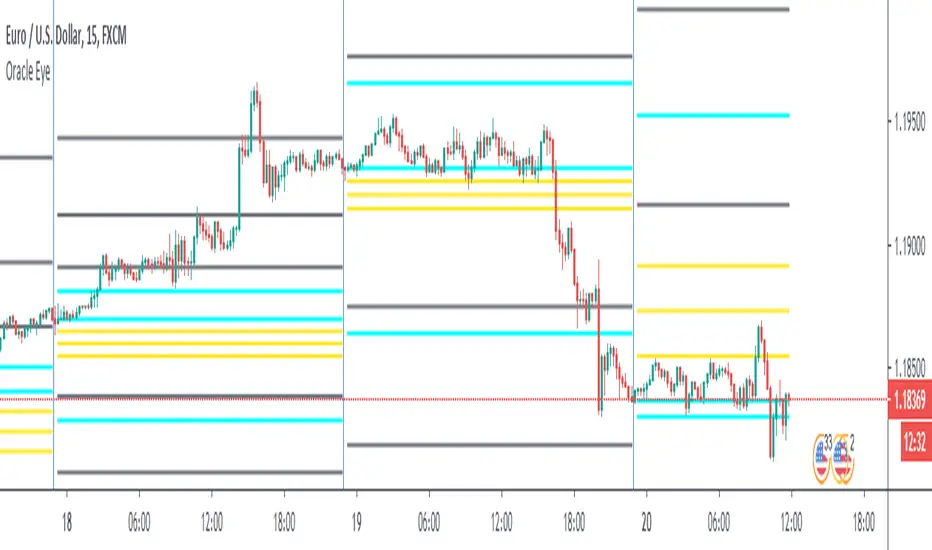
SessionsThis is an advanced level sessions indicator.
Not so much an indicator, more of an auto way of plotting levels rather than drawing levels by hand every day.
It maps out the London and New York Sessions.
It also maps out the closing time and price for future reference.
Daily high and low of the past few days are laid out.
Each setting can be turned on and off in the settings if you don't require that session info.
The time settings are setup according to NY time. It should work straight without any modifications.
If you are a price action trader using sessions, this indicator will help you track price movement between sessions and give you possible support and resistance levels based on the previous session close.
This indicator does require allot of sessions based trading knowledge but if you understand it, it can be of major use to you.
Best used on GBP and USD currency pairs
Best timeframes 5Min - 1Hour
Best trading style would be day trading

Globex RangesGlobexRanges. How the market moves over night helps determine what the market may do the next day. In this indicator I have used fib levels as well as the globex range levels.

FTU Pivot Scalper Strategy By Ganesh This indicator is suited for intraday trader or swing trader or scalper and BTST trader AND BIG THING IS FOR TECHNOFUNDA INVESTOR
time frame to use: best suitable time frame is 5min and 15 min if ur swing trader then use hourly
intraday rule: buy when arrow suggested with buy with SL below trailing super trend
BTST rule: buy when arrow triggered buy or sell after 3:15 with sl of some tick high above trailing super trend
TECHNOFUNDA investor: buy fundamentally good script check weekly charts buy when weekly close arrow suggest buying with sl of weeks low hold till trailing sl not hit

Fibonacci and Pivot Point ,vwap and Average to Determine Trend Script has Current day Pivot Point with Central Pivot Range,vwap and Average to Determine Trend , and a day Back Projection of Fibonacci.
Its Very easy to see the Support and Resistance and even can set your Target based on that ..
i will clean it more after that and Update same ..
Thank You
If any one has any Modification to do its Code is open to Use.

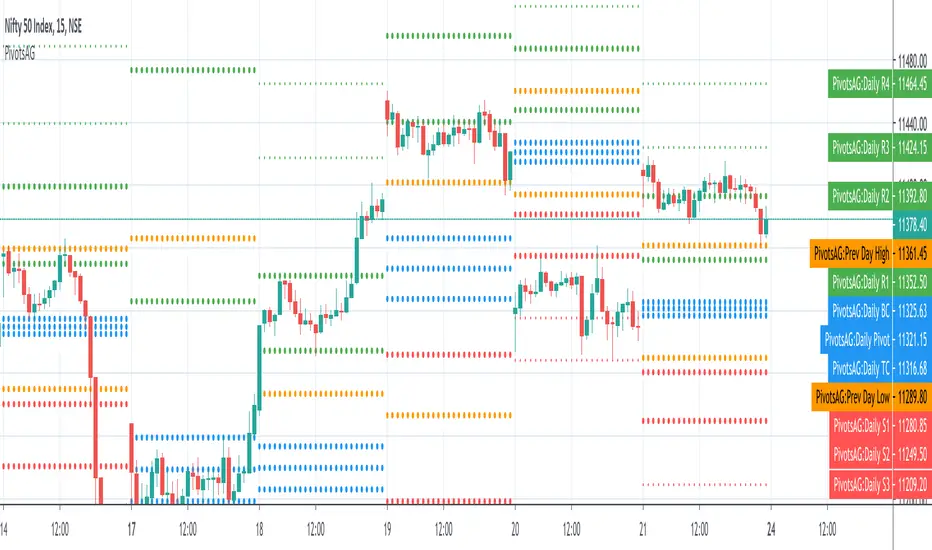
PivotsAGThis is a one in all Pivot based indicator - this includes Central Pivot Range(CPR), Camarilla Pivot and Previous Day High/Low combination that I learnt recently. By default, it show only the CPR however other options can be turned display on from the settings.
Appreciate any feedback on this. Thanks for viewing/trying.

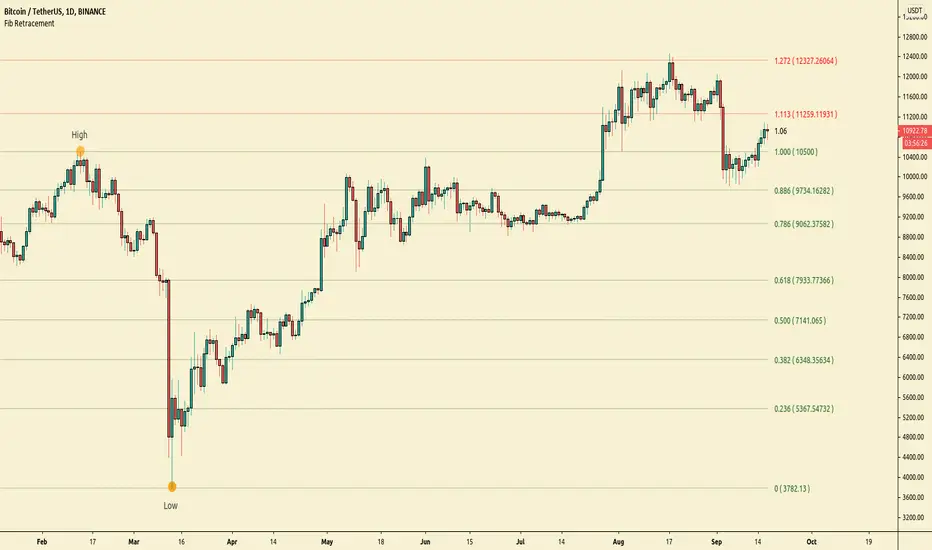
Simple Fibonacci RetracementSimple Fibonacci Retracement is a free and easy to use script to plot Fibonacci levels, for any assets like Stocks, Forex, Commodities , Cryptocurrencies etc. on any time frame chart.
Fibonacci Levels can be plotted using Lookback or manual Price input from the settings.
1. Lookback type - Candles
Determines the High and Low price of the user input number of Candles back (100 default) and plots Fibonacci Levels based on the calculated High and Low for the number of candles in the past from the current candle. The levels stay intact on any time frame as long as no new Highs or Lows are formed.
2. Lookback type - Days
Determines the High and Low price of the user input number of Days back (100 default) and plots Fibonacci Levels based on the calculated High and Low for the number of days in the past from the day of the current bar. The levels stay intact on any time frame as long as no new Highs or Lows are formed.
3. Manual Price Input
Plots Fibonacci Levels based on the user specified High and Low Price in the settings input fields. The levels stay intact on any time frame irrespective of new Highs or Lows being formed. Manual Price Input will enable the trader to keep the Levels intact and visually see the higher Fibonacci Retracement levels, when the price crosses beyond 100% retracement. On the other two lookback types, the Fibonacci levels are displayed only upto 100% retracement.
The Fibonacci levels can also be reversed by enabling 'Reverse' option from the settings.
Daily Reference Points for Intra-hour ChartsI worked with pivot script which I believe was created by @HPotter but somehow, I can't look it up.
This script fixes one issue I have with several pivot points script I had honour to see. When the new day starts, sometimes, there is a line connecting old pivot points and new ones. I managed to remove it.
Compared to the script I worked with, I converted the code from v.1 to v.4, added middle pivots and added previous day's close, high and low which are superior levels compared to any pivot calculation.
This script will show only on the 1m, 5m, 15m and 30m charts, so you don't need to turn it off when you check higher timeframe for macroanalysis.
PAI band (PP & ATR & IV)3つの抵抗帯
○インプライド・ボラティリティ
○アベレージ・トゥルー・レンジ
○ピボットポイント
を利用して、日単位・週単位で価格が到達するであろう境界線を表示します。
中途半端な価格帯での狼狽売買を避けて、優位性が期待できる値位置でエントリー・エグジットを検討できます。
価格がPAI bandに到達した時に、あなたが愛用している他のテクニカルのサインと合わせて使うのもいいでしょう。
3 resistance bands
○ Implied volatility
○ Average True Range
○ Pivot point
Use to display the boundaries that the price will reach on a daily/weekly basis.
You can consider entry/exit at a value position where you can expect superiority, avoiding discouragement in the half price range.
When the price reaches the PAI band, you can use it along with other technical signatures that you love.

Daily Pivot Alarmdefault Pivot
green line is the pivot Point, orange the daily open price.
You can use plots for alarm.

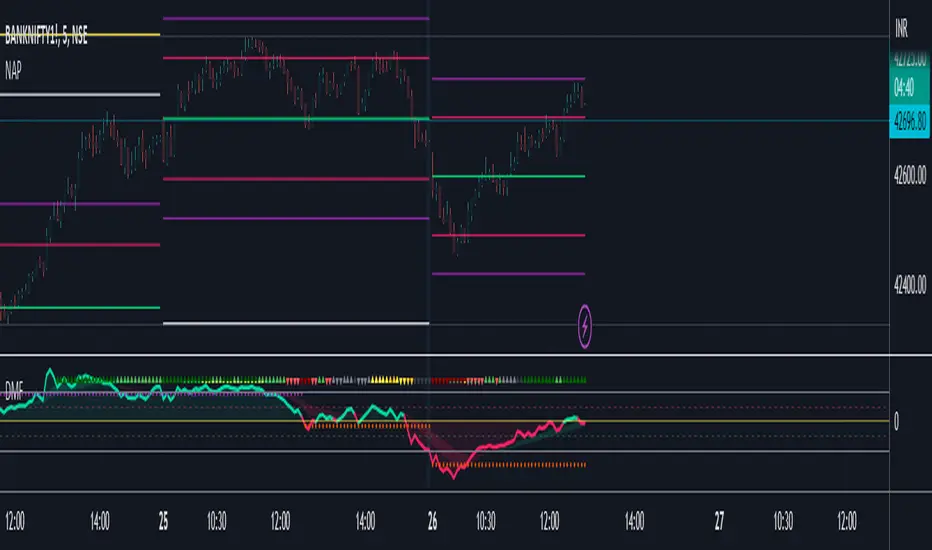
Price Action Movements by RPThis is the Indicator which will enhance finding Buying and Selling opportunity on any market.
Mostly suited for day Trading and some indicator can be used for signalling stock on longer time frame.
Indicators used to create this strategy is as follows:
- Exponential Moving Average (EMA)
- Supertrend
- Volume Weighted Average Price (VWAP)
- Exponential Moving Average of Volume Weighted Average Price (MVWAP)
- Previous Day Volume Weighted Average Price (PVWAP)
- Previous Day High, Low and Close (PDH, PDL, PDC)
- And Current Day Support and Resistance points based on Previous day Price Movement.
This will indicate where to buy and Sell with Indicator based on Following criteria,
Buy Signal given,
- When Close is above Exponential Moving Average 9
- When Close is above Exponential Moving Average 21
- RSI above 55
- Supertrend is positive
- Volume is above 300 moving Average
- Close is above Volume Weighted Average Price
Sell Signal given,
- When Close is below Exponential Moving Average 9
- When Close is below Exponential Moving Average 21
- RSI below 45
- Supertrend is negative
- Volume is above 300 moving Average
- Close is below Volume Weighted Average Price
Trades can use this Study according to their need of the Indicator.
Users can Tick the indicator which they want to add on Charts to study.
Only Exponential Moving Average indicator can be used.
Only Supertrend can be used.
Volume Weighted Average Price, Previous Day Volume Weighted Average Price, Exponential Moving Average of Volume Weighted Average Price and Previous Day High, Low and Close can be used as a particular study.
Support and Resistance can be used along with Previous Day High and Previous Day Low as a particular study.
This is multipurpose Study which will help Trading Society immensely.
Thank You.


Pivot point labelThis script provides the user with a label containing the high and low pivot points from a period defined by the user.

Auto S/R With Swing TradingIn this indicator, you can simply get the automatic support and resistance line.
With this indication of High and Low by H and L with blue line support and resistance.
The second part is the swing trading setup.
Green line means the upside continue with BUY signal.
Yellow Line means a Trend reversal No Trading Zone & wait for the signal.
Red line indicates that the downside continues with the SELL signal.

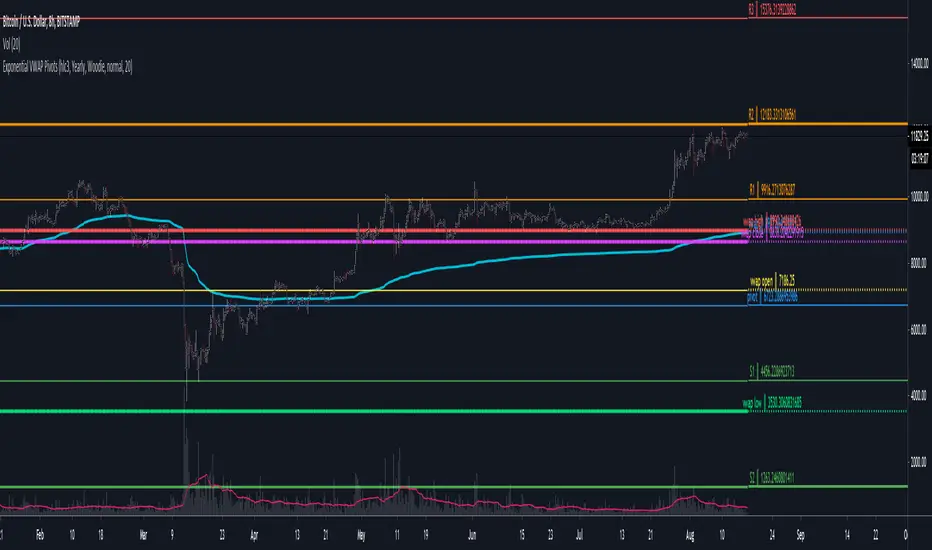
Rolling Traditional Pivot Points [QuantNomad]Standard Traditional Pivot Points are calculated from the previous day (or another period) close/low/high. But what is the day close for cryptocurrencies trading 24/7 on exchange? Does it make sense to use a specific time price as a close if it continue trading after that?
So I decided to solve that issue with Rolling Traditional Pivot Points where I calculate pivot points not at the end of the period but for every bar. Every time recalculating pivot points I look at a window of period length in bars and base my calculations on these bars. This way you get smooth pivot points changing with every bar and it seems like levels might be really nice support and resistance for the price.
I implemented 6 periods: Auto, Day, Week, Month, Quarter, Year. For the Auto period, I select the most suitable period for the timeframe of your chart.
On the chart, you can see by default up to 11 levels plotted
PP – Pivot Point
S1, S2, S3, S4, S5 - Support Levels
R1, R2, R3, R4, R5 - Resistance Levels
####################
Disclaimer
Please remember that past performance may not be indicative of future results.
Due to various factors, including changing market conditions, the strategy may no longer perform as good as in historical backtesting.
This post and the script don’t provide any financial advice.
####################
It's a pro indicator, you can have access to it for a small fee.
To request access to this indicator - follow the "Pro Indicators" link in my signature on PM me.

Fibs, Pivots & SupportA 3-in-1 indicator for displaying Fibonacci retracement and pivot levels over custom periods along with areas of previous major support. Each of the three tools can be toggled on/off.
Used properly, these should give you a better idea of where to place orders and take profit.
Alerts are built in but had to remain somewhat generic due to data point limitations. There are alerts for crossing and crossing up/down over each category of line.

New Age PivotsHere I'm proposing possibly the simplest and most relevant pivot style for intraday traders like me.
It utilizes fundamentals of the average range and devises S/R around that. Pivot point in this is today's open (colored lime), which is far more relevant than yesterday's/past data based pivots.
This is an attempt to reduce the influence of historical data as much as possible, as traders grow in their experience and skill, this becomes the newest and most successful methodology to stay profitable over the long run. Just my pov.
This is purely for educational purposes, no past performance be it visual or mathematical is a guarantee of success in the future. Use it at your own discretion.
The author takes no responsibility of your individual profit or loss. Also, the script will be checked protected for protection against theft, however, you can use it by adding to your favorites.
I've added the ability to hide and view historical S/R as well, it looks best when your chart is clutter-free.
Enjoy~
SCMB MultiAlerts - Candle Structure Alert ScriptSCMB Multialerts is a tool for candle structure alert automation.
The input screen allows you to input the timeframe, choose candle structure condition, toggle inverse condition, and toggle Heiken-Ashi for that candle structure trigger condition.
Input the timeframe with the # first and use H - Hour, D - Day, W - Week, and M - Month after the number; example - "1H" - "3D" - "4H" - "1W"
There are 8 total alert conditions that are programmable. You may use any combination of timeframes, inverse/HA, and candle-structure unique to each trigger available at the same time.
When you have set the conditions you want for alerts with the input settings, the color and the position of on-screen alerts is automatically populated.
You can then visually back-test to make sure these settings are desirable
Customize the colors individually, or choose to use "Color0" for all alert conditions by default by "user colors" toggle at the bottom of settings window, then you only need to change "Color0" for each alert condition.
Use the "Indicator Templates" to save your configuration, save several presets with settings for different situations, you can link the settings to a particular symbol as well.
Finally, use the "add alert" feature within tradingview to select the SCMB alert conditions as triggers. TV will deploy alerts with your customized message when each condition is met.
Some notes and known bugs:
Timeframe input requires capital letters for H,D,W,M.
Selecting "Close" Open" or "HL/2" from the drop down will do nothing at the moment. Future release plans to make use of these options.
If there is a feature you would like, question answered, or a bug to report, visit the TradingView SNOW_CITY public chat-room; link in my signature
Use the pastebin link below for indicator access information