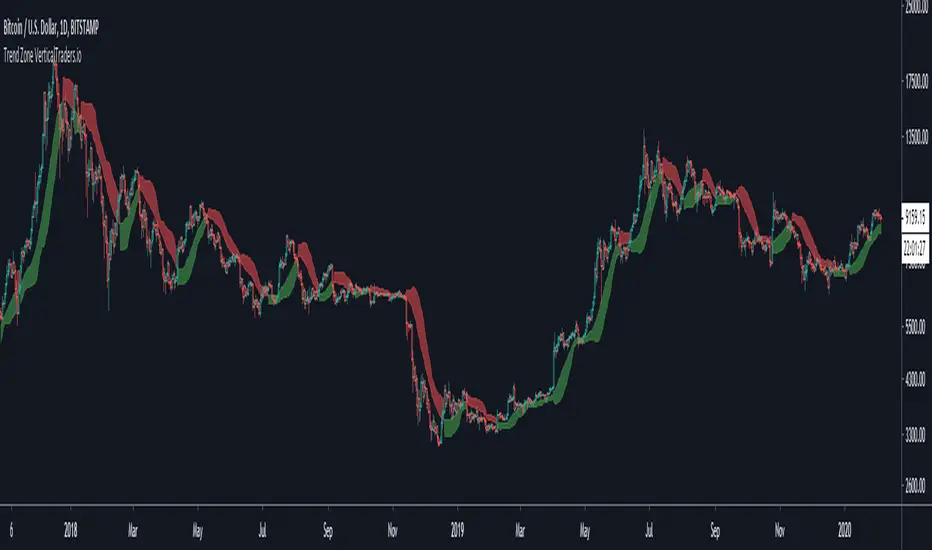
Trend ZoneTrend Zone
- Shows the risk areas to continue in a trend
- Trend Indicator for Long and Short entries
- It can be used as a trend indicator or as a trailing stop loss
- Long and Short Labels and Alerts
- Configurable in Periods and the type of MA for the calculation
Profit
Trend ProTrend Pro
- Trend Indicator for Long and Short entries
- It can be used as a trend indicator or as a trailing stop loss
- Long and Short Labels and Alerts
- Configurable in volatility values and periods

Extreme ScalpingThis is a test of an easy scalping method: buy if actual close is below forecast close and sell if actual close is above forecast close. Take profit and stop loss shall be very small (few pips) as in most of scalping strategies.
No filter is used for only long or only short positions, but you can select buy only or sell only based on other indicators or whatever you feel is the direction of trading.
NOTE: you can add this strategy to your chart but you should modify the backtest day otherwise you will get an error due to calculation limits of pine script. For example, on one minute chart, you should set the backtest day from today only. For past days, set both start day and and day.
I have also a study with alarms.
Please use comment section for any feedback.

RENA 1.2 - STUDY / OPTIONSA swiss army knife type script, lots of indicators etc, good for crypto markets.
This is the strategy for the study that can be found here.
PM for source code :)
happy trading
xo

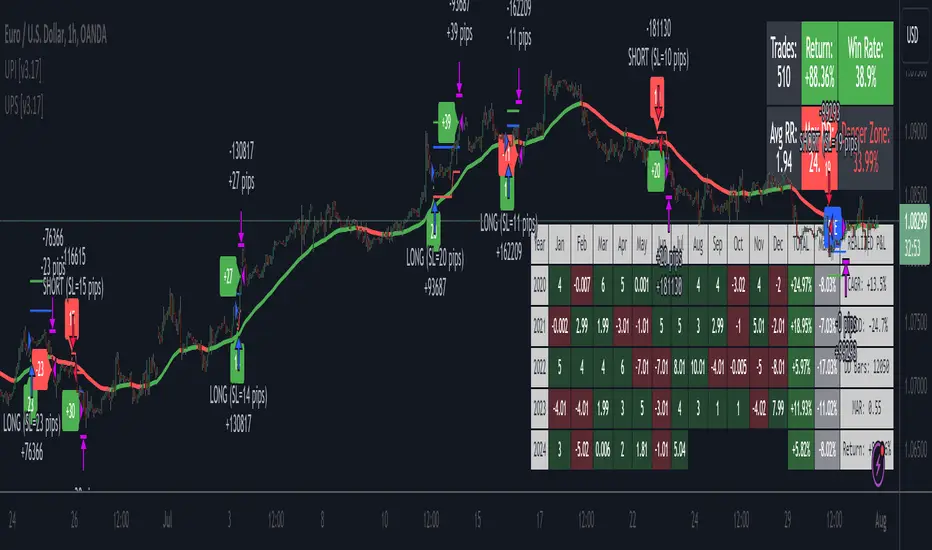
Ultimate Pullback StrategyWhat is the Ultimate Pullback Strategy?
This strategy script is based on my Ultimate Pullback Indicator which detects pullback trading opportunities by analyzing price action in a very specific manner.
By combining simple trend filters with various advanced candlestick patterns it detects high-probability trend-continuation setups (and optional exits).
If you use this script to set alerts then you will never miss a pullback trading opportunity ever again!
I personally use this indicator to profitably trade pullback signals in the forex markets on multiple timeframes, from the 15-Minute chart to the 4-Hour and Daily chart.
Note: This strategy companion script is only available for subscribers of The Ultimate Pullback Indicator.
Long Short Double strategyLong Short Double strategy
Long short strategy with stoploss and take profit.
I use this script for 5min btcusd on Bitmex. (The strategy also works on other exchanges, with some small adjustments in RSI)
Leverage 10x 375% profit in 2 weeks. NO REPAINT.
U can Adjust the RSI for long and shorts entry`s.
Study is Autoview ready. send me a PM for Paid access.
If you like this strategy buy me a Pizza, Dinner, or lambo:)
BITCOIN: 3BMEXTEMinsUUqUwr9GEjNA6ZBsVXB1g6u
LITECOIN: LdG82pyEMMji9Bynw3hvWgUshbMKfiFdJw

Crypto Break-even FeeWhen I started trading cryptocurrency, I lost money because I didn't take the fees enough into account. Therefore I created my own indicator to quicqly see the break-even selling price of the selling price if I want a predifined profit level.
2 lines are added to the graph. These lines move together with the current price.
- One line indicating the break-even selling price (depending on your maker/taker strategy). For beginners I suggest taking the taker strategy (mostly 0.25%)
- Another line indicating the selling price in order to make a predifined profit %
There are 2 parameters you can set:
- Desired profit (%)
- Maker/Taker Fee (%)
Always happy with a little appreciation ;-) Bitcoin wallet: 18522cAc7YDwwXTvtckXKb1kP33upVDRFR

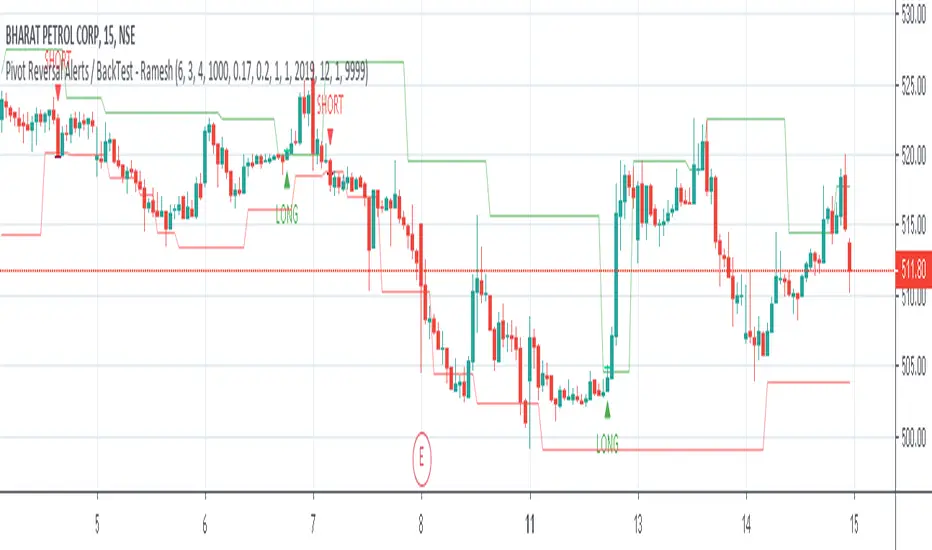
Pivot Reversal Strategy with ADX filter and Alerts V2 - RameshOne script with 80% Win Rate, applicable for 15m time period, more filters added to remove false signal.

Campfire v1 - Bonfire indicator (add on)Works great as a Bonfire LITE and even better in combination. I've been using it to confirm charts by hiding it and showing it to see if I'm dialed in. Lots of uses.. GUIDE COMING SOON and will be available with the Bonfire at no cost.
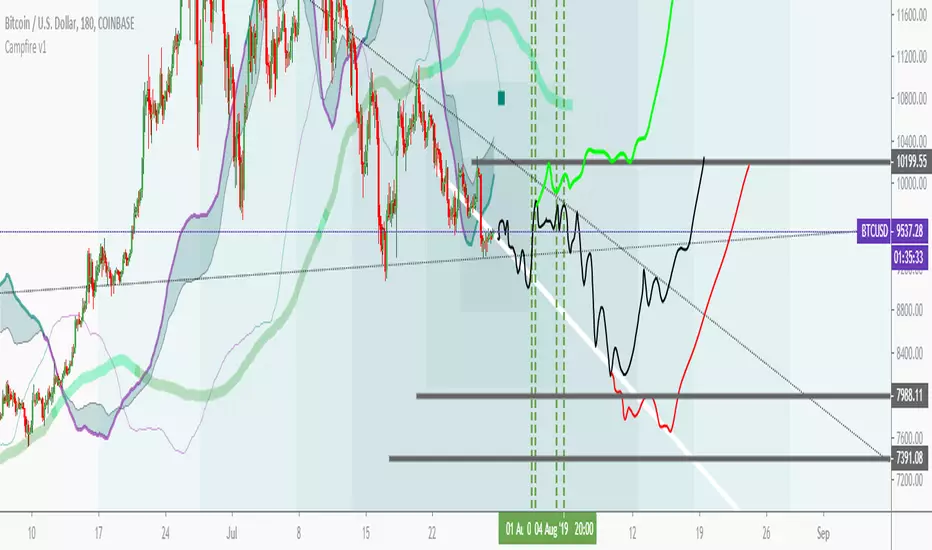
Didi+EMA200+Bollinger Bands-FRAGAHelps those are using Basic Account / limited indicators
by Will Fraga
@traderzonebr
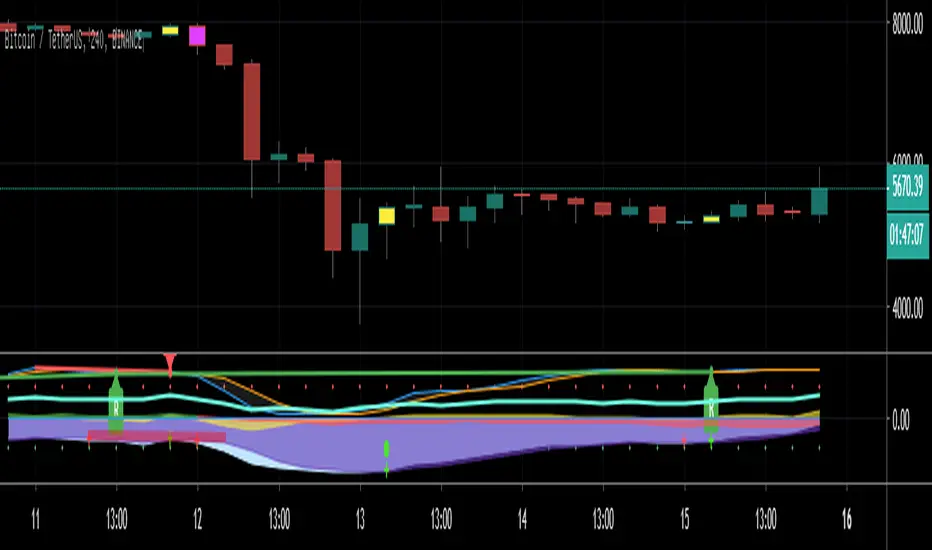
Gravity Swing Oscillator V1 - optimized for CryptoGravity Swing Oscillator V1 - optimized for Crypto
- Top & Bottoms
- Buy / Sell Signals on colorchanging LED Dots
- can show danger Price Dop Zones on Bars

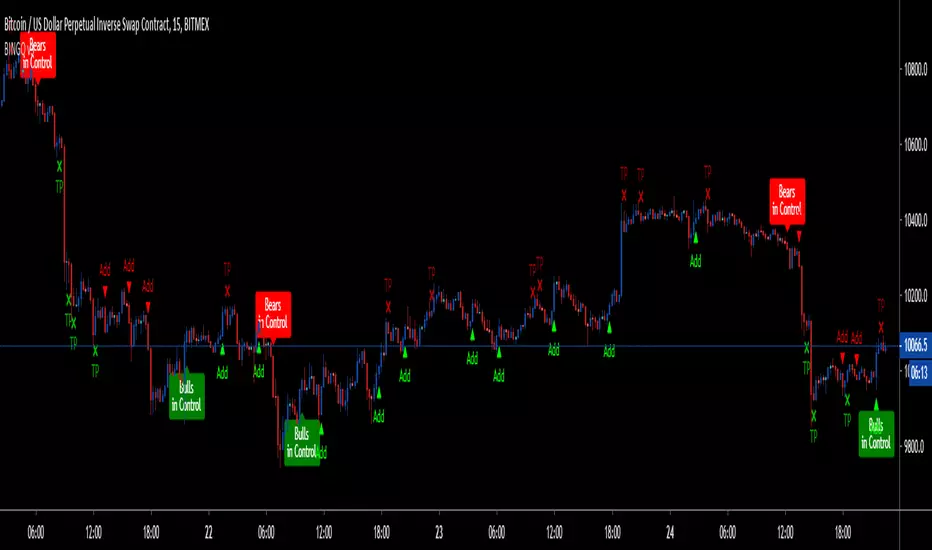
BINGO - LTF Bitmex Scalper for ETHThis is my first script which is exclusively made for ETH/USD for bitmex on 5-10min timeframe(Note: This is not for higher timeframe script, it was not designed to sustain all timeframes, but it might show some good results and you have to test it on your own). It might work for other coins, but i don't recommend it.
Its based on few parameters which I have been using to scalp ETH.
Currently its skipping few trades and exits which i will fix in sometime(getting to learn pine script), nevertheless it is by far most profitable of all my strategies.
LEGENDS:
1. Green Arrow up - Long
2. Red Arrow down - Short
3. Green TP - Take Profit for short position
4. Red TP - Take Profit for long position
If in Long postion, put STOP at low of 2nd last candle until TP1 hits. At TP1, take some profit and move stop to little above entry. Same for Short, put STOP and high of 2nd last candle until TP1 hits.
Also, it does not have alert function, so all of the trades have be manually executed. Trades are shown in chop zones as well, which will result in losses, so better use a chop indicator to avoid those trades.
Next update will have
1. FIxed missing Trades and Exits
2. Alerts
3. Improved Algo( Removal of signals in chop zone, options to have safe and risky entries, Stop placements)
4. Misc features such as, bar color change, multiple Buy/Sell(currently its alternative - Multiple means, if its a BUY and another BUY comes then it will show that too so you can add to the current trade) etc..
Just to clear my intentions, this script will be "paid only access" after next update(2-3 weeks). If you can, please tag your friends so they can benefit too. Please feel free leave a comment with all the suggestions and test results.
If you have made some money with this script, leave some tip:
BTC: 15sbDhh8t4itiFLuSTmznF87SMspvHBrDh
ETH: 0x8be1be65e9d6a167b8a4d10fda152d1d29e8e4cb


Ichimoku Analyzer☑️Ichimoku Analyzer
-This indicator automatically analyzes the Ichimoku conditions.
- Long and Short signals.
- Allows you to add an MA filter.
-Works in any timeframe or market like Forex, Crypto, Commodities even Stocks.
-Recommended manual trading and bots.
Do you need an Script or an expert adviser for Forex, contact our coding service!
Get this indicator today! contact us.

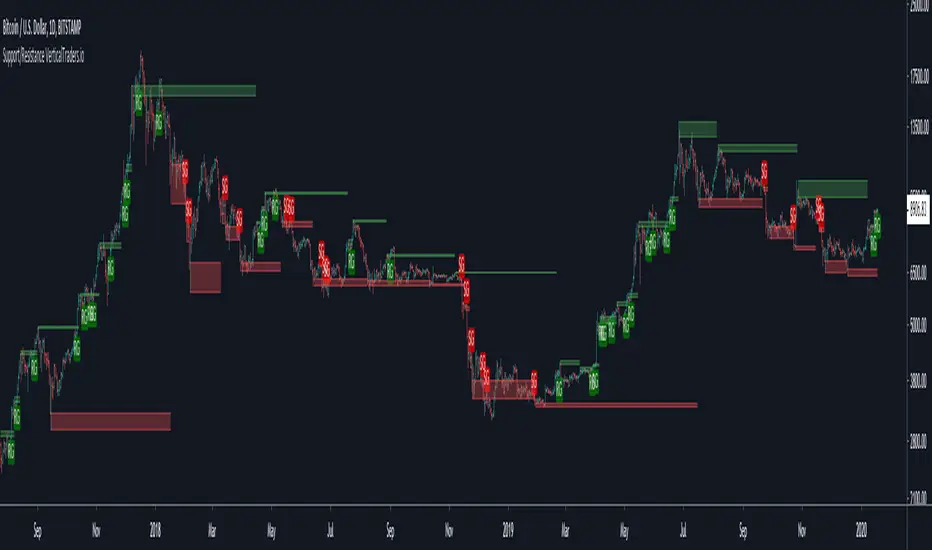
Support and Resistance LevelsSupport and Resistance Levels
-This indicador show automatically the support and resistance levels.
- Allows you to select the amount and importance of the S/R levels.
-This indicator allows to overlay a custom timefame S/R levels.
-You can activate notification alerts for any of the conditions.
-Works in any timeframe or market like Forex, Crypto, Commodities even Stocks.
-Recommended manual trading.
Do you need an Script or an expert adviser for Forex, contact our coding service!
Get this indicator today! contact us.
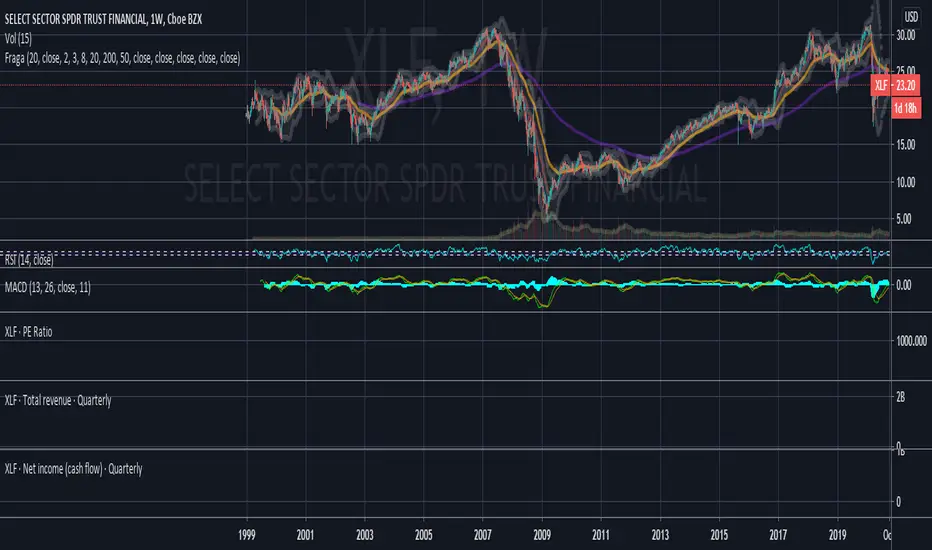
The Rocket : Profit Factor [Bradford_Fournier]The Rocket
I hope this helps you as much as it has me.
Suggestions:
Use with tech stocks with reasonably high volatility
Time-frames are flexible but a 1-3month window is best.
REQUEST: If you find this useful, please let me know. I'd like to improve this script further. Any suggestions or encouragement are greatly appreciated
The rocket is based on my Trend Shift Indicator. Please take a look if you haven't yet.

ATR based Pivots mcbwHey everyone this is an exciting new script I have prepared for you.
I was reading an old forex bulletin article some time ago when I came across this: solar.murty.net (or you can download the full bulletin with lots of other good articles here: www.forexfactory.com).
You can already buy this for metatrader (www.mql5.com) so I figured to make it for free for tradingview.
This bulletin suggested that you can reasonably predict daily volatility by adding or subtracting multiples of the daily ATR to the daily opening. Using this you can choose multiples to use as price targets and alternatively as stop losses. For example, if you already have a sense of market direction you can buy at market open place a stop loss at - 1 daily ATR and a profit target at + 3 ATRs for a risk to reward ratio of 3. If you are looking for smaller/quicker moves with a ratio of 3 you can have a stop loss at -0.25 ATR and a take profit at +0.75 ATR.
Alternatively this article also suggests to use this method to catch volatility breakouts. If price is higher than the + 1 ATR area then you can safely assume it will be going to the +2 ATR area so you can put a buy stop at + 1 ATR with a profit target at + 2 ATR with a stop loss at +0.5 ATR to catch a volatility breakout with a risk to reward ratio of 2!
Even further there are methods that you can use with ATRs of multiple window sizes, for example by opening two copies of this indicator and measuring recent volatility with a 1 week window and long term volatility within a 1 month window. If the short term volatility is crossing the long term volatility then there is a high probability chance that even more price movement will occur.
However I have found that this method is good for more than daily volatility , it can also be used to measure weekly volatility , and monthly volatility and use these multiples as good long term price targets.
To select if you want daily, weekly, or monthly values of the ATR of volatility you're using go to the settings and click on the options in the "Opening period". The default window of the ATR here is 14 periods, but you can change this if you want to in "ATR period". Most importantly you are able to select which multiples of the ATR you would like to use in the settings in "ATR multiple 1" which is the green line, "ATR multiple 2" which is the blue line, and "ATR multiple 3" which is the purple line. You can select any values you want to put in these, the choice of 0.25, 0.5, and 1 is not special, some people use fibonacci numbers here or simply 0.33, 0.66, and 0.99.
Repainting issue: This script uses the daily value of the Average True Range (ATR), which measures the volatility that is happening today. If price becomes more volatile then the value of the ATR can increase throughout the day, but it can never decrease. What this means is that the ATR based pivots are able to expand away from the opening price, which should not affect the trades that you take based on these areas. If you base your take profit on one of these ATR multiples and the daily volatility increase this means that your take profit area will be closer to your entry than the ATR multiple. Meaning that your trades will be more conservative.
While this all may sound very technical it is super intuitive, throw this on your chart and play around with it :)
Happy trading!

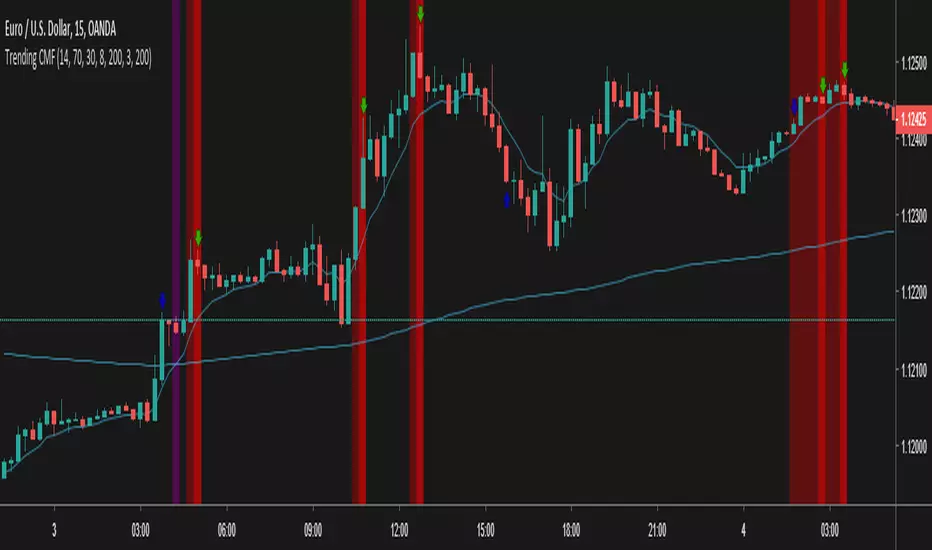
Trending CMF - InverseThis is an rsi based strategy for filtering trends and following nice signals
It is the reversal for the following script and strategy
Test and debug, lemme know what best fits, we are working to improve this
B3 MTF OHLCMy idea by using Linear regression and some other filters. Great results without repaint :)

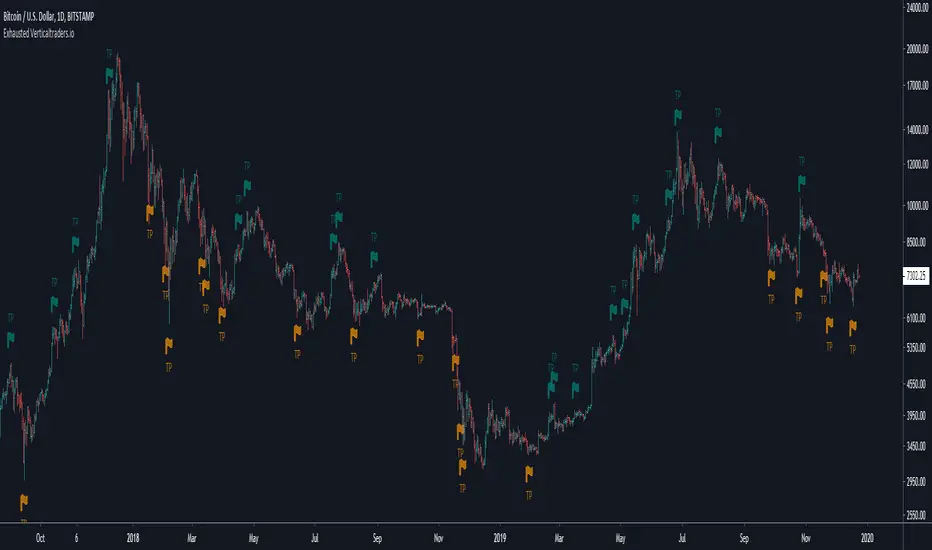
Exhausted-This algorithm takes in consideration Media averages, Volatility Movements, trend direction and other Mathematical Properties.
-After adding this signal on TradingView, you will get notified when it is suggested to protect profit or exits long and short positions.
-Meaning of colors:
Dark Red: suggestion protect profits Long
Red: suggestion exit Long
Dark green: suggestion protect profits Short
Green: suggestion exit Short
-You can activate notification alerts for any of the conditions.
-Works in any timeframe or market like Forex, Crypto, Commodities even Stocks.
-Recommended manual trading.
Do you need an Script or an expert adviser for Forex, contact our coding service!
Get this indicator today! contact us.