Volatility Adjusted Profit Target
In my 'Volatility Adjusted Profit Target' indicator, I've crafted a dynamic tool for calculating target profit percentages suitable for both long and short trading strategies. It evaluates the highest and lowest prices over the anticipated duration of your trade, establishing a profit target that shifts with market volatility. As volatility increases, the potential for profit follows, with the target percentage rising accordingly; conversely, it declines with decreasing volatility. As a trader, setting an optimal Take Profit level has always been a challenge. This indicator not only helps in determining that level but also dynamically adjusts it throughout the trade's duration, providing a strategic edge in volatile markets.
Profit

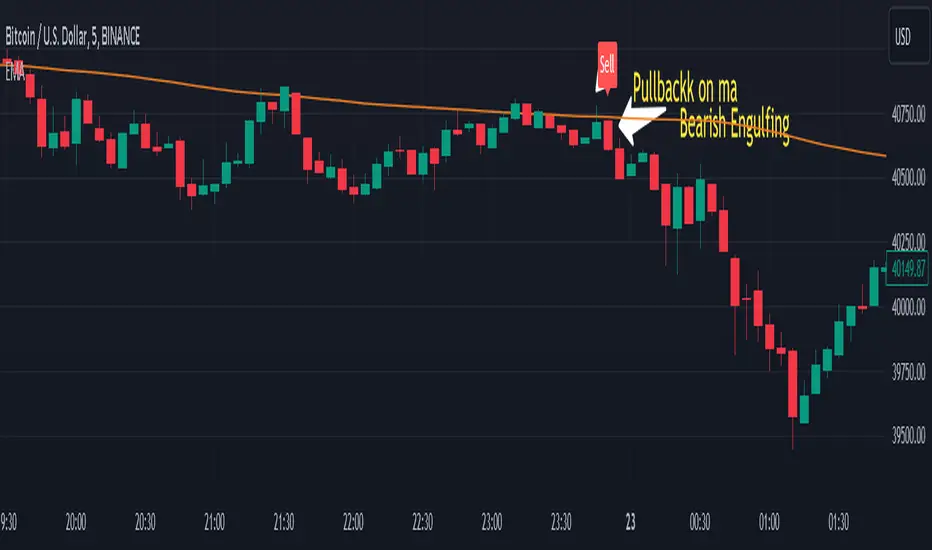
Engulfing pullbackThis Indicator searching for pullback on input Moving Average with Engulfing candle
Rules for indicator :-
Buy Signal -
1) search for pullback on ma if price above ma and come back and touches ma
2)after pullback on ma searching for bullish engulfing pattern on next candle
3)if pullback on previous candle and bullish engulfing for buy signal form
Sell Signal -
1) search for pullback on ma if price below ma and come back touches ma
2)after pullback on ma searching for bearish engulfing pattern on next candle
3)if pullback on previous candle and bearish engulfing for buy signal form
Disclaimer -Traders can use this script as a starting point for further customization or as a reference for developing their own trading strategies. It's important to note that past performance is not indicative of future results, and thorough testing and validation are recommended before deploying any trading strategy.
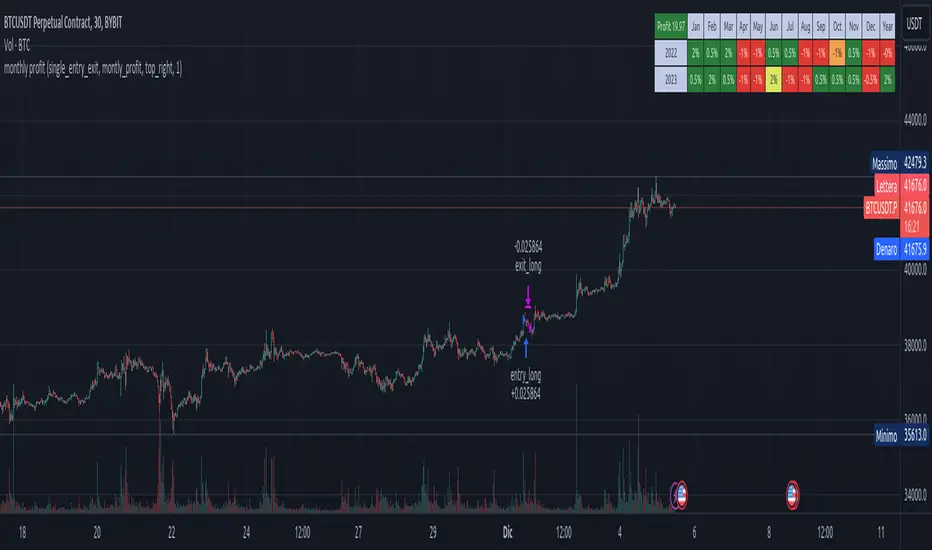
Stx Monthly Trades ProfitMonthly profit displays profits in a grid and allows you to know the gain related to the investment during each month.
The profit could be computed in terms of gain/trade_cost or as percentage of equity update.
Settings:
- Profit: Monthly profit percentage or percentage of equity
- Table position
This strategy is intended only as a container for the code and for testing the script of the profit table.
Setting of strategy allows to select the test case for this snippet (percentage grid).
Money management: not relevant as strategy is a test case.
This script stand out as take in account the gain of each trade in relation to the capital invested in each trade. For example consider the following scenario:
Capital of 1000$ and we invest a fixed amount of 1000$ (I know is too risky but is a good example), we gain 10% every month.
After 10 months our capital is of 2000$ and our strategy is perfect as we have the same performance every month.
Instead, evaluating the percentage of equity we have 10% the first month, 9.9% the second (1200$/1100$ - 1) and 5.26% the tenth month. So seems that strategy degrade with times but this is not true.
For this reason, to evaluate my strategy I prefer to see the montly return of investment.
WARNING: The strategy provided with this script is only a test case and allows to see the behavior with different "trades" management, for these reason commision are set to zero.
At the moment only the provided test cases are handled:
test 1 - single entry and single exit;
test 2 - single entry and multiple exits;
test 3 - single entry and switch position;
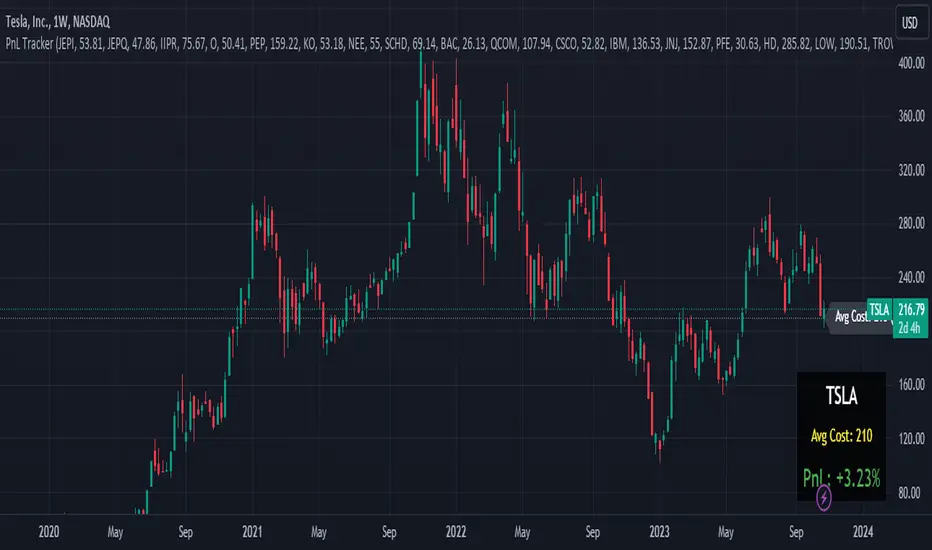
Portfolio PnL Tracker
This is a personal portfolio tracker that helps you track your daily profits and losses. You can track up to 64 stocks or cryptocurrencies. You can set them by specifying the symbol and average price.
FEATURES
- Set up to 64 stock or crypto symbols.
- Shows the average price line
- Show profit or loss as a percentage
- Shows only when on the chart that matches the symbol settings.
HOW TO USE
1. Double click the PnL Tracker indicator at the top left of the chart
2. Enter your symbol and average cost
The average cost line shows your current position.
PnL is calculated based on the average cost you input.
The Profit and Loss (PnL) box and the average cost line will only be displayed when your input symbol matches the chart you are currently viewing.
Realized Profit & Loss [BigBeluga]The Realized Loss & Profit indicator aims to find potential dips and tops in price by utilizing the security function syminfo.basecurrency + "_LOSSESADDRESSES".
The primary objective of this indicator is to present an average, favorable buying/selling opportunity based on the number of people currently in profit or loss.
The script takes into consideration the syminfo.basecurrency, so it should automatically adapt to the current coin.
🔶 USAGE
Users have the option to enable the display of either Loss or Profit, depending on their preferred visualization.
Examples of displaying Losses:
Example of displaying Profits:
🔶 CONCEPTS
The concept aims to assign a score to the data in the ticker representing the realized losses. This score will provide users with an average of buying/selling points that are better to the typical investor.
🔶 SETTINGS
Users have complete control over the script settings.
🔹 Calculation
• Profit: Display people in profit on an average of the selected length.
• Loss: Display people in loss on an average of the selected length.
🔹 Candle coloring
• True: Color the candle when data is above the threshold.
• False: Do not color the candle.
🔹 Levels
- Set the level of a specific threshold.
• Low: Low losses (green).
• Normal: Low normal (yellow).
• Medium: Low medium (orange).
• High: Low high (red).
🔹 Z-score Length: Length of the z-score moving window.
🔹 Threshold: Filter out non-significant values.
🔹 Histogram width: Width of the histogram.
🔹 Colors: Modify the colors of the displayed data.
🔶 LIMITATIONS
• Since the ticker from which we obtain data works only on the daily timeframe, we are
restricted to displaying data solely from the 1D timeframe.
• If the coin does not have any realized loss data, we can't use this script.

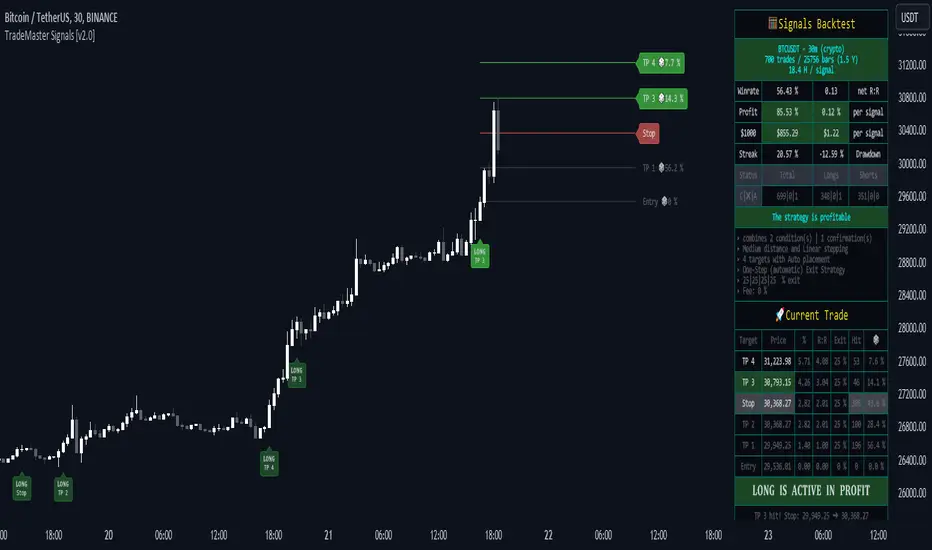
TradeMaster SignalsTrading effectively requires a range of techniques, experience, and expertise. From technical analysis to market fundamentals, traders must navigate multiple factors, including market sentiment and economic conditions. However, traders often find themselves overwhelmed by market noise, making it challenging to filter out distractions and make informed decisions. To address this, we present a powerful indicator package designed to assist traders on their journey to success.
The TradeMaster indicator package encompasses a variety of trading strategies, including the SMC (Supply, Demand, and Price Action) approach, along with many other techniques. By leveraging concepts such as price action trading, support and resistance analysis, supply and demand dynamics, these indicators can empower traders to analyze entry and exit positions with precision. Unlike other forms of technical analysis that produce values or plots based on historical price data, Price Action brings you the facts straight from the source - the current price movements.
The indicator package consists of three powerful indicators that can be used individually or together to maximize trading effectiveness.
⭐ About the Signals Indicator
This indicator offers a unique opportunity for traders to design their own personalized trading strategy. It has a built-in backtesting system, which allows you to thoroughly analyze the performance of your strategy before implementing it in live trading. With the ability to customize and test your strategy using historical data, the Signals indicator empowers you to make data-driven decisions and refine your trading approach.
👉 How does it work?
The Signals indicator provides users with the ability to select trigger conditions and further narrow them down using confirmations.
Conditions are quantitative factors that influence the generation of signals on the chart and in the backtest table. You can enable multiple conditions to create a comprehensive set of criteria for signal generation.
Confirmations, on the other hand, are qualitative factors that selectively filter out conditions based on their alignment with the chosen confirmations. This helps refine the signals and provide more targeted trading opportunities. Multiple confirmations can be enabled to further enhance the precision of the signals.
A well-balanced strategy in the Signals indicator involves carefully selecting a combination of conditions and confirmations to generate accurate trading signals. Finding the right balance between them is crucial for consistent and profitable trading.
To offer even more flexibility, the Signals indicator includes two powerful main functions:
Target Placement System: This feature allows you to set up to 6 targets with a stop loss level and partial exit percentages. You can choose between automatic target creation or manual customization, giving you control over your profit targets.
Exit Strategy: With this feature, you can define your preferred trailing stop strategy, allowing you to implement a systematic approach to exiting trades. By setting appropriate trailing stop levels, you can limit potential losses, while the system secures profits by automatically closing positions partially when certain price targets are reached. This may help you to maintain discipline in your trading and optimize your risk-reward ratio.
With over 30 unique conditions, 10 confirmations, and the deep Target Placement and Exit Strategy systems, the Signals indicator offers a vast array of possibilities. In fact, there are potentially millions of different strategy outputs available for each ticker. Despite its complexity, the script remains lightweight and fast, ensuring smooth performance.
The Signals Backtest table provides a comprehensive overview of your strategy's performance. You can track your current position with all the necessary details, allowing you to monitor your trades effectively and make informed decisions based on the backtest results.
⚠️ WARNING!
Backtest results do not guarantee future performance. Strategies tested on synthetic data may not accurately represent real-world results. Testing should be conducted on charts that reflect actual closing prices.
The indicator displays buy/sell signals intended to support traders' analysis. There are numerous possibilities and combinations available to create your own unique strategies, whether trading with or against the trend or capturing oversold bounces. These are just a few of the many options! Our indicator can easily be tailored to fit your trading strategy.
The settings that influence the signal-generating algorithm play a crucial role in effectively utilizing the signals. We provide users with the flexibility to modify the settings to align with their trading style, while also offering simple adjustment methods using various techniques.
Each method for modifying the signal settings has been designed to meet specific user needs. It is important to understand that one method is not necessarily more accurate than another.
It is essential to understand that signal indications generally serve as trend confirmations, rather than direct entry and exit points. Focusing on the easy use of signal settings and utilizing other functionalities in our toolkit will likely be a better decision than attempting to find the "holy grail" of optimized signal settings and solely relying on following the signals.
⭐ Conclusion
We hold the view that the true path to success is the synergy between the trader and the tool, contrary to the common belief that the tool itself is the sole determinant of profitability. The actual scenario is more nuanced than such an oversimplification. Our aim is to offer useful features that meet the needs of the 21st century and that we actually use.
🛑 Risk Notice:
Everything provided by trademasterindicator – from scripts, tools, and articles to educational materials – is intended solely for educational and informational purposes. Past performance does not assure future returns.
ATR profit and loss linesWhat is ATR?
Taking a candlestick, the following 3 transactions are calculated:
1-The difference between the high of the day and the low of the day
2-The difference between today's high and yesterday's close
3-The difference between today's low and yesterday's close
Atr takes the average of these 14-day candlesticks after making their calculations and it predicts how high or low a candle can go and these give us support and resistance helps with points
If you have noticed a rise in your chart and have no idea how high it will go, you can use Atr profit and loss lines.
The red zone is the stop point, the blue zones are the snow zones.
Must be used with macd. macd is validator.
There is an increase in your chart, you opened the atr profit and loss lines upwards and if macd gives you an increase, it is recommended that you enter the trade at that time. It is recommended to increase your loss line 1 step in the direction of profit every 2 profit breaks on atr profit and loss lines.
ATR Nedir?
Bir mum barı ele alınarak şu 3 işlem hesaplanır:
1-Günün yükseği ile günün düşüğü farkı
2-Günün yükseği ile dünün kapanışının farkı
3-Günün düşüğü ile dünkü kapanışın farkı
ATR ise 14 günlük bu mum barlarının hesaplarını yaptıktan sonra ortalamasını alır ve bir mumum ne kadar yükselip düşebileceği konusunda tahmin verir ve bunlar bize destek ve direnç noktaları konusunda yardımcı olur
Eğer grafiğinizde bir yükseliş farketmişseniz ne kadar yükseleceği konusunda fikriniz yoksa Atr kar zarar çizgilerini kullanabilirsiniz.
Kırmızı bölge durdurma noktası,mavi bölgeler kar bölgeleridir.
Macd ile birlikte kullanılmalıdır.macd doğrulayıcıdır.
Grafiğinizde yükseliş var,atr kar zarar çizgilerini yukarı yönlü açtınız ve macd size yükseliş veriyorsa işte o sırada işleme girmeniz tavsiye edilir.atr kar zarar çizgilerinde her 2 kar kırılımında bir zarar çizginizi kar yönünde 1 kademe arttırmanız önerilir

AFRHi everyone! Sorry for not posting anything for so long again. I will be active in July, after passing my university exams. I bought some S&C magazine archives, so await my new post strategies and indicator in July, as things are gonna get real interesting! But for now let me hand you some new and interesting stuff — AFR indicator.
Actually, this is my third time republishing this indicator after a big timeout because of the battles with TV mods on reference politics (which I lost).
This is indicator was originaly made by some user from other trading website, which I can't mention because of TV reference politics.
Which principles are behind AFR?
First we define our own low and high (OL and OH respectively), which are equal to:
OL = open - ATR * ATR_Factor
OH = open + ATR * ATR_Factor,
where ATR — Average True Range,
ATR_Factor — "Factor" in the settings — multiplier for ATR.
On each tick we remember AFR's value from previous bar, if it is not 0.
When OL is greater then AFR, then AFR is equal to OL. It means that there is probably an uptrend, so we adjust AFR accordingly.
When OH is lower then AFR, then AFR is equal to OH. It means that there is probably a downtrend, so we adjust AFR accordingly.
How to use?
Green AFR — bullish trend.
Red AFR — bearish trend.
Green AFR's triangle up — buy signal — appears when AFR changes it's colour from red to green.
Red AFR's triangle down— sell signal — appears when AFR changes it's colour from green to red.
ALERTS INCLUDED!
My personal ecommendations
- You can AFR as a tool to find short-term and middle-term trends, as it does it's best to find such trends;
- If are a scalper, then you probably should try AFR on low factor settings, as AFR alone can find good scalping entries.
- As AFR is a trend indicator, please use it with other confirmation indicator to make better entries.
Hope you will find this script useful.
Take your profits!
- Tarasenko Fyodor

Position and Profit/LossHelps users track their position and profit/loss in real-time.
Instructions :
Open the indicator settings
Input your Quantity, Buy Price, Fee, and Target Price
This indicator is designed to provide users with simple real-time tracking of their positions and profit/loss within a trading session. It offers clear and concise information that enables users to understand their current position's profitability, making it easier for them to manage their trades effectively.
Input parameters
qty : Quantity of the position (default value: 100.0). The target label is represented by a green cross
buy_price : Buy price of the position (default value: 1.0).
fee : Fee percentage for the transaction (default value: 0.0016). note that this is not a percentage, but rather a decimal. So 0.0016 is 0.16%
target : Target price for the position (default value: 1.0). This is an extra label to show you where your target is on the chart. The target label is represented by a green cross
In addition to the main profit/loss label, the script also displays two auxiliary labels. The "BuyPrice" label presents the buy price of the position as a red cross symbol on the chart, allowing users to easily identify their entry point. The "targetSell" label displays the target sell price as green cross symbol, indicating the desired exit point for the position. These visual markers help users visualize their trading strategy.
The script takes into account that users may only need this information displayed on the last bar, as continuous updates might not be necessary. By checking if the current bar is the last one, the script ensures that the labels are only displayed when relevant.
Limitations
The script assumes that trading is done using the same quantity; which is not always the case. This will change with subsequent updates.

Supertrend - Optimised Exit We created a small script that will allow you to have a quick look into static SL/PT to choose from. This might save you time, replacing the manual search for optimal SL/PT.
We're checking signals of the strategy and computing its performance with a grid of SL/PT selected.
We used SuperTrend signals in this example, but it will be straightforward to integrate your signals.
In addition to total Return, we compute MAX Dd and Profit Factor. Other metrics can be implemented as well.
Thanks to @MUQWISHI for helping code it.
Disclaimer
Please remember that past performance may not indicate future results.
Due to various factors, including changing market conditions, the strategy may no longer perform as well as in historical backtesting.
This post and the script don’t provide any financial advice.

Manual PnL (Profit and Loss) % Tracker - spot long only
This is a manual profit and loss tracker. It takes the user's manual input of total cost and quantity, and then outputs a table on the bottom right of the chart showing the profit or loss %, average purchase price, gross profit or loss, and market value.
Instructions:
1. Double click the indicator title at the top left of the chart
2. Select the "Inputs" tab and click the empty field next to "Symbol" to enter the traded symbol+exchange. This entry MUST be the same as the chart you are on, for example BTCUSDT/BINANCE (indicator will not display otherwise)
3. Enter the Total Cost and Qty of shares/coins owned
4. Optional - change positive or negative colors
5. Optional - under the "Style" tab, change the color of the average price (AVG) line
Note that for the average price (AVG) line to be shown/hidden you must enable/disable "Indicator and financials labels" in the scales settings.
For crypto or other tickers that have prices in many decimal places I would suggest, for the sake of accuracy, adjusting the decimal places in the code so that for prices under $1 you will display more info.
For example let's say you purchase x number of crypto at a price of 0.031558 you should change the code displaying "0.00" on line 44 to "0.000000"
This will ensure that the output table and plotted line will calculate an average price with the same number of decimals.

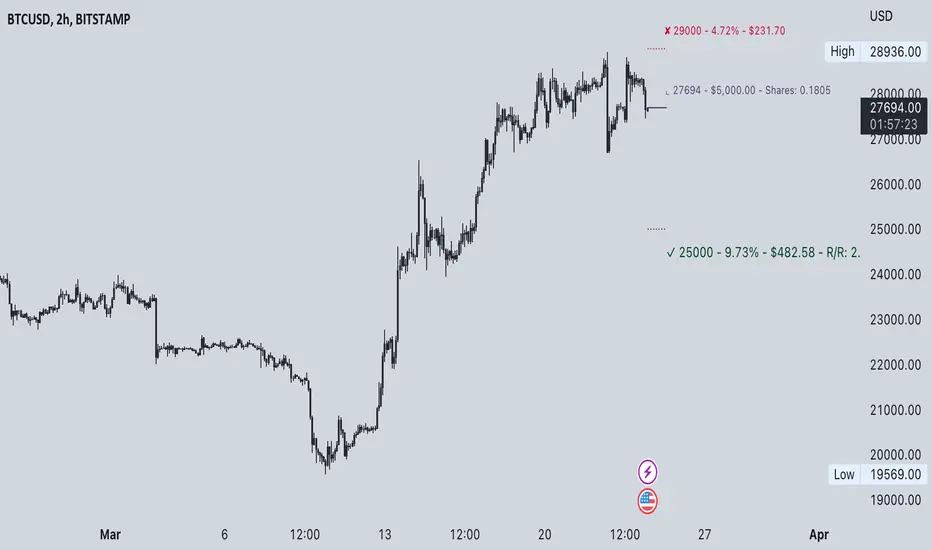
Commission-aware Trade LabelsCommission-aware Trade Labels
Description:
This library provides an easy way to visualize take-profit and stop-loss levels on your chart, taking into account trading commissions. The library calculates and displays the net profit or loss, along with other useful information such as risk/reward ratio, shares, and position size.
Features:
Configurable take-profit and stop-loss prices or percentages.
Set entry amount or shares.
Calculates and displays the risk/reward ratio.
Shows net profit or loss, considering trading commissions.
Customizable label appearance.
Usage:
Add the script to your chart.
Create an Order object for take-profit and stop-loss with desired configurations.
Call target_label() and stop_label() methods for each order object.
Example:
target_order = Order.new(take_profit_price=27483, stop_loss_price=28000, shares=0.2)
stop_order = Order.new(stop_loss_price=29000, shares=1)
target_order.target_label()
stop_order.stop_label()
This script is a powerful tool for visualizing your trading strategy's performance and helps you make better-informed decisions by considering trading commissions in your profit and loss calculations.
Library "tradelabels"
entry_price(this)
Parameters:
this : Order object
@return entry_price
take_profit_price(this)
Parameters:
this : Order object
@return take_profit_price
stop_loss_price(this)
Parameters:
this : Order object
@return stop_loss_price
is_long(this)
Parameters:
this : Order object
@return entry_price
is_short(this)
Parameters:
this : Order object
@return entry_price
percent_to_target(this, target)
Parameters:
this : Order object
target : Target price
@return percent
risk_reward(this)
Parameters:
this : Order object
@return risk_reward_ratio
shares(this)
Parameters:
this : Order object
@return shares
position_size(this)
Parameters:
this : Order object
@return position_size
commission_cost(this, target_price)
Parameters:
this : Order object
@return commission_cost
target_price
net_result(this, target_price)
Parameters:
this : Order object
target_price : The target price to calculate net result for (either take_profit_price or stop_loss_price)
@return net_result
create_take_profit_label(this, prefix, size, offset_x, bg_color, text_color)
Parameters:
this
prefix
size
offset_x
bg_color
text_color
create_stop_loss_label(this, prefix, size, offset_x, bg_color, text_color)
Parameters:
this
prefix
size
offset_x
bg_color
text_color
create_entry_label(this, prefix, size, offset_x, bg_color, text_color)
Parameters:
this
prefix
size
offset_x
bg_color
text_color
create_line(this, target_price, line_color, offset_x, line_style, line_width, draw_entry_line)
Parameters:
this
target_price
line_color
offset_x
line_style
line_width
draw_entry_line
Order
Order
Fields:
entry_price : Entry price
stop_loss_price : Stop loss price
stop_loss_percent : Stop loss percent, default 2%
take_profit_price : Take profit price
take_profit_percent : Take profit percent, default 6%
entry_amount : Entry amount, default 5000$
shares : Shares
commission : Commission, default 0.04%
Average Cost (Costo Promedio)ENGLISH
This 'Average Cost' script allows the user to input and visualize profit or loss for different stocks (up to 50) with average cost and quantity data on a single chart. This is useful for tracking the profit or loss of each stock in real-time.
To use this script, the user should follow these steps:
1. Add the 'Average Cost' script to your TradingView chart.
2. In the script's configuration window, input the tickers, average costs, and quantity of shares for each ticker you want to monitor.
3. Click 'Accept' to apply the changes.
This script is primarily designed for stock markets, but can also be useful in other financial markets where the user is interested in tracking the performance of multiple assets.
ESPAÑOL
Este script de "Costo Promedio" permite al usuario ingresar y visualizar si hay ganancia o perdida para diferentes acciones (hasta 50) con los datos de costos promedio y cantidad de acciones en un solo gráfico. Esto es útil para realizar un seguimiento de la ganancia o pérdida de cada acción en tiempo real.
Para utilizar este script, el usuario debe seguir estos pasos:
1. Agregue el script "Costo Promedio" a su gráfico en TradingView.
2. En la ventana de configuración del script, ingrese los tickers, costos promedio y cantidad de acciones para cada ticker que desee monitorear.
3. Haga clic en "Aceptar" para aplicar los cambios.
Este script está diseñado principalmente para los mercados de acciones, pero también puede ser útil en otros mercados financieros donde el usuario esté interesado en rastrear el rendimiento de múltiples activos.

Profit EstimateLibrary "profitestimate"
Simple profit Estimatr. Engages when Position != 0
and holds until posittion is na/0...
if position changes sizes, it will update automatically and adjust.
it has an input for comission to estmate exit fees
update_avgprice(_sizewas, _delta, _pricewas, _newprice)
Get a new Average position Price
Parameters:
_sizewas : (float) the position prior
_delta : (float) the order amount
_pricewas : (float) the prior price
_newprice : (float) the price of order
Returns: New Avg Price
amount(_position, _close, _commission, _leverage, _fullqty)
Position Net Profit Net Commission, automatic on/off if position != 0
Parameters:
_position : (float) position size (total or margin size)
_close
_commission : (float) % where (0.1 = 0.1%)
_leverage : (float) optional if leveraged, default 1x
_fullqty : (bool) if position entered is tottal trade size default is margin qty (1/lev)
Returns: quote value of profit
percent(_position, _close, _commission, _leverage, _fullqty)
Position Net Profit, automatic on/off if position != 0
Parameters:
_position : (float) position size (total or margin size)
_close
_commission : (float) % where (0.1 = 0.1%)
_leverage : (float) optional if leveraged, default 1x
_fullqty : (bool) if position entered is tottal trade size, default is margin qty (1/lev)
Returns: percentage profit (1% = 1)
Live PnL v1.0Live P&L for multiple stocks, currencies, crypto and commodities can now be tracked for your favorite scripts, pair trading etc.
This indicator gives provision to add up to 3 stocks/futures/currency with Buy and Sell, Quantity (can be lot size or any other) and Entry Price and set as default so that every time you put back this indicator you can monitor the live Profit / Loss figure.
This indicator will help trade to evaluate and track tips/trades of experts on social media and Media platforms and check their accuracy themselves in an organized way.
Apart from paper trading a trade or multiple positions ones combined together it also gives a feeler of combined Mark to live Market Drawdowns or Profitability.

FBMAEN:
TradingView indicator for FBMA strategy
People oftem ask: “Dmitry, BABA, TSLA, AAPL flies like a rocket! Well, what are we buying!?” - And I say no, the price does not act like a straight rocket upwards or downwards, instead it breathes, inhales moving away from the moving average and exhales returning to it, so we will wait for the first pullback and buy exactly at the value of the moving average.
Your new paradigm: wait for the stock to pull back to the moving average rather than chasing the price
And one more thing... Remember, you don't want to buy a stock when it's going down, you'll start to have doubts. it's against human nature to go long when the price is falling, but that's why this strategy works so well. We buy on the price rollback (pullback to the moving average), but we DO IT WHILE FOLLOWING THE TREND.
The biggest consequence of this strategy, my author's FBMA strategy and this is a game changer (results are in the comments).
So, let's dive into FBMA indicator settings:
Main settings
ATR Period — Period of intergrated ATR Indicator(shows ATR in a small dashboard);
Settings of Moving Averages
Sign Moving Averages? — shows values of moving averages near their lines on the chart;
Fix MAs' signatures overlapping? — automatically MAs' signatures overlapping (specifically for SMAs and EMAs!) ;
Fix MAs' signatures overlapping between SMAs and EMAs? — automatically group overlapping between EMAs' and SMAs' signatures;
Min distance between MAs' signatures (in % of ATR) — minimal distance between MAs' signatures that indicator will push away MAs' signatures from each other if they are overlapped;
Dashboard
Dashboard position — position of dashboard on the chart ( 9 options ).
Settings of MAs
Source;
Period;
Option for showing EMA and/or SMA of chosen period and source;
Line colour ;
Signature colour .
Addons
Show data by selected timeframe? — shows difference of current price opening and opening a "timeframe" time ago;
Shows MAs only if asset has grown by selected growth % in selected timeframe?
Growth, % — percent, which asset has to gain in order for MAs to be plotted;
Timeframe — frequency with which price's current and previous opening are being will be compared;
Show analog MAs' signatures? — shows MAs' value in a small table;
Show cloud between 1st and 2nd MAs? — shows cloud for both EMAs and SMAs simultaneously).
Price Action
This settings are intuitively understandable
Feel free to leave your questions or suggestions in the comments!
* Price Action-section was taken from ChrisMoody's CM_Price_Action and rebuilt.
RU:
Индикатор TradingView для стратегии ПООС
Мне часто пишут в личку: “Дмитрий, BABA, TSLA , AAPL летит ракетой! Ну что покупаем!?”- А я говорю нет, цена не летит по прямой ракетой вверх, она дышит, делает вдохи отдаляясь от скользящей и выдохи возвращаясь к ней, поэтому мы дождёмся первого пуллбэка и купим точно на значении скользящей
Ваша новая парадигма: ждать акцию на пуллбэке к скользящей по тренду, а не гнаться за ценой
И ещё… Помните, вы не захотите покупать акцию в момент, когда она падает, вы начнете сомневаться т.к. это против человеческой природы заходить в лонг при падении цены, но именно поэтому эта стратегия работает так эффективно, т.к. мы покупаем на откате цены (пуллбэке к скользящей), но ПО ТРЕНДУ
Самое большее следствие из этой стратегии, моя авторская стратегия ПООС и это гейм-чейнджер (результаты в комментариях).
Итак, давайте посмотрим сами настройки индикатора:
Основные настройки
ATR Period — период интегрированного индикатора ATR (показывает ATR на небольшой панели);
Настройки скользящих средних
Sign Moving Averages? — показывает значения скользящих средних рядом с их линиями на графике;
Исправить перекрытие сигнатур МА? — автоматически сигнатуры СС перекрываются (специально для SMA и EMA!) ;
Исправить перекрытие сигнатур МА между SMA и EMA? — автоматически группировать перекрытие между сигнатурами EMA и SMA;
Минимальное расстояние между сигнатурами скользящих средних (в % от ATR) — минимальное расстояние между сигнатурами скользящих средних, при котором индикатор будет отталкивать сигнатуры скользящих средних друг от друга, если они перекрываются;
Панель управления
Dashboard position — положение таблицы на графике ( 9 вариантов ).
Настройки МА
Source;
Период;
Опция отображения EMA и/или SMA выбранного периода и source;
Цвет линии ;
Цвет подписи .
Дополнения
Показать данные по выбранному таймфрейму? — показывает разницу текущей цены открытия и цены открытия в прошлом, по времени равному величины параметра "Таймфрейм";
Показывает MA только в том случае, если актив вырос на выбранный % роста за выбранный период времени?
Прирост, % — процент, на который актив должен набраться, чтобы скользящие средние были построены;
Таймфрейм — частота, с которой будет сравниваться текущее и предыдущее открытие цены;
Показать сигнатуры аналоговых МА? — показывает значение МА в небольшой таблице;
Показать облако между 1-й и 2-й скользящими средними? — показывает облако для EMA и SMA одновременно).
Price Action
Эти настройки будут интуитивно понятны
Оставляете свои вопросы и предложения в комментариях, всё учтём!
* Price Action-section was taken from ChrisMoody's CM_Price_Action and rebuilt.

Q-TrendQ-Trend is an multipurpose indicatorm that can be used for swing- and trend-trading equally on any timeframe (non-volatile markets are better for this thing).
Settings:
Trend period - used to calculate trend line in the special moments(will explain below);
ATR Multiplier - changes sensitivity. The higher the multiplier = the more sensitive it is.
Also option to smooth source data (helps get cleaner signals, as always).
How to use?
Signals are given on the chart. Also ou can use trend line as S/R line.
The idea behind:
Terms:
SRС = Source
TL = trend line;
MP = ATR multiplier;
ATR = ATR :)
TL = (highest of source P-bars back + lowest of source P-bars back) / 2
Epsilon = MP * ATR
I was thinking for a week about combining volatility and relation between highest and lowest price point. That why I called indicator Q-Trend = Quantitative Trend , as I was trying to think about price in a mathematical way.
Okay, time to go philosophical:
1) TL is shows good price trend, but as it is slow enough and not enough informative, we need add additional conditions to produce signals.
2) Okay, so what can we add as conditions? We need to take volatility into account, as it is crucial in the moments of market uncertainty. So let's use ATR (Average True Range) somehow. My idea is that if SRC breaks TL + ATR , then it means that there will be upmove and we update our TL . Analogically for SRC breaking TL - ATR (breaks are crosses of TL +- ATR lines) .
Conclusion:
- if SRC breaks TL + ATR , it is a BUY signal and update of trend line;
- if SRC breaks TL - ATR , it is a SELL signal and update of trend line;
I think that such indicator already exisits on TradingView, as I've already saw something similar, but long ago, so please don't report, if such thing already exists.
But if not, then I hope, that you will gain some profits with Q-Trend :)
I will continue my work on this thing, so stay tuned.
Trade with your own risks and have your profits!
Wish you all the best!
- Tarasenko Fyodor

Profit Bands [Loxx]Profit Bands is a supplementary indicator to be used with Loxx's backtests and combination indicators that use volatility-based take profits and stop loss. This indicator includes two types of volatility: Average True Range and True Range Double. Additional volatility sources will be added in the future. The lines painted on the screen are multiples of ATR for Take Profits and Stoploss for Long/Short positions that you can change in the settings. 3 Take Profits and 1 Stoploss is supported. You can turn on/off each UI element. Position size is determined by calculating the size of an investment where you'd lose only X% of your balance if the Stoploss is hit. You can enter your total balance available to trade and the desired % risk you'd be willing to lose at SL. Typically this number is 1-2% of total balance per trade.
Always remember to wait for bar close on a signal to and then peg this indicator to 1 bar backward to fix the price levels the then seed the exact levels you'll use for Take Profits and Stoploss. This indicator will match exactly the levels in other indicators in Loxx's scripts such as Kaleidoscope. You would overlay this script over any other script that uses volatility stops to see where to place your TPs and SL

TradingWolf Premium OscillatorsThe TradingWolf Premium Oscillators is a unique and enhanced selection of oscillators designed to help give you an edge on the markets.
Within this one indicator you will have access to RSI, Stochastic, MACD, Awesome Oscillator, Wavetrend, Zig Zag Pivots and DPO.
Including Divergence and Hidden Divergence signals for them.
Below each indicator is explained along with its enhancements to help you understand it better.
This script comes with the 'TradingWolf Premium' to get access, read the Author’s Instructions below.
There are extensive explanations on how to use these oscillators in our documentation on the website but we will give a simple overview here.
RSI
We try not to mess with these too much because if used correctly, they are very powerful tools. The main differences you will notice is that we have highlighted the areas where you should be paying attention to the oscillator with reversal/continuation zones.
The most popular feature from these will be the 4 divergences which can be toggled on or off in the settings.
Stochastic
Stochastic we have tried to keep as similar to the original as possible, main features are being able to select alternate timeframes for it to be calculated on as well as displaying divergences.
We have created a highlighted zone for when price enters the overbought/sold territory. A lot of traders will look for crossovers happening in these areas however from our tests we have discovered entering trades as the Stochastic comes out of these areas has hugely reduced losing trades, still not a perfect strategy but it does often show that the trend is showing weakening momentum and its commonly followed by a period of sideways action before continuing in a new direction.
MACD
We have calculated a dynamic extreme range for the MACD, you will notice the green/red bars as the bottom and top of the Oscillator. These levels help adjust with the assets volatility so they will work universally on all assets and timeframes. When these levels get more narrow, this indicates there is a potential larger move to come, similar thought process to a Bollinger band squeeze.
We like the Divergence signals you receive whilst in this OB/OS range as they give more confluence behind the divergence signal that price has over extended and is looking to retrace or consolidate.
Awesome Oscillator
The Awesome Oscillator is based on some pretty simple calculations but is hugely powerful.
The 3 main use cases are crossing the 0 value, showing weakening momentum and divergence signals.
We Particularly like the Divergence signals it gives us as they tend to be more accurate than any other oscillator.
Wavetrend
Wavetrend we try describe as a more dynamic Stochastic/MACD, it moves smoother and quicker without giving too many false signals.
Conditions we use the Wavetrend for are similar to the MACD where we are looking for crossovers or divergences in the extreme bands, these shouldn’t be used to trade alone and should be paired with other pieces of confluence for a higher probability trade however this is one of our favourites.
We also have a VWAP extreme detector which we pair with the Wavetrend, helping us identify areas where price should start cooling off.
Zig Zag
The main purpose of the standard Zig Zag is to analyse historical data to be able to observe cycle's in a market's movement, this requires a bit more explanation than we can include here so please refer to our documentation on the website for further guidance.
DPO
The detrended price oscillator is unlike other oscillators, such as the Stochastic or MACD the DPO is not a momentum indicator. It instead highlights peaks and troughs in price, which are used to estimate buy and sell points in line with the historical cycle.
We personally think this is the most under-rated oscillator out there, if you simply followed the DPO above 0 for long and below for short on higher timeframes you can outperform the buy and hold return of Bitcoin (BTCUSDT)...
This is just one simple way of using the DPO there are other more in depth methods of using it within our documentation.

BTC Profitable Wallets StrategyBTC Profitable Wallets Strategy - plots the percentage of profitable BTC wallets and places long orders when the profitable wallet share crosses above 50%, historically a very accurate point to catch the next Bull Run early.
The only setting is a smoothing option using the Moving Average method and length of your choice.
On Chain Data is queried from IntoTheBlock.
This is a 'HODL' strategy, with no exit given. If you'd like to see the historical performance check the Open Profit or place a sell order at the current date.

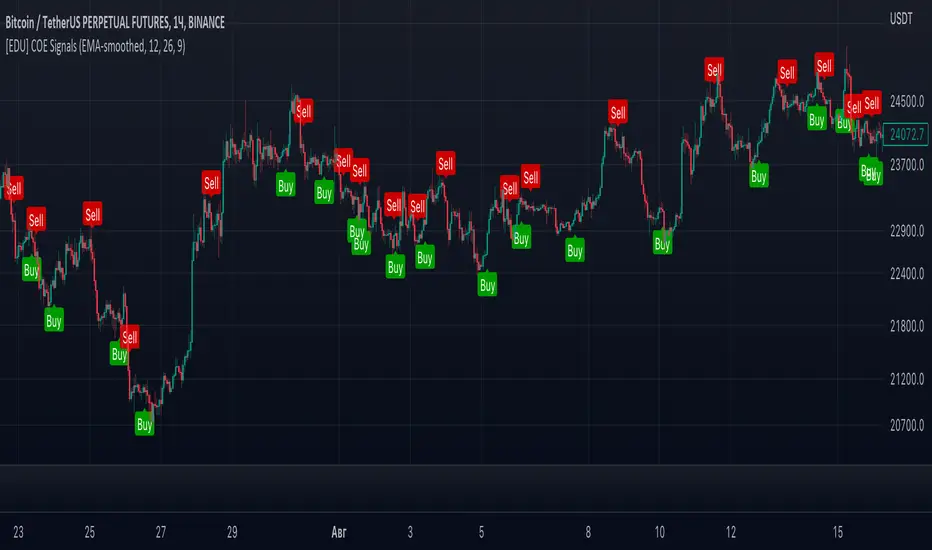
[EDU] Close Open Estimation Signals (COE Signals)EN:
Close Open Estimation ( aka COE ) is a very simple swing-trading indicator based on even simpler idea. This indicator is from my educational series, which means that I just want to share with another way to look at the market in order to broaden your knowledge .
Idea :
Let's take n previous bars and make a sum a of close - open -values of each bar. Knowledgeable of you may already see the similarity to RSI calculation idea . Now let's plot this sum and see what we have now.
We can see, that whenever COE crosses over 0-level, uptrend begins, and if COE crosses under 0-level, downtrend begins. The speed of such signals can be adjusted by changing lookback period: the lower the lookback, the faster signals you get, but high-quality ones can be obtained only via not-so-fast lookback as when the market is consolidating or volatility is to high, there can be many garbage signals, like 95+% of other indicators have.
Let's explore more and calculate volatility of COE(v_coe in the code): current COE - previous CEO .
Now it appears that when v_coe crosses over 0-level, it's a signal, that this is a new low and soon the uptrend will follow. Analogically for crossing under 0-level .
I guess now you understood what these all are about: COE crossings show global trend signals , while Volatility COE ( v_coe or VCOE ) crossings show reversal points .
For signals I further calculated volatility of VCOE(VVCOE) and then volatility of VVCOE(VVVCOE). Why? Because for me they seem to be more accurate, but you are welcome to experiment and figure best setups for yourself and by yourself, I just share my opinion and experience .
COE can be helpful only in high liquidity markets with good trend or wide sideways .
If you want to experiment with COE, just copy the code and play with it. Curious of you will probably find it helpful eventhough the idea is way too simple.
By it's perfomance COE can probably beat QQE at open price settings.
(use open of the price at indicator to get zero repaint! )
Examples :
If you any questions, feel free to DM me or leave comments.
Good luck and take your profits!
- Fyodor Tarasenko
RU:
Close Open Estimation ( aka COE ) — это очень простой индикатор свинг-трейдинга, основанный на еще более простой идее. Этот индикатор из моей образовательной серии, а это значит, что я просто хочу поделиться с другим взглядом на рынок , чтобы расширить ваши знания .
Идея :
Возьмем n предыдущих баров и составим сумму a из close - open -значений каждого бара. Знающие люди могут уже заметить сходство с идеей расчета RSI . Теперь давайте построим эту сумму и посмотрим, что у нас сейчас есть.
Мы видим, что всякий раз, когда COE пересекает выше 0-уровня, начинается восходящий тренд , а если COE пересекает ниже 0-уровня, начинается нисходящий тренд. Скорость таких сигналов можно регулировать изменением ретроспективы: чем меньше ретроспектива, тем быстрее вы получаете сигналы, но качественные можно получить только через не- такой быстрый взгляд назад, как когда рынок консолидируется или волатильность слишком высока, может быть много мусорных сигналов, как у 95+% других индикаторов.
Давайте рассмотрим больше и рассчитаем волатильность COE(v_coe в коде): текущий COE - предыдущий CEO .
Теперь кажется, что когда v_coe пересекает уровень 0, это сигнал о том, что это новый минимум и вскоре последует восходящий тренд . Аналогично для пересечения под 0-уровнем .
Думаю, теперь вы поняли, о чем все это: COE пересечения показывают глобальные сигналы тренда , а пересечения Volatility COE ( v_coe или VCOE ) показывают точки разворота .
Для сигналов я дополнительно рассчитал волатильность VCOE(VVCOE), а затем волатильность VVCOE(VVVCOE). Почему? Потому что для меня они кажутся более точными, но вы можете поэкспериментировать и подобрать оптимальные настройки для себя и для себя, я просто делюсь своим мнением и опытом .
COE может быть полезен только на рынках с высокой ликвидностью и хорошим трендом или широким боковиком .
Если вы хотите поэкспериментировать с COE, просто скопируйте код и поэкспериментируйте с ним. Любознательные из вас, вероятно, сочтут это полезным, хотя идея слишком проста.
По своей результативности СОЕ может составить конкуренцию широко известному QQE, используя open цены.
(используйте open цены на индикаторе, чтобы получить нулевую перерисовку! )
Примеры :
Если у вас есть вопросы, пишите мне в личные сообщения или оставляйте комментарии.
Удачи и профита всем!
- Федор Тарасенко
Ichimoku Cloud with ADX (By Coinrule)The Ichimoku Cloud is a collection of technical indicators that show support and resistance levels, as well as momentum and trend direction. It does this by taking multiple averages and plotting them on a chart. It also uses these figures to compute a “cloud” that attempts to forecast where the price may find support or resistance in the future.
The Ichimoku Cloud was developed by Goichi Hosoda, a Japanese journalist, and published in the late 1960s. It provides more data points than the standard candlestick chart. While it seems complicated at first glance, those familiar with how to read the charts often find it easy to understand with well-defined trading signals.
The Ichimoku Cloud is composed of five lines or calculations, two of which comprise a cloud where the difference between the two lines is shaded in.
The lines include a nine-period average, a 26-period average, an average of those two averages, a 52-period average, and a lagging closing price line.
The cloud is a key part of the indicator. When the price is below the cloud, the trend is down. When the price is above the cloud, the trend is up.
The above trend signals are strengthened if the cloud is moving in the same direction as the price. For example, during an uptrend, the top of the cloud is moving up, or during a downtrend, the bottom of the cloud is moving down.
DMI is simple to interpret. When +DI > - DI, it means the price is trending up. On the other hand, when -DI > +DI , the trend is weak or moving on the downside. The ADX does not give an indication about the direction but about the strength of the trend.
Typically values of ADX above 25 mean that the trend is steeply moving up or down, based on the -DI and +D positioning. This script aims to capture swings in the DMI, and thus, in the trend of the asset, using a contrarian approach.
Trading on high values of ADX , the strategy tries to spot extremely oversold and overbought conditions. Values of ADX above 45 may suggest that the trend has overextended and is may be about to reverse.
This strategy combines the Ichimoku Cloud with the ADX indicator to better enter trades.
Long/Short orders are placed when these basic signals are triggered.
Long Position:
Tenkan-Sen is above the Kijun-Sen
Chikou-Span is above the close of 26 bars ago
Close is above the Kumo Cloud
MACD line crosses over the signal line
-DI is greater than +DI
ADX is greater than 45
Short Position:
Tenkan-Sen is below the Kijun-Sen
Chikou-Span is below the close of 26 bars ago
Close is below the Kumo Cloud
MACD line crosses under the signal line
+DI is greater than -DI
ADX is less than 45
The script is backtested from 1 January 2022 and provides good returns.
The strategy assumes each order is using 30% of the available coins to make the results more realistic and to simulate you only ran this strategy on 30% of your holdings. A trading fee of 0.1% is also taken into account and is aligned to the base fee applied on Binance.
This script also works well on MATIC (15m timeframe), ETH (5m timeframe), and SOL (15m timeframe).

ALMA/EMA/SRSI Strategy + IndicatorBack with another great high hit rate strategy!!
Disclaimer* This strategy was sampled using source code written by @ClassicScott , as referred to in the script, there is a clear line where the source code was scripted by myself.
This Strategy consists of three key factors, the ALMA, EMA crossover, and a Stochastic Rsi
ALMA: The Alma is the step line shown, turning green and red at select times. This average value gives general oversight of the macro movement of price action. and this particular one was coded by Mr.ClassicScott.
EMA crossover: At the input screen you are given an option of the fast and slow ema's. The default is solely for the hit rate and correlation to the Alma of this strategy. The arrows you see depicted on the chart are the crossover events happening.
Stochastic Rsi: The Stochastic Rsi is a stochastic value, using data sampled from the rsi. The use of this indicator in my strategy is to prevent entries when too overbought and oversold, as well as closures and vice versa, to prevent holding bags either way.
Fixed % TP: In the input screen you are given a take profit and stop loss percentage, for good R/R the hit rate will take a notch down, but with no R/R it will be near perfect.
How to use this:
Add it to your chart to get the strategy inputs. (The strategy is really only useful on a 15min TF. However the indicator within it can be used on anything at anytime!)
Watch the yellow and aqua moving averages, these are your ema's and crossover's will trigger signals based on your integer inputs.
Find Correlation between other leading indicators, as well as crossover's down/up and a red/green alma.
DO NOT use the arrows as buy/sell signals. These are simply to show ema's are crossing under or over. Momentum indicator's paired with this can be useful to determine if it could be a buy signal or sell signal.
Cheat Code's Notes:
Almost at 1000 boosts!!! I appreciate the support from everyone and I will keep trying my best to deliver quality strategies for the people.
-Cheat Code
BYBIT:BTCUSDT
