Dorsey InertiaThis indicator was originally developed by Donald Dorsey (Stocks & Commodities, V.13:9 (September, 1995): "Refining the Relative Volatility Index").
Inertia is based on Relative Volatility Index (RVI) smoothed using linear regression.
In physics, inertia is the tendency of an object to resist to acceleration. Dorsey chose this name because he believes that trend and inertia are related and that it takes more effort and energy to reverse the direction of a stock or market than to keep it in the same direction. He argues that the volatility is the simplest and most accurate measure of inertia.
When the indicator is below 50, it signals bearish market sentiment and when the indicator is above 50 it signals a bullish trend.
Good luck!
Chỉ số Biến động tương đối (RVI)

Relative Volatility IndexCorrected Relative Volatility Index. This indicator was originally developed by Donald Dorsey (Stocks & Commodities V.11:6 (253-256): The Relative Volatility Index).
The indicator was revised by Dorsey in 1995 (Stocks & Commodities V.13:09 (388-391): Refining the Relative Volatility Index).
I suggest the refined RVI with optional settings. If you disabled Wilder's Smoothing and Refined RVI you will get the original version of RVI (1993, as built-in).
Also, you can choose an algorithm for calculating Standard Deviation.

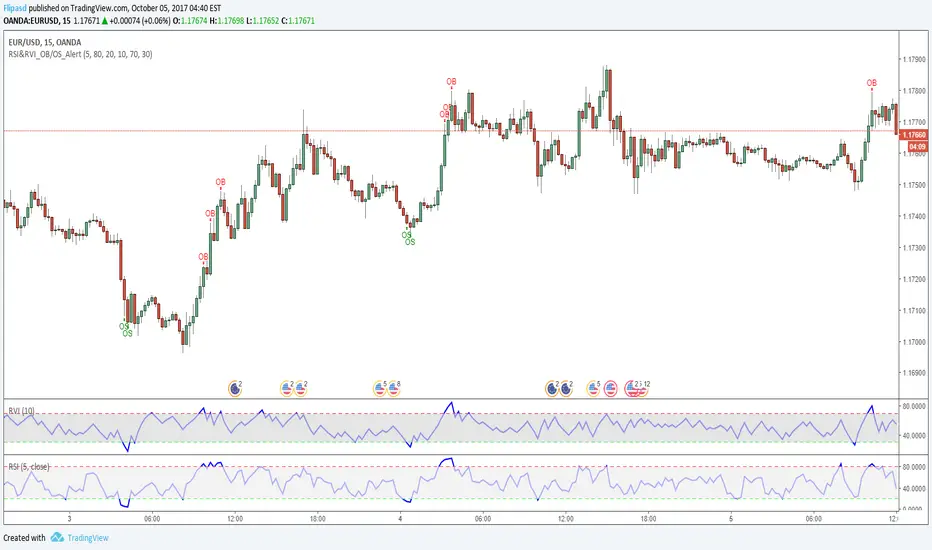
RSI & RVI OB/OS Alert ArrowThe script shows arrows on bars that are in overbought or oversold, based on the set parameters of Relative Strength Index ( RSI ) and Relative Volatility Index (RVI).
Also there is a universal allert, which includes both conditions - overbought and oversold.
You can change the period of RSI and RVI, as well as the upper and lower boundaries of these indicators.