Fibonacci Enhanced Bollinger BandsDiscover the synergistic power of Fibonacci ratios with traditional Bollinger Bands in the 'Fibonacci Enhanced Bollinger Bands' indicator. Ideal for traders seeking dynamic price levels for strategic entries and exits, this tool adds a unique Fibonacci twist to your technical analysis toolkit.
Introduction to Fibonacci Enhanced Bollinger Bands
'Fibonacci Enhanced Bollinger Bands' is a trading indicator that combines the classic Bollinger Bands approach with the powerful insights of Fibonacci ratios. By integrating these two concepts, this indicator offers traders a unique perspective on market volatility and potential support/resistance levels.
How It Works
Core Concept : The indicator calculates Bollinger Bands using a selected Fibonacci ratio. This ratio is applied to the standard deviation of the price series, providing a dynamic range around a Simple Moving Average (SMA).
Trading Strategies
Long Opportunities : The area below the lower band can be considered a potential zone for long positions. Prices in this zone may indicate an oversold market condition, suggesting a possible reversal or pullback.
Short Opportunities : Conversely, the area above the upper band might signal short-selling opportunities. Prices in this region could imply an overbought scenario, potentially leading to a price decline.
Versatility : Whether you're a day trader, swing trader, or long-term investor, this indicator adapts to various timeframes and assets, making it a versatile tool in your trading arsenal.
Conclusion
The 'Fibonacci Enhanced Bollinger Bands' indicator is designed for traders who wish to leverage the power of Fibonacci ratios in conjunction with the volatility insights provided by Bollinger Bands. It's an excellent tool for identifying potential reversal zones and refining entry and exit points. Try it out to enhance your market analysis and support your trading decisions with the combined wisdom of Fibonacci and Bollinger Bands.
Tìm kiếm tập lệnh với "弘历投教boll指标代码分析"

DBMA - Dual Bollinger Moving AverageThe Dual Bollinger moving average (DBMA) consists of a moving average (MA) & two Bollinger Bands (BB), with the color of the bands representing the level of price compression. In its default settings, it is a 20-day simple moving average with 2 upper Bollinger Bands, having the standard deviation (SD) settings of 0.5 & 1, respectively.
How close the price is to the moving average?
For a pullback trader, the entry point should be close to the moving average, preferably with price compression. How close should it be, is where the bands serve as a guide. The low of the pullback candle should be within the bands, that is, at least within the far band (1 SD of the MA), or even better if it's within the near band (0.5 SD). When the price is outside the bands, it should not be considered favourable for a pullback entry.
For how long has the price been closer to the moving average?
John Carter’s TTM Squeeze indicator looked at the relationship between Bollinger Bands and Keltner's Channels to help identify period of volatility contractions. Bollinger Bands being completely enclosed within the Keltner Channels is indicative of a very low volatility. This is a state of volatility contraction known as squeeze. Using different ATR lengths (1.0, 1.5 and 2.0) for Keltner Channels, we can differentiate between levels of squeeze (High, Mid & Low compression, respectively). Greater the compression, higher the potential for explosive moves.
The squeeze portion of the script is based on LazyBear's script ( Squeeze Momentum Indicator )
The High, Mid & Low compression squeezes are depicted via the color of the bands being red, orange, or yellow, respectively. With the low of the pullback candle within the bands, & the squeeze color changing to red, it should be considered favourable for a pullback entry.
Trailing the price with the lower bands
The lower bands can be used for trailing with the moving average. While trailing, once the price closes below the moving average, the trailing stoploss (TSL) is said to be triggered, & the trade is exited. Here we use the bands to give it some cushion. Let the price close below the 1SD band for labelling the TSL as being triggered to exit the trade. If the price closes below the MA but is still within the bands, the signal is to keep holding the trade.

Volatility Capture RSI-Bollinger - Strategy [presentTrading]- Introduction and how it is different
The 'Volatility Capture RSI-Bollinger - Strategy ' is a trading strategy that combines the concepts of Bollinger Bands (BB), Relative Strength Index (RSI), and Simple Moving Average (SMA) to generate trading signals. The uniqueness of this strategy is it calculates which is a dynamic level between the upper and lower Bollinger Bands based on the closing price. This unique feature allows the strategy to adapt to market volatility and price movements.
The market in Crypto and Stock are highly volatile, making them suitable for a strategy that uses Bollinger Bands. The RSI can help identify overbought or oversold conditions in this often speculative market.
BTCUSD 4hr chart
(700.hk) 3hr chart
Remember, the effectiveness of a trading strategy also depends on other factors such as the timeframe used, the specific settings of the indicators, and the overall market conditions. It's always recommended to backtest and paper trade a strategy before using it in live trading.
- Strategy, How it Works
Dynamic Bollinger Band: The strategy works by first calculating the upper and lower Bollinger Bands based on the user-defined length and multiplier. It then uses the Bollinger Bands and the closing price to dynamically adjust the presentBollingBand value. In the end, it generates a long signal when the price crosses over the present Bolling Band and a short signal when the price crosses under the present Bolling Band.
RSI: If the user has chosen to use RSI for signals, the strategy also calculates the RSI and its SMA, and uses these to generate additional long and short signals. The RSI-based signals are only used if the 'Use RSI for signals' option is set to true.
The strategy then checks the chosen trading direction and enters a long or short position accordingly. If the trading direction is set to 'Both', the strategy can enter both long and short positions.
Finally, the strategy exits a position when the close price crosses under the present Bolling Band for a long position, or crosses over the present Bolling Band for a short position.
- Trade direction
The strategy also includes a trade direction parameter, allowing the user to choose whether to enter long trades, short trades, or both. This makes the strategy adaptable to different market conditions and trading styles.
- Usage
1. Set the input parameters as per your trading preferences. You can choose the price source, the length of the moving average, the multiplier for the ATR, whether to use RSI for signals, the RSI and SMA periods, the bought and sold range levels, and the trading direction.
2. The strategy will then generate buy and sell signals based on these parameters. You can use these signals to enter and exit trades.
- Default settings
1. Source: hlc3
2. Length: 50
3. Multiplier: 2.7183
4. Use RSI for signals: True
5. RSI Period: 10
6. SMA Period: 5
7. Bought Range Level: 55
8. Sold Range Level: 50
9. Trade Direction: Both
- Strategy's default Properties
1. Default Quantity Type: 'strategy.percent_of_equity'
2. commission_value= 0.1, commission_type=strategy.commission.percent, slippage= 1: These parameters set the commission and slippage for the strategy. The commission is set to 0.1% of the trade value, and the slippage (the difference between the expected price of a trade and the price at which the trade is executed) is set to 1.
3. default_qty_type = strategy.percent_of_equity, default_qty_value = 15: These parameters set the default quantity for trades. The default_qty_type is set to strategy.percent_of_equity, which means that the size of each trade will be a percentage of the account equity. The default_qty_value is set to 15, which means that each trade will be 15% of the account equity.
4. initial_capital= 10000: This parameter sets the initial capital for the strategy to $10,000.

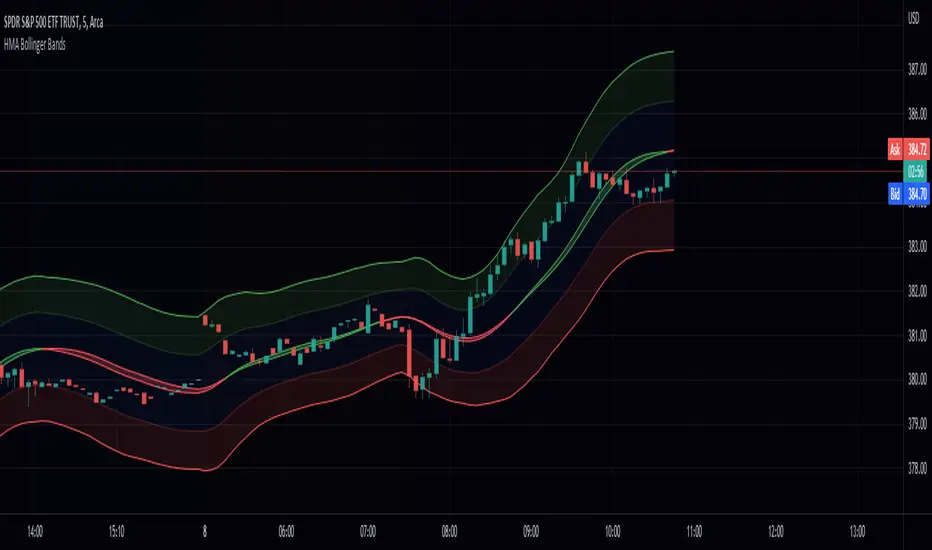
Volume Weighted Hull Moving Average Bollinger Bands (VWHBB)Title: "Volume Weighted Hull Moving Average Bollinger Bands Indicator for TradingView"
Abstract: This script presents a TradingView indicator that displays Bollinger Bands based on the volume weighted Hull Moving Average (VEHMA) of a financial asset. The VEHMA is a technical analysis tool that combines the reduced lag of the Hull Moving Average (HMA) with volume weighting to provide a more sensitive indicator of market trends and dynamics. The Bollinger Bands are a volatility indicator that plot upper and lower bands around a moving average, which can help traders identify potential trend changes and overbought or oversold conditions. The script allows the user to customize the VEHMA length and Bollinger Band deviation parameters.
Introduction: Bollinger Bands are a popular technical analysis tool used to identify potential trend changes and overbought or oversold conditions in the market. They are constructed by plotting upper and lower bands around a moving average, with the width of the bands determined by the volatility of the asset. The VEHMA is a variant of the Hull Moving Average (HMA) that combines the reduced lag of the HMA with volume weighting to provide a more sensitive indicator of market trends and dynamics.
Methodology: The VEHMA is calculated using a weighted average of two exponential moving averages (EMAs), with the weighting based on the volume of the asset and the length of the moving average. The Bollinger Bands are calculated by plotting the VEHMA plus and minus a standard deviation of the asset's price over a specified period. The standard deviation is a measure of the volatility of the asset and helps to adjust the width of the bands based on market conditions.
Implementation: The script is implemented in TradingView's PineScript language and can be easily added to any chart on the platform. The user can customize the VEHMA length and Bollinger Band deviation parameters to suit their trading strategy. The VEHMA, Bollinger Bands, and fill colors are plotted on the chart to provide a visual representation of the indicator.
Conclusion: The VEHMA Bollinger Bands indicator is a useful tool for traders looking to identify potential trend changes and overbought or oversold conditions in the market. This script provides a convenient and customizable implementation of the indicator for use in TradingView.

Power Of Stocks - Bollinger Band & 5Ema Indicator - Keanu_RiTz
Power of Stocks - Bollinger band & 5ema Strategy
In this script you get to take Buy/Sell trades using the 3 options mentioned below.(Alerts with price levels for buy/sell at , SL & Target are included in this one)
1. Combined Strategy :- uses confirmation from both strategies to trade.
2. Bollinger band Strategy :- use the Bollinger band Strategy to trade.
3. 5ema Strategy :- use the 5ema Strategy to trade.
1. Combined Strategy :-
for Selling :- we will go short/sell only when conditions of both strategies are satisfied.
i.e. when a candle is completely above the upper Bollinger band & completely above the 5ema then it will be our Alert Candle.
We Short/Sell only when the low of the Alert candle is broken or when the candle closes below the close of the Alert Candle.
SL will be above high of the Alert Candle. Target will be minimum 1:3 or as per your emotions.
for Buying:- we will go Long/Buy only when conditions of both strategies are satisfied.
i.e. when a candle is completely below the lower Bollinger band & completely below the 5ema then it will be our Alert Candle.
We go Long/Buy only when the high of the Alert candle is broken or when the candle closes above the close of the Alert Candle.
SL will be below low of the Alert Candle. Target will be minimum 1:3 or as per your emotions.
2. Power of Stocks - Bollinger Band Strategy :-
Bollinger band with standard deviation = 1.5
when a candle is completely above the upper Bollinger band, that candle will be called a signal/alert candle.
Initiate a Sell trade when that alert candles low is broken. SL will be above high of that alert candle.
Risk to reward ratio will be 1:4 i.e. target will be 4 times the SL.
when a candle is completely below the lower Bollinger band, that candle will be called a signal/alert candle.
Initiate a Buy trade when that alert candles high is broken. SL will be below low of that alert candle.
Risk to reward ratio will be 1:4 i.e. target will be 4 times the SL.
other rules for Options buying:- minimum 15min timeframe
The day you initiate the position , you should be in profit above 10%-15% then only you should carry forward that position overnight, otherwise squareoff your trade on that day only.
Buy ATM or slightly OTM, SL max 100 points , target 1:4
for Long-term/Investing :- Minimum Weekly
If candle is outside the lower band then initiate a Buy trade when that candles High is broken. Sl will be below Low of that candle.
for Long-term Target will be according to your emotions.
3. Power of Stocks - 5ema Strategy (target minimum 1:3)
Timeframe -
5 min for Selling (Sell Futures/index/stocks or buy Put)
15 min for Buying (Buy Futures/index/stocks or sell Put)
for selling stocks :-
you should enter trade within 10am , don't look for entries after that time. take only 2 entries a day.
for selling Index(Banknifty) :-
you can take trade at anytime of the day whenever conditions get satisfied. you can take multiple entries in banknifty as it is very volatile.
for options choose atm strikes: selling trade
sl for premium between 200-300 :- 20-30 points SL
sl for premium between 400-500 :- 40-50 points SL
sl for premium between 500-600 :- 50-60 points SL
Subhashish Pani's (power of stocks) 5 EMA Strategy:-
It plots 5 EMA and Buy/Sell signals with Target & Stoploss levels.
What is Subhashish Pani's (power of stocks) 5 EMA Strategy :-
His strategy is very simple to understand. for intraday use 5 minutes timeframe for selling. You can sell futures, sell call or buy Puts in selling strategy.
What this strategy tries to do is , it tries to catch the tops, so when you sell at top & it turns out to be a reversal point then you can get good profit.
this will hit stop losses often, but stop losses are small and minimum target should be 1:3. but if you stay with the trend you can get big profits.
According to Subhashish Pani this strategy has 60% success rate.
Strategy for Selling (Short future/Call/stock or buy Put)
When ever a Candle closes completely above 5 ema (no part of candle should be touching the 5ema), then that candle should be considered as Alert Candle.
If the next candle is also completely above 5 ema and it has not broken the low of previous alert candle, Then the previous Alert Candle should be ignored and the new candle should be considered as new Alert Candle.
so if this goes on then continue shifting the Alert Candle, but whenever the next candle breaks the low of the Alert Candle we should take the Short trade (Short future/Call/stock or buy Put).
Stoploss will be above high of the Alert Candle and minimum target will be 1:3.
Strategy for Buying (Buy future/Call/stock or sell Put)
When ever a Candle closes completely below 5 ema (no part of candle should be touching the 5ema), then that candle should be considered as Alert Candle.
If the next candle is also completely below 5 ema and it has not broken the high of previous alert candle, Then the previous Alert Candle should be ignored and the new candle should be considered as new Alert Candle.
so if this goes on then continue shifting the Alert Candle, but whenever the next candle breaks the high of the Alert Candle we should take the Long trade (Buy future/Call/stock or sell Put).
Stoploss will be below low of the Alert Candle and minimum target will be 1:3.
Buy/Sell with extra conditions :
it just adds 1 more condition to buying/selling
1. checks if closing of current candle is lower than alert candles closing for Selling & checks if closing of current candle is higher than alert candles closing for Buyling.
This can sometimes save you from false moves but by using this, you can also miss out on big moves as you'll enter trade after candle closing instead of entering at break of high/low.
Note :- According to Subhashish Pani Timeframe for intraday buying should be 15 minutes Timeframe.
If you haven't understood the strategy by reading above description, then search for "Subhashish Pani's (power of stocks) 5 EMA Strategy" on YouTube to get a deeper understanding.
Note:- This is not only for Intraday trading , you can use this strategy for Positional/Swing trading as well. If you use this on Monthly Timeframe then it can be very good for Long Term Investing as well.
Rules will be same for all types of trades & Timeframes.

EMA bands + leledc + bollinger bands trend following strategy v2The basics:
In its simplest form, this strategy is a positional trend following strategy which enters long when price breaks out above "middle" EMA bands and closes or flips short when price breaks down below "middle" EMA bands. The top and bottom of the middle EMA bands are calculated from the EMA of candle highs and lows, respectively.
The idea is that entering trades on breakouts of the high EMAs and low EMAs rather than the typical EMA based on candle closes gives a bit more confirmation of trend strength and minimizes getting chopped up. To further reduce getting chopped up, the strategy defaults to close on crossing the opposite EMA band (ie. long on break above high EMA middle band and close below low EMA middle band).
This strategy works on all markets on all timeframes, but as a trend following strategy it works best on markets prone to trending such as crypto and tech stocks. On lower timeframes, longer EMAs tend to work best (I've found good results on EMA lengths even has high up to 1000), while 4H charts and above tend to work better with EMA lengths 21 and below.
As an added filter to confirm the trend, a second EMA can be used. Inputting a slower EMA filter can ensure trades are entered in accordance with longer term trends, inputting a faster EMA filter can act as confirmation of breakout strength.
Bar coloring can be enabled to quickly visually identify a trend's direction for confluence with other indicators or strategies.
The goods:
Waiting for the trend to flip before closing a trade (especially when a longer base EMA is used) often leaves money on the table. This script combines a number of ways to identify when a trend is exhausted for backtesting the best early exits.
"Delayed bars inside middle bands" - When a number of candle's in a row open and close between the middle EMA bands, it could be a sign the trend is weak, or that the breakout was not the start of a new trend. Selecting this will close out positions after a number of bars has passed
"Leledc bars" - Originally introduced by glaz, this is a price action indicator that highlights a candle after a number of bars in a row close the same direction and result in greatest high/low over a period. It often triggers when a strong trend has paused before further continuation, or it marks the end of a trend. To mitigate closing on false Leledc signals, this strategy has two options: 1. Introducing requirement for increased volume on the Leledc bars can help filter out Leledc signals that happen mid trend. 2. Closing after a number of Leledc bars appear after position opens. These two options work great in isolation but don't perform well together in my testing.
"Bollinger Bands exhaustion bars" - These bars are highlighted when price closes back inside the Bollinger Bands and RSI is within specified overbought/sold zones. The idea is that a trend is overextended when price trades beyond the Bollinger Bands. When price closes back inside the bands it's likely due for mean reversion back to the base EMA in which this strategy will ideally re-enter a position. Since the added RSI requirements often make this indicator too strict to trigger a large enough sample size to backtest, I've found it best to use "non-standard" settings for both the bands and the RSI as seen in the default settings.
"Buy/Sell zones" - Similar to the idea behind using Bollinger Bands exhaustion bars as a closing signal. Instead of calculating off of standard deviations, the Buy/Sell zones are calculated off multiples of the middle EMA bands. When trading beyond these zones and subsequently failing back inside, price may be due for mean reversion back to the base EMA. No RSI filter is used for Buy/Sell zones.
If any early close conditions are selected, it's often worth enabling trade re-entry on "middle EMA band bounce". Instead of waiting for a candle to close back inside the middle EMA bands, this feature will re-enter position on only a wick back into the middle bands as will sometimes happen when the trend is strong.
Any and all of the early close conditions can be combined. Experimenting with these, I've found can result in less net profit but higher win-rates and sharpe ratios as less time is spent in trades.
The deadly:
The trend is your friend. But wouldn't it be nice to catch the trends early? In ranging markets (or when using slower base EMAs in this strategy), waiting for confirmation of a breakout of the EMA bands at best will cause you to miss half the move, at worst will result in getting consistently chopped up. Enabling "counter-trend" trades on this strategy will allow the strategy to enter positions on the opposite side of the EMA bands on either a Leledc bar or Bollinger Bands exhaustion bar. There is a filter requiring either a high/low (for Leledc) or open (for BB bars) outside the selected inner or outer Buy/Sell zone. There are also a number of different close conditions for the counter-trend trades to experiment with and backtest.
There are two ways I've found best to use counter-trend trades
1. Mean reverting scalp trades when a trend is clearly overextended. Selecting from the first 5 counter-trend closing conditions on the dropdown list will usually close the trades out quickly, with less profit but less risk.
2. Trying to catch trends early. Selecting any of the close conditions below the first 5 can cause the strategy to behave as if it's entering into a new trend (from the wrong side).
This feature can be deadly effective in profiting from every move price makes, or deadly to the strategy's PnL if not set correctly. Since counter-trend trades open opposite the middle bands, a stop-loss is recommended to reduce risk. If stop-losses for counter-trend trades are disabled, the strategy will hold a position open often until liquidation in a trending market if th trade is offsides. Note that using a slower base EMA makes counter-trend stop-losses even more necessary as it can reduce the effectiveness of the Buy/Sell zone filter for opening the trades as price can spend a long time trending outside the zones. If faster EMAs (34 and below) are used with "Inner" Buy/Zone filter selected, the first few closing conditions will often trigger almost immediately closing the trade at a loss.
The niche:
I've added a feature to default into longs or shorts. Enabling these with other features (aside from the basic long/short on EMA middle band breakout) tends to break the strategy one way or another. Enabling default long works to simulate trying to acquire more of the asset rather than the base currency. Enabling default short can have positive results for those high FDV, high inflation coins that go down-only for months at a time. Otherwise, I use default short as a hedge for coins that I hold and stake spot. I gain the utility and APR of staking while reducing the risk of holding the underlying asset by maintaining a net neutral position *most* of the time.
Disclaimer:
This script is intended for experimenting and backtesting different strategies around EMA bands. Use this script for your live trading at your own risk. I am a rookie coder, as such there may be errors in the code that cause the strategy to behave not as intended. As far as I can tell it doesn't repaint, but I cannot guarantee that it does not. That being said if there's any question, improvements, or errors you've found, drop a comment below!

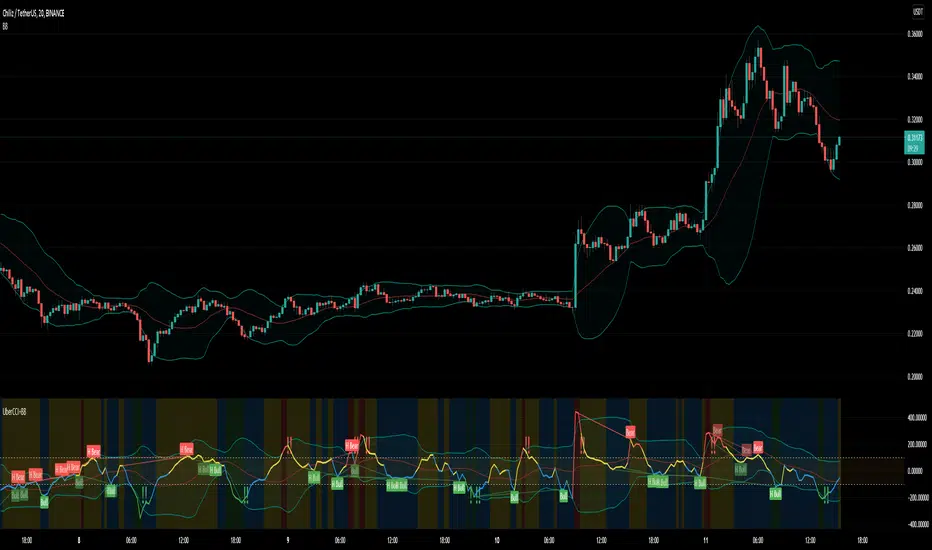
Uber Dank CCI + Captain Beefheart Bollinger Bands ExtraordinareIntroducing, the Uber Dank CCI + Captain Beefheart Bollinger Bands Extraordinaire
Its bollinger bands, CCI and CCI Bollinger Bands all in one.
The color of the CCI shows the condition of the bollinger band on chart.
Close > upper band = red
Close > basis = yellow
Close < basis = blue
Close < lower band = green
Then a bollinger band is printed on the CCI itself,
The background color displays the condition of the CCI bollinger band by the same logic as the CCI color.
CCI > upper band = red
CCI > basis = yellow
CCI < basis = blue
CCI < lower band = green
The exclamation marks tell you when the conditions are coming to an end. They check the last two bars to see if both the CCI and the closing price are under their bollinger bands at the same time for at least one of those bars, and they check the current bar that at least one of those conditions has ended. That is why they will most often print two exclamation marks in a row.
Overlay Indicators (EMAs, SMAs, Ichimoku & Bollinger Bands)This is a combination of popular overlay indicators that are used for dynamic support and resistance, trade targets and trend strength.
Included are:
-> 6 Exponential Moving Averages
-> 6 Simple Moving Averages
-> Ichimoku Cloud
-> Bollinger Bands
-> There is also a weekend background marker ideal for cryptocurrency trading
Using all these indicators in conjunction with each other provide great confluence and confidence in trades and price targets.
An explanation of each indicator is listed below.
What Is an Exponential Moving Average (EMA)?
"An exponential moving average (EMA) is a type of moving average (MA) that places a greater weight and significance on the most recent data points. The exponential moving average is also referred to as the exponentially weighted moving average. An exponentially weighted moving average reacts more significantly to recent price changes than a simple moving average (SMA), which applies an equal weight to all observations in the period.
What Does the Exponential Moving Average Tell You?
The 12- and 26-day exponential moving averages (EMAs) are often the most quoted and analyzed short-term averages. The 12- and 26-day are used to create indicators like the moving average convergence divergence (MACD) and the percentage price oscillator (PPO). In general, the 50- and 200-day EMAs are used as indicators for long-term trends. When a stock price crosses its 200-day moving average, it is a technical signal that a reversal has occurred.
Traders who employ technical analysis find moving averages very useful and insightful when applied correctly. However, they also realize that these signals can create havoc when used improperly or misinterpreted. All the moving averages commonly used in technical analysis are, by their very nature, lagging indicators."
Source: www.investopedia.com
Popular EMA lookback periods include fibonacci numbers and round numbers such as the 100 or 200. The default values of the EMAs in this indicator are the most widely used, specifically for cryptocurrency but they also work very well with traditional.
EMAs are normally used in conjunction with Simple Moving Averages.
" What Is Simple Moving Average (SMA)?
A simple moving average (SMA) calculates the average of a selected range of prices, usually closing prices, by the number of periods in that range.
Simple Moving Average vs. Exponential Moving Average
The major difference between an exponential moving average (EMA) and a simple moving average is the sensitivity each one shows to changes in the data used in its calculation. More specifically, the EMA gives a higher weighting to recent prices, while the SMA assigns an equal weighting to all values."
Source: www.investopedia.com
In this indicator, I've included 6 popular moving averages that are commonly used. Most traders will find specific settings for their own personal trading style.
Along with the EMA and SMA, another indicator that is good for finding confluence between these two is the Ichimoku Cloud.
" What is the Ichimoku Cloud?
The Ichimoku Cloud is a collection of technical indicators that show support and resistance levels, as well as momentum and trend direction. It does this by taking multiple averages and plotting them on the chart. It also uses these figures to compute a "cloud" which attempts to forecast where the price may find support or resistance in the future.
The Ichimoku cloud was developed by Goichi Hosoda, a Japanese journalist, and published in the late 1960s.1 It provides more data points than the standard candlestick chart. While it seems complicated at first glance, those familiar with how to read the charts often find it easy to understand with well-defined trading signals."
More info can be seen here: www.investopedia.com
I have changed the default settings on the Ichimoku to suit cryptocurrency trading (as cryptocurrency is usually fast and thus require slightly longer lookbacks) to 20 60 120 30.
Along with the Ichimoku, I like to use Bollinger Bands to not only find confluence for support and resistance but for price discovery targets and trend strength.
" What Is a Bollinger Band®?
A Bollinger Band® is a technical analysis tool defined by a set of trendlines plotted two standard deviations (positively and negatively) away from a simple moving average (SMA) of a security's price, but which can be adjusted to user preferences.
Bollinger Bands® were developed and copyrighted by famous technical trader John Bollinger, designed to discover opportunities that give investors a higher probability of properly identifying when an asset is oversold or overbought."
This article goes into great detail of the complexities of using the Bollinger band and how to use it.
=======
This indicator combines all these powerful indicators into one so that it is easier to input different settings, turn specific tools on or off and can be easily customised.

Price Volume Strength ComparatorBollinger bands says whether price or any source is relatively high or low at any particular point of time. We can apply Bollinger bands on RSI and volume indicator Price Volume Trend to identify if RSI movement or PVT movement is relatively high or low.
By calculating Bollinger %B, we can define the variation in a range between 0 to 1. By applying Bollinger %B on price, volume and strength, we are trying to compare how much they differ relative to each other.
For example, if Bollinger %B of volume is higher than Bollinger %B of price, which may mean, we can still expect continuation of upward movement. If volume %B is lesser, we can interpret this as price has moved more than the volume and may retrace back.
Note: I tried adding multiple volume/strength indicators as input choice. But, if condition did not work with simple string. Have no idea why. I will try adding that later if more people show interest.

Double Bollinger Bands strategyLong Trade Setups:
To go long (to buy), you have to wait for one of the candlesticks to close above the BB upper band. (background color is green)
Short Trade Setups:
To go short (to sell), you have to wait for one of the candlesticks to close below the BB lower band. (background color is red)
How To Maximize Your Profit?
As I explained above, this trading system is good in catching the trends. Therefore, you’d better to take the advantage of the strong movements and maximize your profit.
When there is a strong trade setup, you can also take two positions with the same stop loss, when there is a trade setup based on the Double Bollinger Bands trading system. Set a 2 x SL target for the first position, and no target for the second one. If the first position hits the target, move the second’s position stop loss to breakeven and hold it (TLDR : Hold a sell as long as background is red)
In case of a long position, hold the second position as long as the candlesticks form between the BB1 and BB2 upper bands, or above the Bollinger Middle Band. Close the second position when candlesticks start crossing the BB1 upper bands, or when one of the candlesticks breaks below the Bollinger Middle Band . (TLDR : Holda buy as long as background is green)

Luckscout's Double Bollinger Bands StrategyLong Trade Setups:
To go long (to buy), you have to wait for one of the candlesticks to close above the BB upper band. (background color is green)
Short Trade Setups:
To go short (to sell), you have to wait for one of the candlesticks to close below the BB lower band. (background color is red)
How To Maximize Your Profit?
As I explained above, this trading system is good in catching the trends. Therefore, you’d better to take the advantage of the strong movements and maximize your profit.
When there is a strong trade setup, you can also take two positions with the same stop loss, when there is a trade setup based on the Double Bollinger Bands trading system. Set a 2 x SL target for the first position, and no target for the second one. If the first position hits the target, move the second’s position stop loss to breakeven and hold it (TLDR : Hold a sell as long as background is red)
In case of a long position, hold the second position as long as the candlesticks form between the BB1 and BB2 upper bands, or above the Bollinger Middle Band. Close the second position when candlesticks start crossing the BB1 upper bands, or when one of the candlesticks breaks below the Bollinger Middle Band . (TLDR : Holda buy as long as background is green)
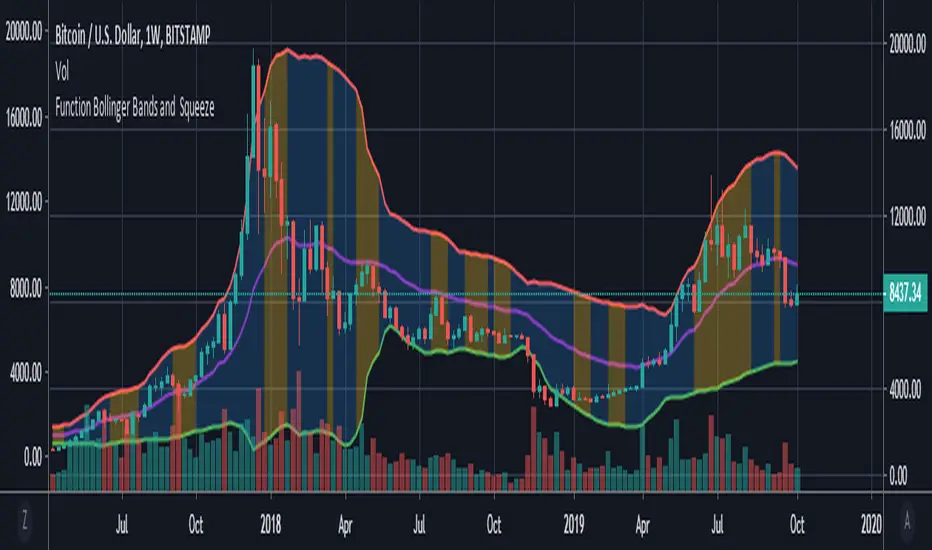
Function : Bollinger Bands and BBW Squeeze DetectorThis script shows Bollinger Bands function and want to detect Bollinger Band Width Squeeze with a successful, different perspective .
Bollinger Bands : You can specify the Bollinger Bands periods as mutable variables .
Bollinger Band Width Squeeze : First the Bollinger bands width was calculated.The width was then divided into levels using the money flow index.
Thus, the bollinger takes into account the available volume averages when calculating the band width mfi (Money Flow Index).
After this modelling, we can limit and color the lower limit and upper limits just as Relative Strength Index.
We can even put warnings on oversold areas if desired. Let's not forget that we are working with width rather than price.
By design, squeeze areas are defined directly above the Bollinger Bands with coloration. I think it is very practical and looks stylish.
I tried and found it quite successful and wanted to share it with users.
I came up with many ideas when I wrote this system, and I will share them very soon . I hope it will be useful to users and give new ideas.
Best regards.
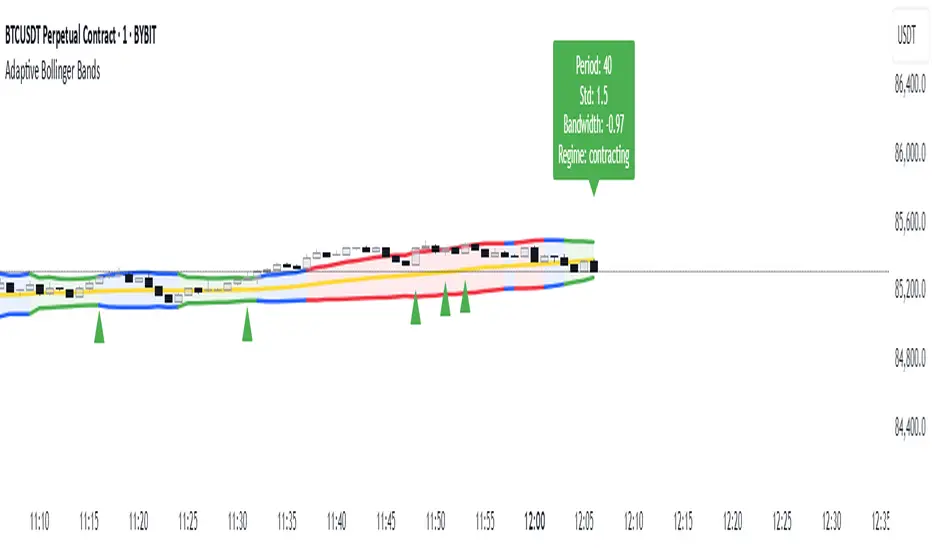
Adaptive Bollinger BandsAdaptive Bollinger Bands
This indicator displays Bollinger Bands with parameters that dynamically adjust based on market volatility. Unlike standard Bollinger Bands with fixed parameters, this version adaptively modifies both the period and standard deviation multiplier in real-time based on measured market conditions.
Key Features
Dynamic adjustment of period and standard deviation based on normalized volatility
Color-coded visualization of current volatility regime (expanding, normal, contracting)
Integration with Keltner Channels for band refinement
Bandwidth analysis for volatility regime identification
Optional on-chart parameter labels showing current settings
Band cross alerts and visual markers
Volatility Visualization
The indicator uses color-coding to display different volatility regimes:
Red: Expanding volatility regime (higher measured volatility)
Blue: Normal volatility regime (average measurements)
Green: Contracting volatility regime (lower measured volatility)
Technical Information
The indicator calculates volatility by analyzing price returns over a configurable lookback period (default 50 bars). The standard deviation of returns is normalized against historical extremes to create an adaptive scaling factor.
Band adaptation occurs through two primary mechanisms:
1. Period adjustment: Higher volatility uses shorter periods (more responsive), while lower volatility uses longer periods (more stable)
2. Standard deviation multiplier adjustment: Higher volatility increases the multiplier (wider bands), while lower volatility decreases it (tighter bands)
The middle band uses a simple moving average with the adaptive period. Additional refinement occurs through Keltner Channel integration, which can tighten bands when contained within Keltner boundaries.
Volatility regimes are determined by analyzing Bollinger Bandwidth relative to its recent history, providing contextual information about the current market state.
Settings Customization
The indicator provides extensive customization options:
- Base parameters (period and standard deviation)
- Adaptive range limits (min/max period and standard deviation)
- Keltner Channel parameters for band refinement
- Bandwidth analysis settings
- Display options for visual elements
Limitations and Considerations
All technical indicators have inherent limitations and should not be used in isolation
Past performance does not guarantee future results
The indicator requires sufficient historical data for proper volatility normalization
Smaller timeframes may produce more noise in the adaptive calculations
Parameters may require adjustment for different markets and trading styles
Band crosses are not trading signals on their own and should be evaluated with other factors
This indicator is designed to provide objective information about market volatility conditions and potential support/resistance zones. Always combine with other analysis methods within a comprehensive trading approach.
Pivot Bollinger BandThis is a special kind of Bollinger Bands indicator that adapts to the market's pivot points. Instead of using regular price data, it first finds important swing highs and lows in the market (called pivot points). It then uses these pivot points to create a center line, which is like a moving average of where the market is pivoting.
Around this center line, it draws the classic Bollinger Bands - an upper and lower band that show where prices might find resistance or support. The distance between these bands changes based on market volatility, just like regular Bollinger Bands. You can adjust how sensitive it is to pivot points and how wide the bands should be.
By using pivot point based Bollinger Bands, we expect band breakout can be captured more effectively.

Squeeze Range: Bollinger Bands / Keltner Channels [Whvntr]Presenting Squeeze Range: Bollinger Bands / Keltner Channels
TTMSqueeze method is a volatility and momentum indicator introduced by John Carter of Simpler Trading, which capitalizes on the tendency for price to break out strongly after consolidating in a tight trading range.
How did I make this indicator? The Bollinger Bands & Keltner Channels base scripts are from the standard indicators of their class in the Technicals section... I made this indicator first then noticed there were 3 others with a similar concept, but this differs in it's unique features and application of the TTMSqueeze strategy. This indicator plots the True Range of the Keltner Channel (Customizable in 'Bands Style" in the Inputs Menu) the instances the Bollinger Bands are within the range of the Keltner channel (the market just entered a squeeze).
Featuring: customizable Moving Averages
1. Exponential (Default for both BB & KC)
2. Simple
3. RMA (MA used in RSI )
Keltner channels have a multiplier of 2 & 3 on the Chart (3 being the outer).
How do I use this indicator? Once the teal dots are inside the solid red lines this would indicate that TTMperiod of low market volatility (the market is preparing itself for an explosive move up or down). Do some research and study how to use the TTMSqueeze method by John Carter. Disclaimer: not a guarantee of future favorable results.

Hull Moving Average Bollinger Bands (HMABB)Hello! This is simply Bollinger Bands calculated with HMA! Heres a recap on both.
The Hull Moving Average (HMA) attempts to minimize the lag of a traditional moving average while retaining the smoothness of the moving average line. Developed by Alan Hull in 2005, this indicator makes use of weighted moving averages to prioritize more recent values and greatly reduce lag.
Bollinger Bands are envelopes plotted at a standard deviation level above and below a simple moving average of the price. Because the distance of the bands is based on standard deviation, they adjust to volatility swings in the underlying price. Bollinger Bands use 2 parameters, Period and Standard Deviations, StdDev.
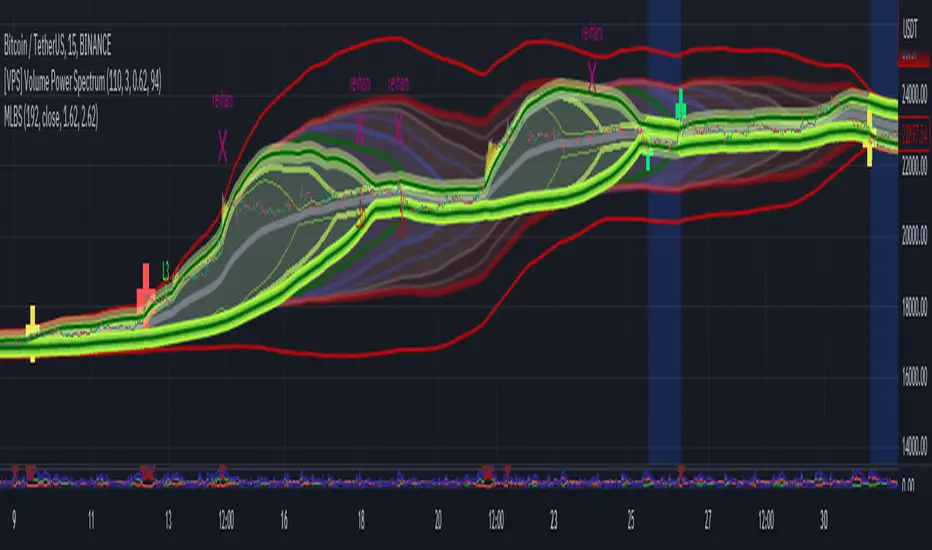
[Floride] 4 Layers of Bollinger Shadow
This is the indicator I named 4LBS. That means four layers of bollinger shadow.
This is an indicator that I made to see how far past prices could affect the future prices.
And I found some very interesting and beautiful things about it, and I wanted to share them with you, so I publish this indicator.
*-*-*-*-*-*-*-*-*-*-*-*-*-*-*-*-*-*-*-*-*-*-*-*-*-*-*-*-*-*-*-*-*-*-*-*-*-*-*-*-*-*-*-*-*-*-*-*-*-*-*-*-*-*-*-*-*-*-*-*-*-*-*-*-*-
Hello, nice to meet you all. my name as a trader is Floride.
First of all, I am not good at English, so there may be many grammatically incorrect sentences below.
I ask for your understanding in advance. Thanks for your understanding.
*-*-*-*-*-*-*-*-*-*-*-*-*-*-*-*-*-*-*-*-*-*-*-*-*-*-*-*-*-*-*-*-*-*-*-*-*-*-*-*-*-*-*-*-*-*-*-*-*-*-*-*-*-*-*-*-*-*-*-*-*-*-*-*-*-
What is it?
bollinger Bands usually has one moving average line. And there's two bands that uses same period value of standard deviation as the former MA. And this indicator, by the way, has a 4 shadow bands
that uses twice,three,four,five time the value of the MA's period.
Appearance -
This indicator has four layers, and there are also other layers between them.
You can turn on or off all the shadow layers.
Uses of Indicator and Examples
examples of actual use
1. market strongness diagnosis
-It seems all layers of shadow has some degree resist/support forces.
This indicator has the 4th layer - "L4". (indicated by red lines).
I saw emergence of volatility quite frequently when this last layer breaks through.
When price breaks through this area or line, shade appear on the L4 layer in red. and red cross appear on the that point. This is I called Marlin signal.
If you saw red color shadow in this indicator, then the market may have quite high volatility.
(of course, there's not 100%. Please be careful about this.)
But I've also checked in quite several markets. when this volatility emerges, then also that market seems to started to building quite directional power afterwards.
I mean, after the marlin signal, market tends to have bigger volatility, and tends to go one direction.
again, it's not 100%. but probability is quite high.
But maybe depending on the type of market you need some adjustment.
Recommended values are M2-1.618, M3-2.618
Or M2-1, M3-2. default value is M2-1.618, M3-2.618
and also, if prices breakthrough the channels, or layers, It tends to break through the at once, in first bar. In other words, if price don't break through the first or second candle, it's very likely that the price won't break through channel for the time being.
2. market weakness diagnosis
Usually, without external momentum, the price converges to the average value and does not deviate from the band. And if price fails to break through the most inner first layer-"L1 - the green channel", In that case, the market is usually assumed to be weak, or has low volatility.
- you can set alarms on tuna, marlin signal. and you don't have to watch chart all the time.
3. Signals
I put two signals in this indicator.
One has the name "Tuna," and the second has the name "Marlin."
As you can already tell from the name's feeling, tuna is a weaker signal and marlin is a stronger signal.
Actual example of a signal
1. Tuna signal
- When the tuna signal appears, you can guess that the current market is generally not weak. or has quite good directional force. or medium volatility.
Below is important.
- If a tuna signal appears, there is a possibility that a marlin will appear later.
- In my opinion, it might be wise not to have a position without a tuna signal.
- Almost all of the marlin signal appeared shortly after the tuna signal appeared.
2. Marlin signal
- When marlin signal appears, with a high probability, volatility can increase large.
- In the backtesting of the stock, in some cases, the market moved quite frequently in the direction of the marlin signal.
- The emergence of marlin can be seen as a pretty strong indication of the emergences of direction.
Percentile Rank of Bollinger BandsThis simple indicator provides you three useful information with Bollinger Bands:
How wide the current width (standard deviation) of the Bollinger Band is.
Compared to the widths in the past, is the current width relatively small or big? Value is expressed in percentile format.
What the "relative position of current price" to the current Bollinger Band is.
This indicator can be useful to identify whether the Bollinger Band has substantially "expanded" or "squeezed."
First, divide the current standard deviation by the current price, we get the current width. The current width is displayed by the columns at the bottom. When the current width becomes wider, the column becomes taller, and the color is dark green. On the contrary, if the width becomes narrower, the column becomes shorter and the color is light green.
Next, compare the current width with the previous N widths, we get the percentile rank for the current width. The percentile rank is shown by the thicker line graph. When the percentile rank grows, it is green; whereas when the rank declines, the color is red.
Lastly, calculate (close - lower)/(upper - lower) and we get an idea of the relative height of the current price, compared to the upper and lower band. This is displayed by the thinner line graph. When the relative position becomes higher, the color is in aqua. It is in blue when the relative position becomes lower. Note that since closing prices can go above the upper band or go below the lower band, the values may be greater than 100 or less than 0.

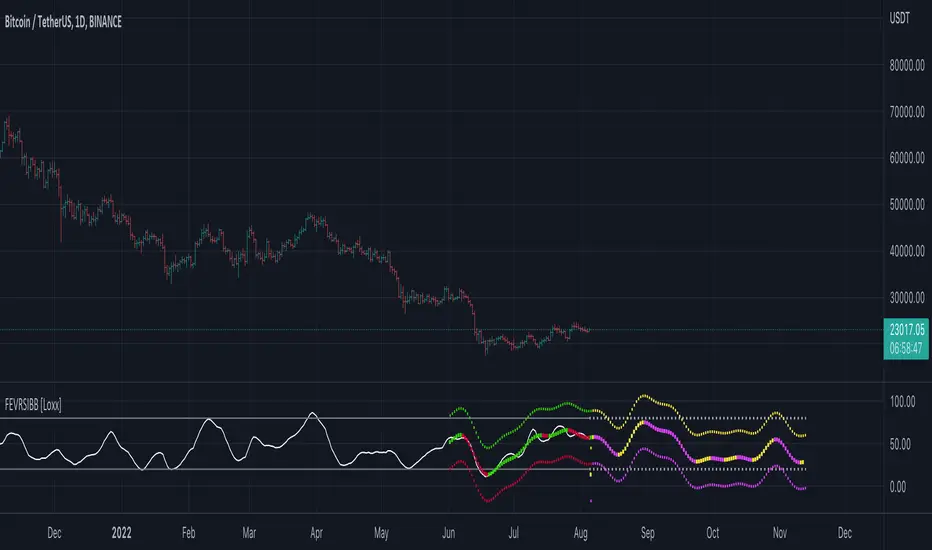
Fourier Extrapolator of Variety RSI w/ Bollinger Bands [Loxx]Fourier Extrapolator of Variety RSI w/ Bollinger Bands is an RSI indicator that shows the original RSI, the Fourier Extrapolation of RSI in the past, and then the projection of the Fourier Extrapolated RSI for the future. This indicator has 8 different types of RSI including a new type of RSI called T3 RSI. The purpose of this indicator is to demonstrate the Fourier Extrapolation method used to model past data and to predict future price movements. This indicator will repaint. If you wish to use this for trading, then make sure to take a screenshot of the indicator when you enter the trade to save your analysis. This is the first of a series of forecasting indicators that can be used in trading. Due to how this indicator draws on the screen, you must choose values of npast and nfut that are equal to or less than 200. this is due to restrictions by TradingView and Pine Script in only allowing 500 lines on the screen at a time. Enjoy!
What is Fourier Extrapolation?
This indicator uses a multi-harmonic (or multi-tone) trigonometric model of a price series xi, i=1..n, is given by:
xi = m + Sum( a*Cos(w*i) + b*Sin(w*i), h=1..H )
Where:
xi - past price at i-th bar, total n past prices;
m - bias;
a and b - scaling coefficients of harmonics;
w - frequency of a harmonic ;
h - harmonic number;
H - total number of fitted harmonics.
Fitting this model means finding m, a, b, and w that make the modeled values to be close to real values. Finding the harmonic frequencies w is the most difficult part of fitting a trigonometric model. In the case of a Fourier series, these frequencies are set at 2*pi*h/n. But, the Fourier series extrapolation means simply repeating the n past prices into the future.
This indicator uses the Quinn-Fernandes algorithm to find the harmonic frequencies. It fits harmonics of the trigonometric series one by one until the specified total number of harmonics H is reached. After fitting a new harmonic , the coded algorithm computes the residue between the updated model and the real values and fits a new harmonic to the residue.
see here: A Fast Efficient Technique for the Estimation of Frequency , B. G. Quinn and J. M. Fernandes, Biometrika, Vol. 78, No. 3 (Sep., 1991), pp . 489-497 (9 pages) Published By: Oxford University Press
The indicator has the following input parameters:
src - input source
npast - number of past bars, to which trigonometric series is fitted;
Nfut - number of predicted future bars;
nharm - total number of harmonics in model;
frqtol - tolerance of frequency calculations.
Included:
Loxx's Expanded Source Types
Loxx's Variety RSI
Other indicators using this same method
Fourier Extrapolator of Price w/ Projection Forecast
Fourier Extrapolator of Price
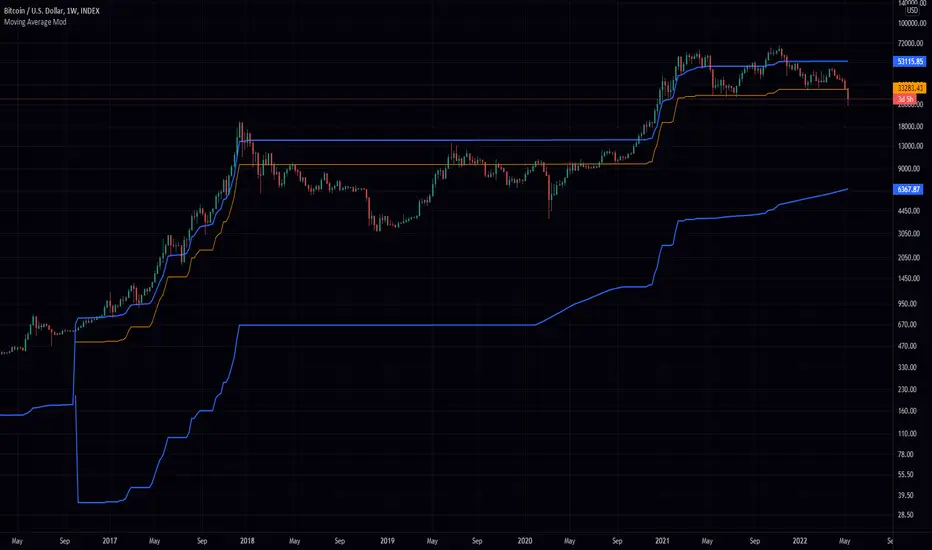
Greedy MA & Greedy Bollinger Bands This moving average takes all of the moving averages between 1 and 700 and takes the average of them all. It also takes the min/max average (donchian) of every one of those averages. Also included is Bollinger Bands calculated in the same way. One nice feature I have added is the option to use geometric calculations for. I also added regular bb calculations because this can be a major hog. Use this default setting on 1d or 1w. Enjoy!
ps, I call it greedy because the default settings wont work on lower time frames
Sideways Strategy DMI + Bollinger Bands (by Coinrule)Markets don’t always trade in a clear direction. At a closer look, most of the time, they move sideways. Relying on trend-following strategies all the time can thus lead to repeated false signals in such conditions.
However, before you can safely trade sideways, you have to identify the most suitable market conditions.
The main features of such strategies are:
Short-term trades, with quick entries and quick exits
Slightly contrarian and mean-reversionary
Require some indicator that tells you it’s a sideways market
This Sideways DMI + Bollinger Bands strategy incorporates such features to bring you a profitable alternative when the regular trend-following systems stop working.
ENTRY
1. The trading system requires confirmation for a sideways market from the Directional Movement Index (DMI) before you can start opening any trades. For this purpose, the strategy uses the absolute difference between positive and negative DMI, which must be lower than 20.
2. To pick the right moment to buy, the strategy looks at the Bollinger Bands (BB). It enters the trade when the price crosses over the lower BB.
EXIT
The strategy then exits when the move has been exhausted. Generally, in sideways markets, the price should revert lower. The position is closed when the price crosses back down below the upper BB.
The best time frame for this strategy based on our backtest is the 1-hr. Shorter timeframes can also work well on certain coins that are more volatile and trade sideways more often. However, as expected, these exhibit larger volatility in their returns. In general, this approach suits medium timeframes. A trading fee of 0.1% is taken into account. The fee is aligned to the base fee applied on Binance, which is the largest cryptocurrency exchange.
You can execute this strategy on your favourite exchange at coinrule.com.

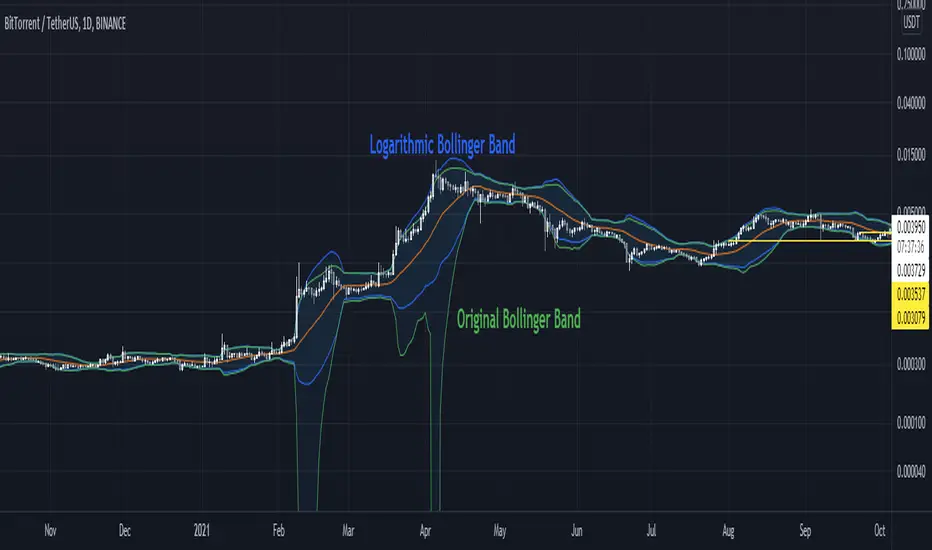
Logarithmic Bollinger BandsThe existing Bollinger Bands simply used price to derive the standard deviation.
In other words, whether an asset goes up or down by $50 from $100, it counts at the same "50$".
But in the asset market, an increase of $50 and a fall of $50 have different values.
To eliminate this difference using a logarithmic function, a new Bollinger Band was created.
Green is the original Bollinger Band.
As mentioned above, a sharp lower band is formed by calculating the rise and fall of an asset with the same value.
Blue is the Logarithmic Bollinger band.
Please make this indicator useful!
기존의 볼린저 밴드는 단순하게 가격을 이용해 표준편차를 도출해내었습니다.
즉 자산이 100$에서 50$이 오르든 내리든 같은 "50$"로 계산한 것입니다.
하지만 자산시장에서 50$이 오르는 것과 50$이 내리는 것은 다른 가치를 가집니다.
이 차이를 로그함수를 이용해 없애보고자 하였고, 새로운 볼린저밴드를 만들었습니다.
초록색이 기존의 볼린저밴드입니다.
위에서 말했듯이 자산의 오르내림을 같은 가치로 계산해서 급격한 아래 밴드가 형성됩니다.
파란색이 로그 볼린저밴드입니다.
이 지표를 유용하게 사용해주세요!
2 Multi-Timeframe Bollinger BandsThis is two separate Bollinger bands in one study. Customizable middle BB line type ( SMA , EMA , VWMA ), legnth, colors, and deviations provided at .5 increments.
Someone else has a very similar Bollinger Band study but the code was hidden, so I figured I would remake as a learning challenge since I'm new to pinescript and this is the best way to learn it imo.
There will be updates to this script in the future but for now it serves its purpose lol. Publishing this version early as I wanted to give some friends access to it
In terms of usage, I like 4h 50 SMA alot . Having two sets of Bollinger bands is nice so you can turn one off or swap between time frames and such. In terms of techniques using both bbands, I haven't really played with it too much yet but simple things like 1h 50sma bbands expanding past the 4h 50sma bbands probably indicate an exaggerated move in that specific time frame, etc etc.
Hope this helps!
