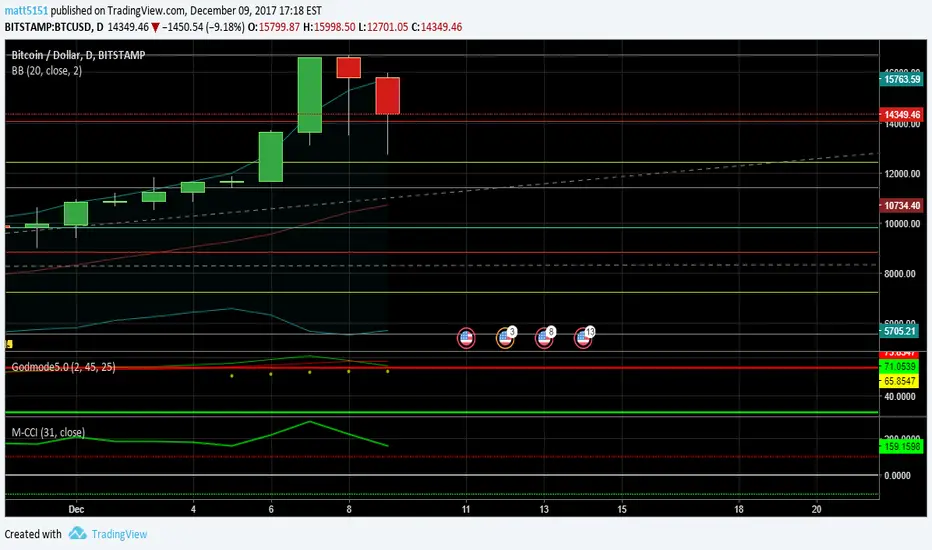
FX Sniper: T3-CCI Strategy with OB/OS guidesThis is a simple addition to Hpotters T3 CCI that has dashed guide lines at the 200 and -200 level to indicate overbought / oversold conditions.
Tìm kiếm tập lệnh với "CCI"
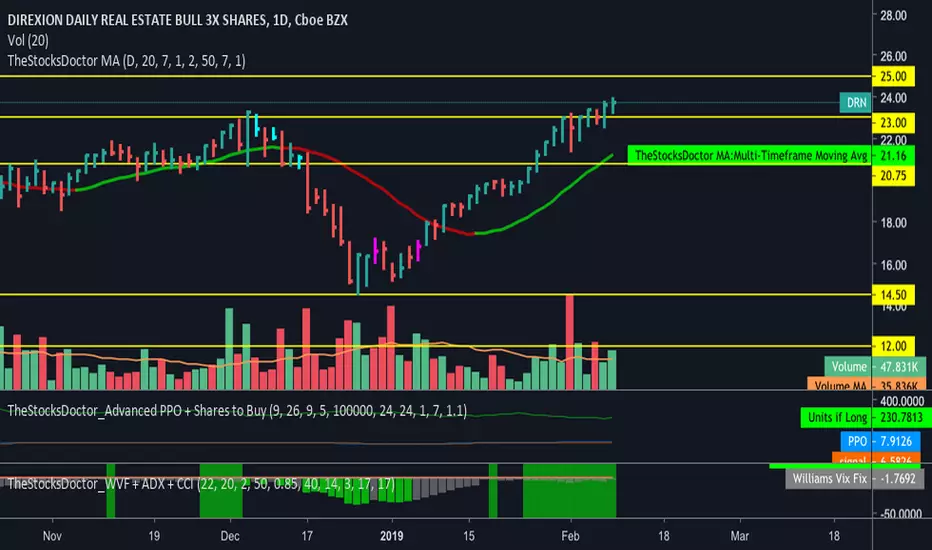
TheStocksDoctor_WVF + ADX + CCIThis script is a modified version of CM Williams Vix Fix for which I have added an indicator that shows when ADX and CCI are both indicating positive momentum - highlighted by green bars. This is part of TheStocksDoctor Trading System.
Inputs are as follows:
Lookback period Standard Deviation High ---> 22
Bolinger Band Length ---> 20
Bollinger Band Standard Dev.. ---> 2
Lookback period percentile high ---> 50
Highest Percentile ---> 0.85
----Highlight bars Below... --->
Show Highlight bar if WVF WAS true is now False --->
Show highlight bar if WVF IS True --->
----Highlight bars Below Use Filtered... --->
Show highlight bar for filtered entry --->
Show highlight bar for AGGRESSIVE Filtered Entry? --->
Check below to Turn all Bars Gray --->
Check box to Turn Bars gray? --->
Long-term look back current bar has to close Below... ---> 40
Medium-term look back current bar has to close below... ---> 14
Entry price action strength --close... ---> 3
--------Turn On/Off Alerts below... --->
---To activate alerts you HAVE To Check... --->
---You can un Check the box BELOW... --->
Show Williams Vix Fix Histogram... --->
Show Alert WVF = True? --->
Show Alert WVF wa true now False? --->
Show Alert WVF Filtered? --->
Show Alert WVF AGGRESSIVE Filter? --->
ADX Smoothing ---> 17
DI Length ---> 17


UO+CCI+ROC+MA2 study v2 (Buy and Sell) (J)Ultimate Oscillator + CCI + Rate of Change + MA double
1. 'Aqua' Zone stands for "Buy" zone. = the price looks low.
2. 'Yellow' Zone stands for "Sell" zone. = the price looks high.
3. 'Green' Zone stands for "Chaos". = i don't know.
4. 'No color' stands for "No position". = i don't know, either.

MCI and VCI - Modified CCI FormulasFor private peeps only
- Takes a modified version of the CCI formula into 2 parts
VCI - Volume Channel Index (Yellow Histogram)
- Measures accurate accumulation and distribution levels and times
MCI - Modified Channel Index
- Measures (when compared to VCI) levels where clearly buys are interested vs not interested.
Example:
If VCI > MCI
- Shows buyer's are more than interested in buying, you've either hit a bottom or heavy resistance
if MCI > VCI
- Show's buyer's aren't interested and will most likely result in a dump/lower price
Great for monitoring accumulation and distribution, these auto buy and sells look for the transition points over 0, works on EVERY commodity/stock/FOREX/Crypto
Results are from trading 1 BTC x25 leveraging. Not all trades will get in if put in at limit, but it does survive with profits after the massive 0.075 fee (results shown are after fees)

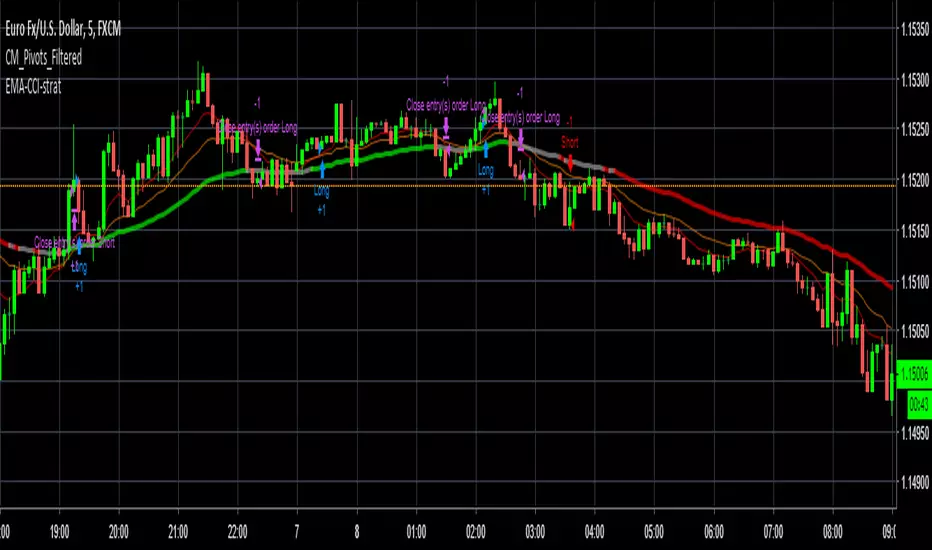
[Strategy] CCI EMA scalping [DEV]Recommended timeframe: 5M or higher
Based on EMA crosses and CCI levels.
Take profit can be also at Pivot levels like Daily/Weekly
Stop loss should be between 12-15 pips.
This strategy is still under development!
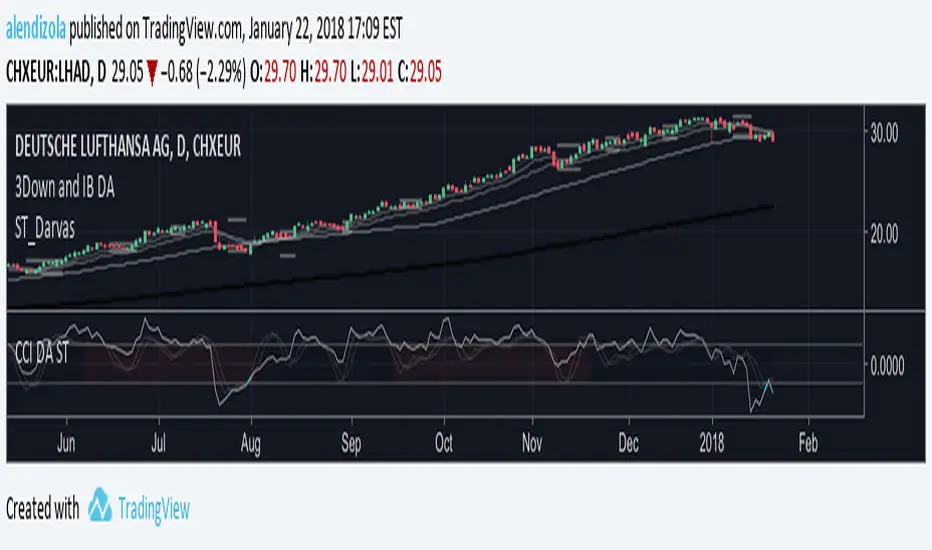
3D Alien CCI - GyromaticalNovelty graphical CCI.
White background bar indicates CCI is over/under +100 or -100.


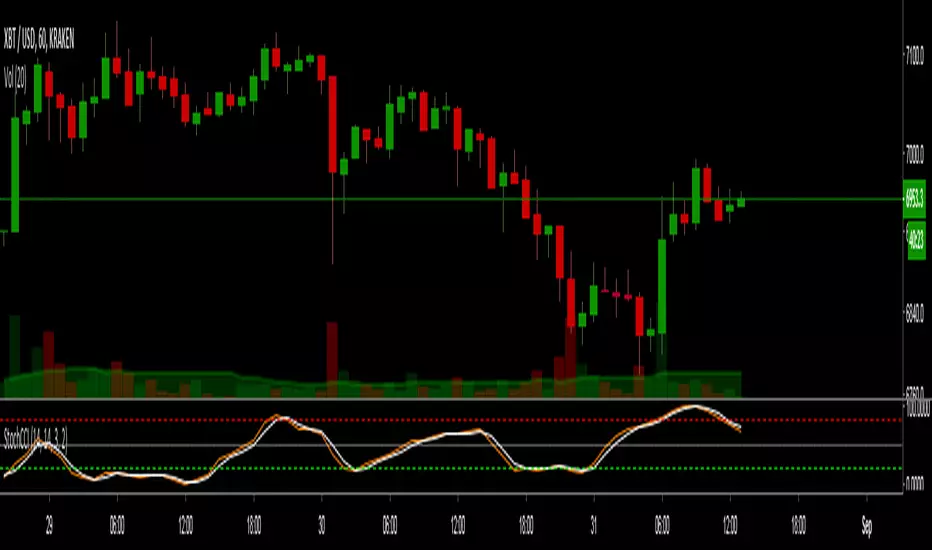
Stochastic CCIThis indicator is a Stochastic version of the regular CCI (commodity channel index).
For those of you who like a stochastic version of RSI, now you have one for CCI.
Enjoy!!!

CryptoVN - Heiken Ashi + CCI + MA BacktestBacktest for Automated Trading System with:
- Heiken Ashi candle
- CCI
- Double MA for HA Smoothed

Salty GRaB Wave with Highlights for Squeeze CCI-Arrows SlowStochThis indicator shows GRaB candles and allows several moving averages to be displayed at the same time.
It uses background coloring to identify momentum shifts. Wide bands of color can be used to identify trends while short bands of color can be used to identify reversals.
It has arrows above or below the candles to show CCI values above 100 or below -100 with the arrow pointing in the direction of the momentum.
It has red background coloring to show slow stochastic Overbought ranges and dark red signals indicating a cross of the fast and slow lines.
It has green background coloring to show slow stochastic Oversold ranges and dark green signals indicating a cross of the fast and slow lines.
It has yellow background to show squeezes with additional Squeeze information shown at the bottom of the chart in the form of letters and momentum arrows.

Multiple EMA, VWMA, BB and CCIThis is a combination of Multiple EMA, VWMA, BB and CCI on one script.

Frosted Triple CCI (For Dark Backgrounds)Based on the Triple CCI.
The 3rd CCI is a histogram, looking back 6 bars to determine green/red, and colors undetermined bars in gray.

Frosted Triple CCI (For Light Backgrounds)Based on the Triple CCI.
The 3rd CCI is a histogram, looking back 6 bars to determine green/red, and colors undetermined bars in black.

Ride the wave RSI+CCI
This script allows you to combine both RSI and CCI identifying confluence points between them. It allows for the input of a channel (top and bottom) for each of the indicators and will tag in the candles when both are crossing into the channel, inside the channel, above or below. With this single indicator you can even make room for another indicator because after getting the hang of it you can dispense of both. Of course for other situation like trends or support or resistance you will always need the line but this might be something i can discuss or even create something that will resemble a MACD type of indicator but with both lines from RSI + CCI.
Feel free to discuss, suggest, critique, whatever. I am a developer and an amateur trader but will be working on more scripts so if you want yours but don't have the knowledge of pine script, pm me and if i can help you i will, this will benefit us both.
Thank you and stay well everybody. Happy tradings.

On Balance Volume (CCI-coded) [Krypt]This is a straightforward modification of LazyBear's CCI-coded OBV indicator with the following changes:
1) uses log-hl2 as source, which seems to be a more stable indicator of price change than close
2) adds optional price smoothing

Multi. Exchange CCIBasic CCI script that takes the average close price data across popular crypto exchanges.