Pivot Point CandlesIndicator that highlights Hammer, Inverted Hammer, Engulfing, and Harami candlestick patterns. Great for those looking for a quick way to show the most popular reversal patterns on the charts.
Options will allow you to select to show Hammers, Engulfing or Harami patterns only. You choose the combinations that you want. Great tool to learn and training your eyes to the patterns.
You also have an option to select "Super" versions of the Engulfing and the Harami patterns, the Supers only shows if the pattern engulfs the body and the wick of the smaller candle in the pattern.
The indicator will show Bullish opportunities and Bearish opportunities on the chart for each of the patterns. The inverted hammer will show at the top indicating a Bear move, and the Hammer will show below price indicating a Bullish move.
Use this indicator in conjunction with other Support & Resistance such as the simple moving averages, trend lines, flat lines, or even Bollinger bands. When these patterns show at or around these points on the chart they will indicate a reversal is pending. Wait for the next candle as confirmation that the move will actually take place in the direction indicated and you will have your pivot point on the chart and create a higher probability of success. Leverage Stochastic, RSI, or CCI indicators to help confirm the reversal as well. Look out for resistance above or support below to determine your targets for the reversal.
Happy trading!
Tìm kiếm tập lệnh với "CCI"

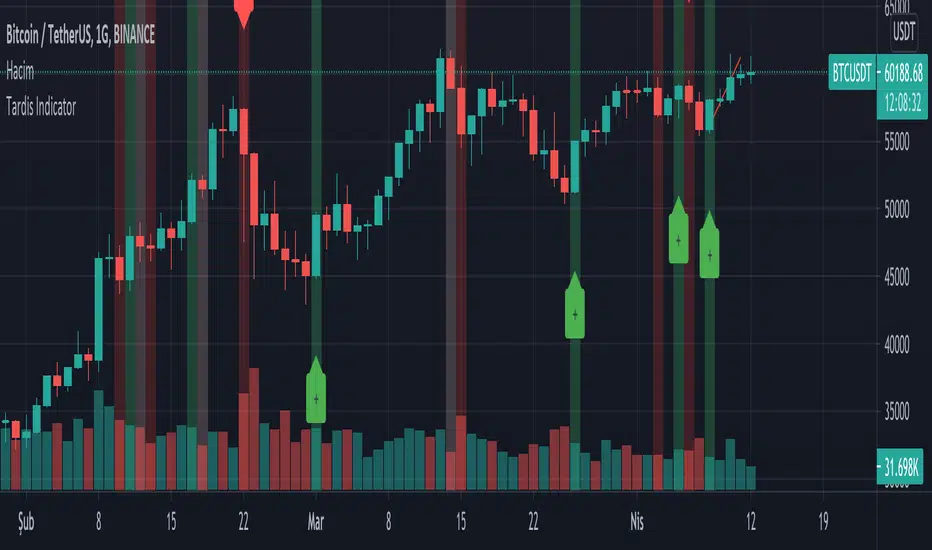
Tardis IndicatorIt allows you to get instant buy and sell signals.
It generates algorithmic signals using indicator rsi , macd , cci , mfi , sma , ema data.
Due to sudden market changes, it works more stably for 4 hours and more.
You can set an alarm for the signals.
Faint colors indicate possibilities. Dark colors are confirmation signals.
Please make your investments by checking on the chart.
Does not contain investment advice!
Please contribute to our development by donating.
Tether USDT Address (ERC20) : 0x869eb3887c1d330bd3fee62d24b181636967ceb6
Tether USDT Address (TRC20) : TJfj6GjPzckB2KHNk7u97mToDxCmhHN534
iGTR_Official StrategyThis alert indicator is pair of strategy using crossover of multiple Moving Averages for entry in Buy/Sell side & Pivots/Fibonacci zones for booking/trailing gains. Also added pair of moving averages which corresponds with the crossovers to hint potential trend reversal on breach. Green line gives trend reversal indication for Long trades, Red line gives SL indication for Short trades.
Also one may add indicator like MACD/ADX/CCI/RSI for more conformation/rejection/follow-up of trend post entry of signals.
Trend tracking strategy indicators through trend analysis.
Through 18 years of trading experience, I have developed this strategy indicator for Tradingview that enables stable and high returns.
This is the one I am currently using for real trading.
Correct timeframe is key to success. 5-15 min for Intraday, 45-60 min for Swing Positional trades.
The research process is very important as you can see beforehand how well the alerts for this Study would perform.
For detailed backtesting, a backtesting period can be set.
*Note: Backtesting results do not guarantee future results.
This premium indicator is free & not chargeable.
Do not try to outsmart the strategy
Leave your emotion out of trading! If you trust the strategy, you will have way better returns than if you try to outsmart it. Follow each signal you receive even if it doesn't seem logical at the moment.
Become a machine that executes.
Don't look at fundamentals. Follow the trend! Trust the strategy!
Any form of trading has large potential rewards but also large potential risks. The user must be aware of those risks and be willing to accept them. Don't trade with money that you, the user, cannot afford to lose. No representation is being made that you are guaranteed positive results.
The past performance of any trading methodology is not necessarily indicative of future results. Trading involves high risks.
I hope you enjoy it!

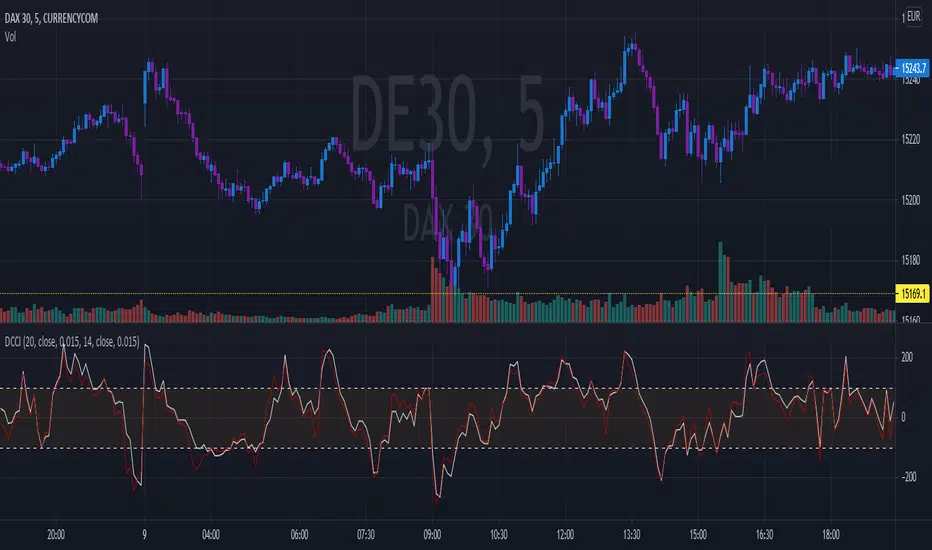
Dual Commodity Channel IndexDual Channel Commodity Index comprised of two single CCI indicators with all tweakable parameters: lengths and factoring.
RSI OverTrend Strategy (by Marcoweb) v1.0Hi guys, just adapted the CCI Level zero Strategy with the Over Bought and Over Sold levels provided by the Relative Strength Index. The strat is opening a long position at RSI Oversold 30 Level closing it at RSI Overbought 70 Level flipping the position.
Enjoy :D

Average Directional Index + ΔDI± (Delta)Average Directional Index (ADX) and Difference between DI+ and DI- (ΔDI±), I call it Delta for short.
The idea explained:
ADX is a common indicator for analysing trend strength. Values over 25 usually indicate the symbol is in "trend mode", meaning there is a lot of momentum, upwards or downwards, - while values under 25 suggest it is in "range mode", the price moves sideways, lacking energy. Note that this indicator is not volume-based.
I moved the graph (red) down 25 points; this version shows positive values in "trend mode" (>25), and negative values in "range mode" (<25). The line sits at 0. The underlying code for the ADX is basically identical to the official TradingView built-in version.
Now the exciting part: DI+ and DI- are used to calculate the ADX. They are sometimes included in the ADX indicator chart, I included a version that shows them in the graphic, at the bottom. Traditionally, DI+ (green) crossing DI- (dark red) from below shows the beginning of an upward trend, and therefore a good LONG entry position. However, I noticed that this is usually not the case: this method responds very slowly to the actual price movement. At the point the indicator tells you to enter, the trend is usually already exhausted.
I found a better way to use this data; instead of waiting for both graphs to cross, meaning the difference in their respective values is 0, we look for the greatest possible difference. That is what the purple graph of my indicator shows (ΔDI±). It utilizes the zero-line we already created for the ADX. High positive values declare that the DI+ is much greater than the DI-, and vice versa. Delta is the greek letter used in mathematics for difference, so that is what I call this indicator.
How to use it:
When you look at the graph, low Delta values seem to be good entry points for LONG positions, high Delta values good exits. This is similar to how RSI and CCI work, which is why included them in the chart above (). However, this is only reliable, when the ADX is above 25, or 0 in this version, indicating the symbol is in "trend mode". This is important .
When you look at the examples in the chart, you can confirm that. The marked candles show good entry and exit points, with Delta being notably low/high (±25 seems to be a good threshold, the dashed lines sit at +30/-30), and the ADX above 0 (25). Now, you might have noticed that around mid-december the Delta actually registers the highest value for this symbol in the given time frame, indicating a strong SHORT after a steep climb. But, importantly , the ADX is not in "trend mode" as required for a clear signal, it is in "range mode": the price discovers this new level and takes a few days to get used to it. It does not fall. This shows why only the combination of both Delta and ADX gives desirable results.
I noticed that this seems to work best for 1D and 1H candles; if you find any other time frames or scenarios, let me know!
PLEASE NOTE THAT THIS IS BASED ON PERSONAL, EMPIRICAL OBSERVATIONS. PAST RESULTS DO NOT GUARANTEE SUCCESS IN THE FUTURE. DO NOT TAKE THIS AS INVESTMENT ADVICE!
Thanks to TradingView and robertkowalski for providing the basis on which the code is built. Credit goes to the appropriate developers/owners.
()
Let me know if you make any other observations, or find other ways to use the data!

MTF Oscillators [Anan]Hello friends,
This is my own MTF oscillator framework verion.
You can control in everything from indicator settings suck as (Source, Length, OB/OS Zones, Show/Hide Timeframes and all Timeframes are supported).
List of supported oscillators:
RSX
RSI
MFI
CCI

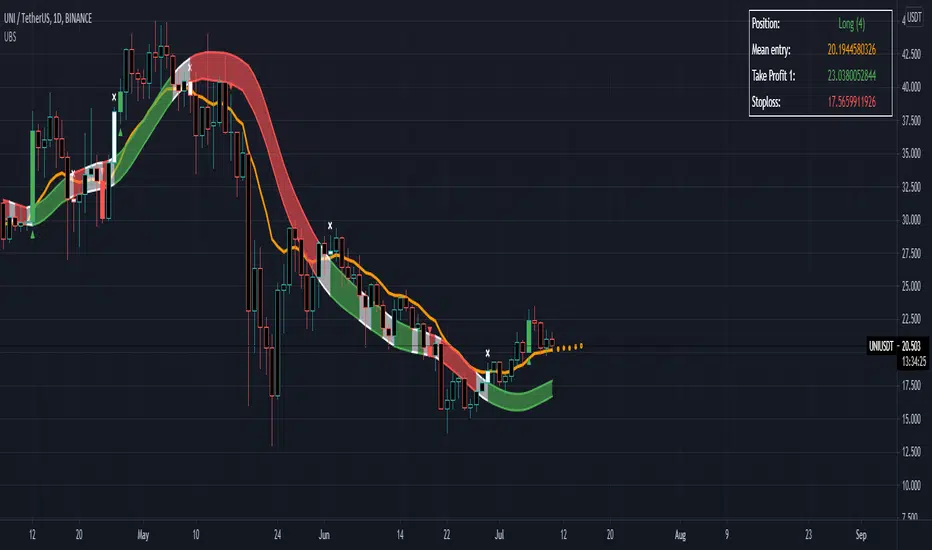
B1rd's Moving AverageThis special moving average is supported by many filters such as the RSI, CCI, Waddah attar, Ichimoku cloud, DMF, TSI and ATR. Combining these indicators will acts as a powerful tool to help us find the direction in trend.
With this indicator, we aim to provide you the best trend trading strategy that includes take profit and stop loss levels.
The fast moving average is named the base line, the slow moving channel is called the secondairy baseline.
Basic instructions:
The strategy prints signals in the form of a green circle in the case of a LONG signal, a red circle in the case of a SHORT signal and white cross above the candle in the case of an exit signal.
Regarding Baselines
There are two Baselines, the primary orange baseline and the secondary which changes color. Both these trendlines are used to determine price trend.
The secondary Baseline consists of a Keltner Channel which is an average True Range of the secondary baseline moving average. The color red on the secondary baseline indicates a bearish trend and the green color indicates a bullish trend. A white secondary baseline indicates a NO TRADE ZONE
Regarding Signals
When price is above both baselines, a LONG signal may be printed by the strategy depending on further verification by other internal calculations.
The LONG signal indicates a bullish trend and allows you to open a long trade. The most optimal way to long the asset is when price is near or at the primary baseline. The qualifier zone also satisfies this criterion, especially when dealing with high momentum in price.
Trend continuation Signals are the color of the relative Trend and they have a diamond shape. They indicate continuation of the trend.
In the case of a SHORT signal, price must be below both baselines. A SHORT signal indicates a bearish trend and indicates opening a short trade. Regarding when to short the position, the same criteria for a long position apply. Namely when price is near or at the baseline or in the qualifier zone.
When an Exit Signal prints, a white cross above the candle for a Long and below the candle for a short, closing of the position in question is recommended.
Regarding stoploss, profit, closing of the trade
The plot tp/sl lines is used to indicate a hard stoploss and take profit level based on an average true range of price.
When a candle closes below both baselines after an active LONG signal or above both baselines after an active SHORT signal, closing the trade is recommended. These criteria serve as secondary exit indicators.
Settings:
The initial setting allows us to select a template from a list of already tested settings. We can change the Template with this setting, make sure to use the corresponding chart and timeframe to get accurate results. More template settings will be updated in the future. Choosing any template setting but custom will override any other setting within the indicator.
Second, we have settings that allow us to input the Smoothing Type and Length on both baselines.
This also manipulates the Keltner Channel surrounding the Secondairy Base Line.
Below this you can find the exit signal option, which will cause the indicator to print exit signals.
The next setting will call upon a forecast on the primary baseline, which could help you determine future support levels based on the selected moving average.
The show Qualifier line option will plot the Entry Qualifier. It will automatically determine trend based on close relative to the Base Line, however you can Override this with the boolean option.
Finally we can enable the Take Profit and Stop Loss options. By default, these will not plot. If you desire to see recommended Take Profit and Stop Loss Levels, you can enable the checkbox in this section.
Strategy
The primary function of this indicator is to detect changes in trend. But it can also be used to supply entry levels, take profit levels and stop loss levels.
Genesis Matrix Momentum IndicatorThe Genesis Matrix (GMMI = Genesis Matrix Momentum Indicator) is primarily a momentum indicator that can be very well combined with other indicators to easily detect possible trend changes.
This is a translation/interpretation for TradingView from the original Metatrader 4 code which is Open-Source and was developed by "realjumper". More information here: www.forexfactory.com
The 5-15 Genesis Strategy and Genesis Summary PDF: www.forexfactory.com
EMA is configured as follows:
Length: 5
Source: hlc3
Offset: 2
Create a buy alert:
- Condition: GMMI and "All blue"
- Options: Once Per Bar
Create a sell alert:
- Condition: GMMI and "All red"
- Options: Once Per Bar
Version 3 changes:
- Bug fixes
- Fixed T3 signal (trend reversal instead of closing above/under trend)
- Input variables added (You could play around with periods of CCI and T3 by setting it to 12 for example.)
- Converted to PineScript v4
- Added alarm conditions
Happy Trading 📈😎
Important : We have neither invented this indicator nor added anything in the logic to it. This is just a script translation.
Note1 : TVI (first line) only works on a ticker with provided volume!
Note2 : The original system uses Heikin Ashi candles, but please be aware that this may alter the alertcondition and probably falsify the actual outcome.
Note3 : We do not recommend using a single indicator as a basis for your trading decisions.
To find out more about how to gain access to this indicator, please use the provided information below or just message me.

Cyatophilum Strategy BuilderAn indicator to create strategies, backtest and setup alerts.
The user can choose one or multiple TA entry conditions, if more than one the conditions are combined with a logical AND.
The entries will open up a trade, which is then handled by a risk management system including Trailing Stop, Take Profit and up to 100 Safety Orders.
This indicator can be used to backtest 3commas DCA bots who are using TA presets, RSI or ULT.
Its main goal is to create strategies by combining indicators.
Let's dive into the details of what's included:
Entry Condition: MACD
Triggers an entry when macd crosses with the signal line.
Configure the fast, slow length, signal smoothing and timeframe to trigger the condition.
Entry Condition: RSI
Triggers an entry when the RSI is higher or lower than the long/short threshold.
Configure the length, timeframe, long and short threshold to trigger the condition.
Entry Condition: ULT (Ultimate Oscillator)
Triggers an entry when the ULT is higher or lower than the long/short threshold.
Configure the 3 lengths, timeframe, long and short threshold to trigger the condition.
Entry Condition: Bollinger Bands
Triggers an entry when the price is above the upper band for long and below the lower band for short.
Configure the length, standard deviation and timeframe to trigger the condition.
Entry Condition: MFI (Money Flow Index)
Similar to RSI, it triggers an entry when the MFI is higher or lower than the long/short threshold.
Configure the length, timeframe, long and short threshold to trigger the condition.
Entry Condition: CCI (Commodity Channel Index)
Another oscillator that triggers an entry when its value is higher or lower than the long/short threshold.
Configure the length, timeframe, long and short threshold to trigger the condition.
Trend Filters
Use one or two trendlines to filter your trades: go only long/short when the trendline is bullish/bearish.
Choose between the several trendlines: ema, sma, wma, hull ma, kama, alma, rma, swma, vwma, Tilson T3, and the unique Adaptive T3 and Adaptive Hull MA.
If this is not enough, you can use the external trendline feature to plug in any other indicator for your trendline.
The second trendline can be MTF and come from another symbol if needed.
Combining Indicators
Most of the time we will not be using a single indicator at a time, but instead, combine them in order to get stronger entries.
The entry conditions are combined using a AND logical gate, meaning all conditions must be true for the entry to trigger.
Here is an example using a combination of 2 indicators: Bollinger Bands and RSI.
We can see less entries are being triggered on the bottom chart than on the top chart because the bottom chart is combining the 2 indicators while the top chart is only using Bollinger Bands.
You can combine up to all 6 indicators if you want, but keep in mind that combining too many may lead to triggering no entry at all.
Risk Management and Trade system
The indicator will not trigger more than one long or short entry in a row.
To start a new trade, the indicator will wait for either take profit, stop loss or an opposite entry if no SL and TP is set.
Stop Loss and Take Profit
Configure your stop loss and take profit for long and short trades.
You can also make a trailing stoploss and a trailing take profit.
Safety Orders
Just like 3commas bots, you can create a strategy with up to 100 safety orders.
Configure their placement and order size using the price deviation, step scale, take profit type (from base order or total volume), and volume scale settings.
Note: only the 20 first safety order steps or so will be plotted due to graphic limiations. The steps after that still trigger alerts and backtest results.
Creating Alerts
The indicator is using the newest alert system:
1. Write your alert messages in the indicator settings (alert section at the bottom)
2. Click "Create Alert" as usual, but choose "alert() function calls only"
Data Window
Since the indicator is applied on top of the price chart, the oscillator indicators cannot be plotted. You can always add them on another pane but if you want to just see their values, you can use the Data Window to see the value of each oscillator on each bar.
Backtest settings
Used to get the results below:
Initial Capital: 100 000$
Base Order Size: 0.1 contract (BTC)
Safety Order Size: 0.1 contract (BTC)
Commission: 0.1%
Slippage: 100 ticks
pyramiding: 6
The indicator settings are plotted in the main chart panel.

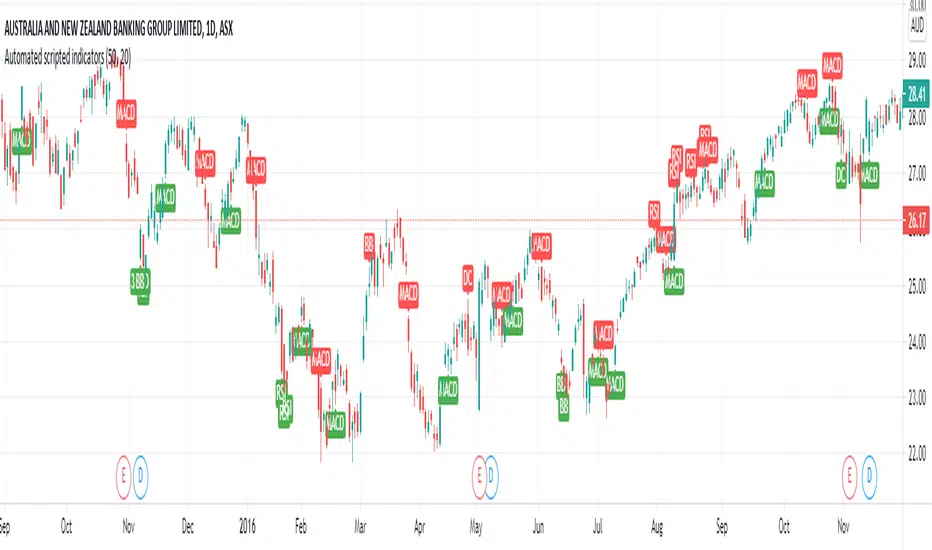
Buy Sell signals for indicatorsThis is a simple script where I have compiled my most commonly used overlays and given each unique buy/sell signals. I have found this to greatly simply my searching for future trades as it quickly outlines the current technical postion of the stock.
Some cons of this script though is the visualization can get messy due to multiple alerts being set off.
--> RSI
Buy signal at or above 70
Sell Signal at or below 30
--> MACD
Buy signal at crossover between macd line and signal line aswell as the histogram line being above 0
Sell signal at crossover between signal line and macd line aswell as the histogram line being below 0
--> Standard Deviations from Mean
Buy signal when the price is 3 standard deviations from the mean.
Sell signal when the price is 3 standard deviations from the mean.
Mean can be adjusted in settings
--> Donchian Channels
Buy signal when the lowest length value is greater than or equal to low aswell as rsi > 45 to help eliminate false signals
Sell signal when the highest length value is greater than or equal to high aswell as rsi < 55 to help eliminate false signals
--> Bollinger bands
Buy when low is at or below the lower band
Sell when high is at or above the higher band
Soon to come:
--> Linear regression
--> ATR
--> CCI
--> Volume
PS. I can also add candlestick patterns, Gann and Fib levels aswell if it will help people out :)
Williams Alligator + RSI + T3CCIWilliams Alligator strategy is based on indicator developed by a legendary trader Bill Williams, an early pioneer of market psychology.
The strategy is based on a trend-following Alligator indicator, which follows the premise that financial markets and individual securities trend just 15% to 30% of the time while grinding through sideways ranges the other 70% to 85% of the time. Williams believed that individuals and institutions tend to collect most of their profits during strongly trending periods.
Although Alligator is a very strong tool it has a lot of weak signals and has lag span on entries and exits. We added RSI oscillator and T3CCI to clear market noises and weak signals. Moreover the approach we intoduced to the indicator allows to enter positions and close them earlier than orginal indicator which ensures stronger signals
The strategy supports traditional and cryptocurrency spot, futures, options and marginal trading exchanges. It works accurately with BTC, USD, USDT, ETH and BNB quote currencies. Best to use with 1D timeframe charts
The strategy can be and should be configured for each particular asset. You can change filters and risk management settings to receive the most advanced accurate alerts
Advantages of this script:
Good for long and Short positions
Produces strong long-term entries and closures of positions
Stable to short-term market fluctutions
Easy configuration with a user friendly interface
Backtests show high accuracy around 85.71%
High Net Profit percentage around 21.26%
High profit factor around 82.403
How to use?
1. Apply strategy to the trading pair your are interested in at 1D timeframe chart
2. Configure the strategy: change filters values and risk management settings until Strategy tester shows good results according to mathematical expectation
3. Set up a TradingView alert to trigger when strategy conditions are met
4. Strategy will send alerts when to enter and when to exit positions
Feel free to copy and use this script for your ideas and trading!

The WWG Plan Indicator V2█ OVERALL
This indicator was specifically created for the Walsh Wealth Group.
In short it is a fusion of some of the most basic and widely used indicators to show overbought patterns and trend reversals.
Its best usage is with LTF scalping and agressive profit taking but can also be used to find HTF dips and buy-zones.
█ FEATURES
Buy Signal (Buy):
Printed only with all confirmations triggered
Small Buy Signal (B1 & B2)
Printed if some of the confirmations are triggered and can be treated as DCA entries or for further
confirmation with other indicators and basic TA.
Crayons (Color Bars):
Blue: RSI is oversold
Olive: RSI and Stoch RSI are oversold
Yellow: RSI, Stoch RSI are oversold and lower Bollinger Bands are crossed by Low
Orange: RSI, Stoch RSI and CCI are oversold
Trailing SL:
If activated in the config, a trailing SL can be displayed on the chart based on ATR.
█ SETTINGS
The underlying indicators used are RSI, Stoch RSI, Bollinger Bands, MACD and CCI.
All possible configs can be changed in the config settings.
█ GENERAL INFORMATION
Depending on the settings, the indicator performance will be highly affected.
This indicator is only displaying highly oversold areas and events of trend reversal it is not a *God*-Signal and will print false positives.
█ ALERTS
An alert for the main buy-signal is implemented and can be used via the TV alert functionality.

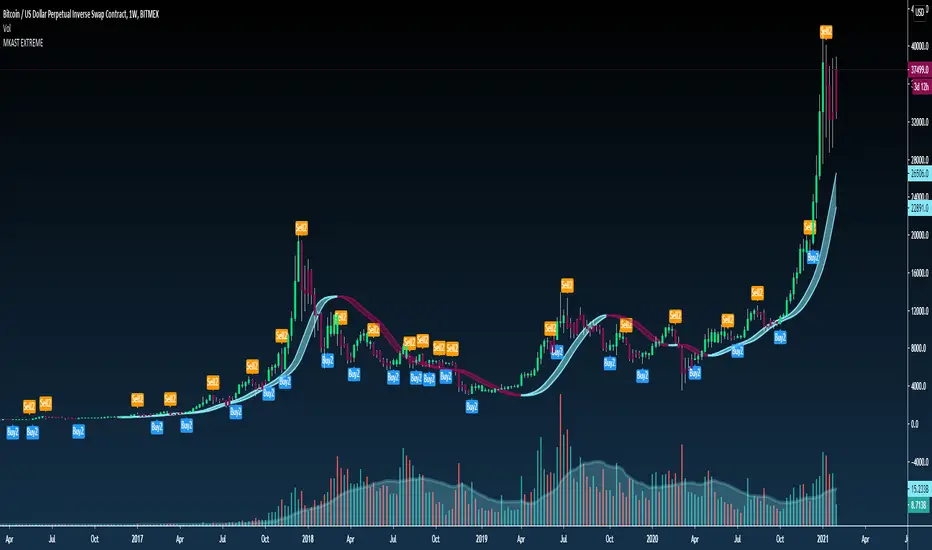
MyAlgo EXTREMEPLEASE READ THE ENTIRE POST BEFORE PURCHASING & USING THE MyAlgo Tool. Saves you and me some time in emails and messages. :)
This is the official version of MyAlgo EXTREME
PLEASE UNDERSTAND THAT THIS IS A DIFFERENT AND SEPARATE PRODUCT AND SCRIPT FROM "MyAlgo SLIM" FROM THE MyAlgo TRADING TOOL SERIES
Description
Buy & Sell Alerts can be set on all Tickers. This includes, but is not limited to Crypto, Commodities , FOREX, Equities and Indices. Also all candle Types are compatible.
Recommended Time-frames - Due to the complexity of MyAlgo-SLIM the user has a choice between three algorithms and is like that able to trade on all timeframes with the highest returns.
MyAlgo combines many different aspects at the same time, scans multiple other Algorithms and comes to a conclusion based on over 1350 lines of code.
It is based on Divergences, Elliott Waves , Ichimoku , MACD , MACD Histogram, RSI , Stoch , CCI , Momentum, OBV, DIOSC, VWMACD, CMF and multiple EMAs.
Every single aspect is weighted into the decision before giving out an indication.
Most buy/sell Algorithms FAIL because they try to apply the same strategy to every single chart, which
are as individual as humans. To conquer this problem, MyAlgo has a wide range of settings and variables which can be easily
modified.
To make it a true strategy, MyAlgo has as well settings for Take Profit Points and Stop
Losses. Everything with an Alert Feature of course so that FULL AUTOMATION IS POSSIBLE.
I know from experience that many people take one Algorithm and are simply too LAZY to add multiple Algorithms to make a rational choice. The result of that is that they lose money, by following blatantly only one Algorithm.
MyAlgo has additional 15 Indicators, perfect for all markets, which can be turned on and off individually.
Side Notes
MyAlgo is being updated and upgraded very frequently to suit the requests of our customers.
This is not financial advice. Please read our disclaimer before using it.
Please refer to the signature field if you are interested in gaining access to this script.
Anything below this sentence will be Updates regarding MyAlgo
Cyber Fisher TransformThis oscillator is an Inverse Fisher Transform of multiple momentum based oscillators such as RSI , CCI , RSX , Stochastic , AO and much more…
The idea behind this method of calculating momentum is to find the shift in momentum cycle and momentum exhaustion without market noise!
So basically you can find three general behavior in this oscillator ,
First , when the Cyber Fisher Transform sticks in the bullish/bearish control zone … this means the momentum is in favor of its control zone … when stick in the bullish control zone the momentum is continuing in the bullish side when sticks in the bearish control zone the momentum is still bearish too.
Second , when the Cyber Fisher Transform is in the on of bullish/bearish control zone and the slope of it change to the opposite side and preferably it will be noticeable when it above 10 or below 90 and obviously leaving of the control zone (above 20 or below 80) is the final confirmation , this behavior means the momentum is reversing ….
One point here is only slope change in one of the bullish/bearish control zones would have the momentum reserving meaning ! every slope change in between 20 and 80 usually doesn't have enough weight for momentum reversing
Third , when the Cyber Fisher Transform slope change in the neutral zone (40_60) … this means the new momentum does not have enough power to continuously lead the price … this behavior often occurs in trending environments in the market … basically similar to the hidden divergence theory in the trending environment the slope change in the neutral zone have the ability to continue the trend
Also the overbought/oversold of some built in separated oscillators would be shown as background color in order to find the best exhaustion area of the momentum .

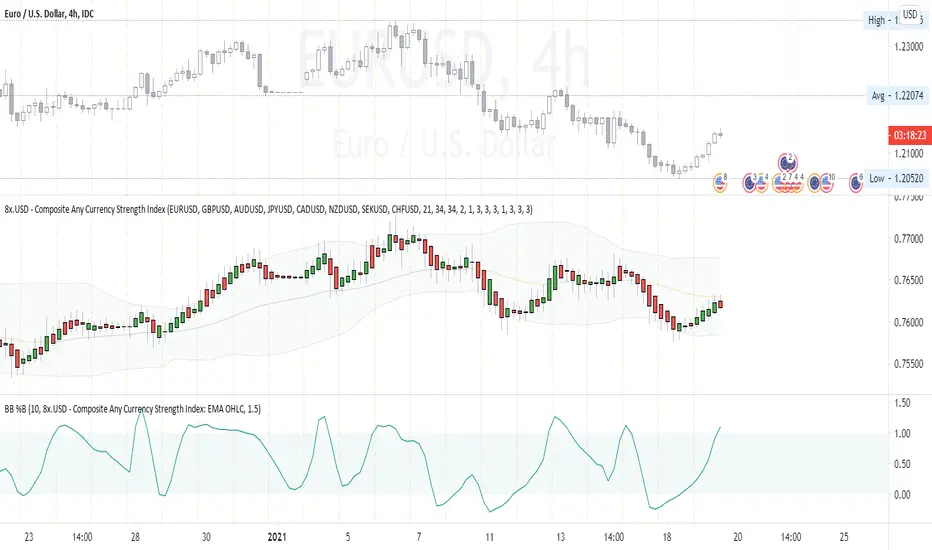
Composite Any Currency Strength IndexThis is a flexible currency strength indicator and you can adjust it to any currency you wish 'to measure'. By default, it is set to measure USD major pairs. Indicator calculates every pair you list, and plots one composite chart in the form of Heikin Ashi candles. Basically, you will get USD index in this case. Similarly, you can get AUD, EUR, CAD, JPY, CHF, etc indexes by specifying corresponding symbols. Remember about base and quote currencies and location of each for correct calculations. Simple adjustments in the script needed if you want to value USD by using USD in both base and quote (counter) currencies.
For example, when calculating USD strength by looking into USDJPY (not into JPYUSD) symbols, you will need to add minus "-" before corresponding security in the script itself, not in the Settings Inputs.
Default study script (with JPYUSD):
// Inputs
...
string sec3 = input(defval="JPYUSD", type=input.symbol, title="Symbol")
...
h_sec3 = security(heikinashi(sec3), timeframe.period, high)
l_sec3 = security(heikinashi(sec3), timeframe.period, low)
o_sec3 = security(heikinashi(sec3), timeframe.period, open)
c_sec3 = security(heikinashi(sec3), timeframe.period, close)
Adjusted study script with USDJPY:
// Inputs
...
string sec3 = input(defval="USDJPY", type=input.symbol, title="Symbol")
...
h_sec3 = -security(heikinashi(sec3), timeframe.period, high)
l_sec3 = -security(heikinashi(sec3), timeframe.period, low)
o_sec3 = -security(heikinashi(sec3), timeframe.period, open)
c_sec3 = -security(heikinashi(sec3), timeframe.period, close)
Unfortunately, I am not a coder specialist and perhaps someone here could improve this indicator for easier and more friendly adjustments. But thanks to variety of symbols on TradingView , you can ignore any changes in the script, and just use symbols with corresponding counter currency offered by this great platform.
Bollinger Bands, 2 x RMA, 4 x SMA/EMA were added for deeper analysing of the index. Other indicators with ability to select data sources (like CCI, StochRSI, Momentum etc) can be separately added to a current chart, but use Composite Any Currency Strength Index data as the source for analysing displayed pair, i.e. by selecting source - Composite Any Currency Strength Index: SMA Close or EMA HLC.
Thank you and good luck everyone!
Coinmaster Holding ScriptRECOMMENDATION: I PREFFER USE THIS ON 4H OR 1D TIMEFRAME
In the following article, I have completed the creation of this semi-automatic script dedicated to institutional capital management in the different markets, its development was carried out under operations that exceed a balance greater than 1 million usd, which will allow you to summarize your technical analysis or you can request my support to automate your account after your previous studies.
Alerts have been created that you can program or automate through webhook, under which you can program for advice or consultancy to your account, either to integrate indexed, forex or cryptocurrency trading api keys or to perform leveraged operations either long or short with leverage especially cryptocurrencies, with a focus on BTC / USD, BTC / USDT, ETH / USD, ETH / USDT, LTC / USD, LTC / USDT, TRX / USD, TRX / USDT but adaptable to any asset
where I deliver 6 years of research, training, use, development and implementation of different analysis and trading mechanisms in financial markets.
It allows you to carry out simple technical analysis studies in a calculated way
Using wide and different methods, which are automatically arranged algorithmically, indicating a buy or sell signal based on the "Price Action + Average True Range or Atr", which also takes into consideration the increase or decrease in volume and different combined conditions are used to arrive at a "combined signal" between them:
Macd
- RSI
- ATR "Average True Range
- Retracement and Fibonacci Levels
- Pivot Points
- Sar Parabolic
- Volume
- Crossing Moving Averages
- Price per volume trend indicator (VPT)
- Calculated Analysis of Divergence, Bullish Divergence, Bearish Divergence
- Analysis of Divergence and Fibonacci Crosses
- Combination of Pivot Points and Fibonacci Levels with automatic price adjustment for all time frames
- Automatic support and resistance adjustment
- Automatic adjustment, entry of new levels, eliminate and readjust fibonacci retracement levels and pivot points as the price advances automatically
- Calculation and Analysis and Strategy for Buying and Selling Bollinger Bands
- Automatic Creation, Analysis, Calculation and Adjustment of Trend Lines
- Ichimoku periods
- Automatic Calculation and Analysis of Divergence, Trend, Price and Volume taking into account multiple factors such as: Trend Lines, MACD, Balanced Volume or "OBV", Relative Strength Index "RSI", Commodity Channel Index (CCI )
You could use my indicator to either:
1. Create summary Buy and Sell Alerts
2. Create Alerts with Customizable Conditions
3. Create Alerts and Automate these by means of webhook shipments
4. Open and Close Positions automatically through Alerts sent through webhook and conditioned on your platform by custom% profit, either take profit or stop loss
You can configure the following alerts in an unlimited way:
-Buy Signal Indicated by Atr
-Sale Signal Indicated by Atr
-Buy signal by volume price trend indicator (VPT)
-Sale signal by volume price trend indicator (VPT)
-Sar Parabolic -High
-Sar Parabolic - Baja
- Bullish divergence
-Bearly divergence
-Crossing moving averages
-Cross above the Downtrend of the Fibonacci Level 0.382
-Cross above the Bearish Trend of the Fibonacci Level 0.5
-Cross above the Bearish Trend of the Fibonacci Level 0.618
-Crossover above the Bullish Trend of the Fibonacci Level 0.382
-Crosses above the Bullish Trend of the Fibonacc Level 0.5
-Cross above the Bullish Trend of the Fibonacci Level 0.618
-Cross below the downtrend of the Fibonacci Level 0.382
- "Crossover below the downward trend of the Fibonacci Level 0.5
-Cross below the downtrend of the Fibonacci Level 0.618
-Cross below the uptrend of the Fibonacci Level 0.382
-Cross below the uptrend of the Fibonacci Level 0.5
- Cross below the uptrend of the Fibonacci Level 0.618
1. If you don't want to rely on a single truth from my indicator, combine this with either RSI, MACD, or ADX levels.
2. If you are going to use it for a leveraged trade, A) My indicator does not have the absolute truth, B) Try to assign a% of take profit or stop loss range to allow the price to move without closing your recommended trade in loss. 3 to 4% or greater than 1%
Postscript: Use it at your own risk, I have made this script based on my personal opinion and experience, which is not considered at any time a financial or investment advice or of any kind, which after reading this I free myself from Any financial responsibility for your personal decisions, what you read in any market or legal action will only be considered before any court, person, page, agency, broker, trader, tools, investors, developers or people of any field and of any situation such as If fidubit has given computer advice for educational purposes on the use of pine script, all investment in any type of economy, asset or financial markets is at risk of ups and downs, therefore you are fully responsible for your investment, administration, decision, analysis and use and you should use only your risk capital in the broker you choose

Follow the Trend - Trade PullbacksKindly follow the rules stated below for entry, exit and stop loss. Not every Buy / Sell signal will be profitable.
Timeframe of the chart acts as current timeframe. You need to choose 2 more as middle and higher timeframes.
This indicator is based on candlesticks, ATR and CCI indicators and the logic provides buy / sell signals at the pullbacks of the trend depicted by higher timeframe, that must be respected throughout.
Enter the long / short trade respectively when the indicator gives buy / sell signal after price has gone below the green / above the red line for higher timeframe.
Stop loss shall be low / high of recent swing. Exit when the price closes below / above the middle timeframe, to be used as trailing target.
Use it for any instrument for any timeframe of your choice.
For example, check the shared chart. It is a 1 min intraday, but the indicator can be used for short or long term positional trades as well.
Enter long at 14102, with stop loss 14077. Trailing target is achieved at 14156 giving a Risk:Reward ratio of 1:2.
Another Buy signal is observed around same level and uptrend continues till day end, again for a Risk:Reward ratio of approx. 1:2.
Rules to follow for Long trades -
Enter long position at Buy signal given after price has moved below green line of higher timeframe.
Exit the position when price closes below orange / blue line of middle timeframe.
Stop loss must be at low of recent swing, appearing just before the Buy signal.
Rules to follow for Short trades -
Enter short position at Sell signal given after price has moved above red line of higher timeframe.
Exit the position when price closes above orange / blue line of middle timeframe.
Stop loss must be at high of recent swing, appearing just before the Sell signal.

[blackcat] L2 Ehlers Correlation Trend StrategyLevel: 2
Background
John F. Ehlers introuced Correlation Trend Strategy in May, 2020.
Function
In Dr. Ehlers article “Correlation As A Trend Indicator” in May, 2020, he introduces a new trend indicator that is based on the correlation between a security’s price history and the ideal trend: a straight line. He describes methods for using the indicator to not only identify the onset of new trends but to identify trend failures as well. The indicator helps to identify the onset of a trend or to detect the failure of a trend. While his correlation trend indicator measures the price correlation with a rising slope, the new correlation cycle indicator (CCY) measures the correlation with a sine wave .
Key Signal
CorrF --> Correlation Trend Strategy fast line
CorrS --> Correlation Trend Strategy slow line
Pros and Cons
100% John F. Ehlers definition translation, even variable names are the same. This help readers who would like to use pine to read his book.
Remarks
The 97th script for Blackcat1402 John F. Ehlers Week publication.
Readme
In real life, I am a prolific inventor. I have successfully applied for more than 60 international and regional patents in the past 12 years. But in the past two years or so, I have tried to transfer my creativity to the development of trading strategies. Tradingview is the ideal platform for me. I am selecting and contributing some of the hundreds of scripts to publish in Tradingview community. Welcome everyone to interact with me to discuss these interesting pine scripts.
The scripts posted are categorized into 5 levels according to my efforts or manhours put into these works.
Level 1 : interesting script snippets or distinctive improvement from classic indicators or strategy. Level 1 scripts can usually appear in more complex indicators as a function module or element.
Level 2 : composite indicator/strategy. By selecting or combining several independent or dependent functions or sub indicators in proper way, the composite script exhibits a resonance phenomenon which can filter out noise or fake trading signal to enhance trading confidence level.
Level 3 : comprehensive indicator/strategy. They are simple trading systems based on my strategies. They are commonly containing several or all of entry signal, close signal, stop loss, take profit, re-entry, risk management, and position sizing techniques. Even some interesting fundamental and mass psychological aspects are incorporated.
Level 4 : script snippets or functions that do not disclose source code. Interesting element that can reveal market laws and work as raw material for indicators and strategies. If you find Level 1~2 scripts are helpful, Level 4 is a private version that took me far more efforts to develop.
Level 5 : indicator/strategy that do not disclose source code. private version of Level 3 script with my accumulated script processing skills or a large number of custom functions. I had a private function library built in past two years. Level 5 scripts use many of them to achieve private trading strategy.
[blackcat] L2 Ehlers Correlation CycleLevel: 2
Background
John F. Ehlers introuced Correlation Cycle indicator in Jun, 2020.
Function
In his article “Correlation As A Cycle Indicator” in Jun, 2020, John Ehlers introduces a companion to the trend indicator he presented in his article. This new indicator is designed to help traders navigate cycling markets. The new cycle indicator can help the trader get into trades earlier and have better insight into prevailing market conditions. While his correlation trend indicator measures the price correlation with a rising slope, the new correlation cycle indicator (CCY) measures the correlation with a sine wave.The new system trades only when the market state is 1 or -1, indicating trend regime. It goes out of the market when the market state is 0.
Key Signal
State --> +1 for long and -1 for short
Pros and Cons
100% John F. Ehlers definition translation, even variable names are the same. This help readers who would like to use pine to read his book.
Remarks
The 96th script for Blackcat1402 John F. Ehlers Week publication.
Readme
In real life, I am a prolific inventor. I have successfully applied for more than 60 international and regional patents in the past 12 years. But in the past two years or so, I have tried to transfer my creativity to the development of trading strategies. Tradingview is the ideal platform for me. I am selecting and contributing some of the hundreds of scripts to publish in Tradingview community. Welcome everyone to interact with me to discuss these interesting pine scripts.
The scripts posted are categorized into 5 levels according to my efforts or manhours put into these works.
Level 1 : interesting script snippets or distinctive improvement from classic indicators or strategy. Level 1 scripts can usually appear in more complex indicators as a function module or element.
Level 2 : composite indicator/strategy. By selecting or combining several independent or dependent functions or sub indicators in proper way, the composite script exhibits a resonance phenomenon which can filter out noise or fake trading signal to enhance trading confidence level.
Level 3 : comprehensive indicator/strategy. They are simple trading systems based on my strategies. They are commonly containing several or all of entry signal, close signal, stop loss, take profit, re-entry, risk management, and position sizing techniques. Even some interesting fundamental and mass psychological aspects are incorporated.
Level 4 : script snippets or functions that do not disclose source code. Interesting element that can reveal market laws and work as raw material for indicators and strategies. If you find Level 1~2 scripts are helpful, Level 4 is a private version that took me far more efforts to develop.
Level 5 : indicator/strategy that do not disclose source code. private version of Level 3 script with my accumulated script processing skills or a large number of custom functions. I had a private function library built in past two years. Level 5 scripts use many of them to achieve private trading strategy.

Divergence for Many Indicators v4Hello Traders,
Here is my new year gift for the community, Digergence for Many Indicators v4 . I tried to make it modular and readable as much as I can. Thanks to Pine Team for improving Pine Platform all the time!
How it works?
- On each candle it checks divergences between current and any of last 16 Pivot Points for the indicators.
- it search divergence on choisen indicators => RSI , MACD , MACD Histogram, Stochastic , CCI , Momentum, OBV, VWMACD, CMF and any External Indicator !
- it checks following divergences for 16 pivot points that is in last 100 bars for each Indicator.
--> Regular Positive Digergences
--> Regular Negative Digergences
--> Hidden Positive Digergences
--> Hidden Negative Digergences
- for positive divergences first it checks if closing price is higher than last closing price and indicator value is higher than perious value, then start searching divergence
- for negative divergences first it checks if closing price is lower than last closing price and indicator value is lower than perious value, then start searching divergence
Some Options:
Pivot Period: you set Pivot Period as you wish. you can see Pivot Points using "Show Pivot Points" option
Source for Pivot Points: you can use Close or High/Low as source
Divergence Type: you can choose Divergence type to be shown => "Regular", "Hidden", "Regular/Hidden"
Show Indicator Names: you have different options to show indicator names => "Full", "First Letter", "Don't Show"
Show Divergence Number: option to see number of indicators which has Divergence
Show Only Last Divergence : if you enable this option then it shows only last Positive and Negative Divergences
you can include any External Indicator to see if there is divergence
- enable "Check External Indicator"
- and then choose External indicator name in the list, "External Indicator"
- External indicator name is shown as Extrn
- related external indicator must be added before enabling this option
Coloring, line width and line style options for different type of divergences.
Following Alerts added:
- Positive Regular Divergence Detected
- Negative Regular Divergence Detected
- Positive Hidden Divergence Detected
- Negative Hidden Divergence Detected
Now lets see some examples:
Hidden Divergences:
Regular and Hidden Divergences together:
Showing first letters of indicators:
You can see only the number of indicators which has divergence:
You can see only divergence lines without indicators names and numbers:
option to used different label/line/text colors:
You have option to see only last divergences:
You can change Pivot Period, in following example Pivot Period = 15:
You can use Close or High/Low as Source for Divergence
You can include external indicators and get divergences on it:
Wish you all a happy new year!
Enjoy!

CroSel Indicator ToolboxA value-packed or all-in-one indicator. The main one is probably the algorithmic signal. I have noticed a few trading groups that rely solely on their algo trading signals. I have derived my own using MACD . I find that it works better or just as good as what I have seen. The others indicators are also very powerful and could even be used on a stand alone basis. There are different variations included. I wanted to provide 10x the value at whatever price I would put on this. However I think I've provided at least 20x the expected value. What I like about this is that with more signals, we can visually see confluence. In turn, that should give us traders confidence. The follow is a list of all the indicators I've included so far:
How to use (for all indicators): I suggest using these trade signals as confluence for the main algorithmic trade signals. Aside from MACD and RSI , there are a limited number of signals, but they will all show up within the most recent bars that have passed. Buy when green/lime and sell when red/fuchsia. I suggest experimenting with the the different modes to see what you believe works best for your trading style.
I prefer to use the last signal provided, but I also like to rely on looking at signals as a group, if they are all rising, I'm bullish ; if they are all falling, I'm bearish .
Note on Color Scheme: Red/Fuchsia color means to short/sell and green/lime color means to long/buy.
- Algorithmic signal - provides trade signals. How to use: When there is a green arrow up, it means you should go long. When there is a red arrow down, it means you should exit your long or short sell. If the arrow is lime colored, it means the stock is trending upwards and if the arrow is fuchsia, it means the stock is trending downwards.
- Band and hit count - provides bands to track volatility , as well as tracks the number of times the price hits the upper or lower bands. It also provides candle-to-candle slope as a %. How to use: You can use this to play the odds in your favor. For example: if a stock hits the upper bands 13 times during the morning, and then hits the lower bands 4 times afterwards and then moves upwards away from the lower bands towards the middle of the bands, from here we may be able to say that since 13 is greater than 4, that the stock price may rise again and start hitting the upper bands. Another way I like to use this indicator, is if a stock hits the upper bands more than 16 to 20 times, I like to exit the trade before it has a chance to drop. Lastly, there are zones where a stock price will go above or below 100% or 0% respectively. For example, a stock starts to hit the 110% area of the bands. This could be an excellent time to sell/short the stock.
- Volume surge - provides signals of when volume is increasing/decreasing depending on the color and direction. How to use: Gives you confidence that the price will rise higher/lower.
- EMA 5 & 10 - It is the exponential moving average of the past 5 or 10 bars. It will be either be red or green depending on the slope. How to use: I like to use it as if it were a trend line (which I like to call slanted support/resistance ). For example, if I buy a stock and it falls below EMA 10 I will generally sell the stock, and if it rises past EMA 5 I will generally buy the stock.
- Background color - Background color shows whether the stock is bullish or bearish . If it is green/red, it is slightly bullish / bearish respectively. If it is lime/fuchsia, it is very bullish / bearish respectively. How to use: Take long positions if the background color is greenish(i.e. green/lime) and take short position if the background color is reddish (i.e.red/fuchsia). Please bear in mind, background color will look slightly different if you are already coloring the extended hour session backgrounds.
- Channel Breakout Lines - These lines show the rigid channel that the stock will travel through. How to use: Watch a stock that is in a channel, if it is going up, watch the red dotted line which extends into the future,
if it the stock falls below that previous red dotted line you should sell/short the stock. If a stock is going down, watch the green dotted line, and if the stock goes past the previous green dotted line, you should buy.
- MACD - Moving Average Convergence and Divergence provides trade signals. How to use: 1 turns it off. 2 provides the classic, buy and sell signals based on when the MACD line crosses over or under the signal line. 3 provides faster trade
signals. 4 provides the algorithmic signals. All variations can change according to Algo sensitivity and Algo Signal speed since the algo uses MACD as it's base.
- RSI - Relative Strength Index provides trade signals. How to use: 1 turn it off, 2 turns on and provides the buy and sell signals for above 70 and below 30 RSI respectively. 3 and 4 provide slow and fast RSI trade signals respectively.
4 is my favorite and can be used to provide confluence.
- VWAP - Volume Weighted Average Price . a 2 value is the regular vwap line. A value of 3 or 4 will show that the VWAP line or fill from line until the close is colored
according to slope of EMA 5. How to use: Buy below the VWAP if it shows some support and sell/Short above if it shows some resistance. When the color is red it will show the
- ROC - Rate of Change trade signals. Take note of the circle shaped symbols. Normal mode shows you when the rate of change has crossed the zero line; this can be a very bullish or bearish signal. 3rd mode will gives signals based on whether ROC has stopped making new highs or new lows. 4th mode gives the fastest signals, making it the least risky.
- MFI - Money Flow Index trade Signals. Take note of the Long arrow symbols. Modes work as described.
- BOP - Balance of power trade signals. Take note of the square symbols. The simple mode provides only the biggest trade signals, and the complex mode provides both the biggest and smallest trade signals.
- OBV - A running total of positive and negative volume . Take note of the diamond shaped symbols. Slow signals are really slow. Fast signals are really fast. Use according to your trading speed preference.
- Stochastics - A momentum oscillator that provides trade signals. Take note of the plus shaped symbols and factor them into your judgement on when to trade.
- CCI - Commodity Channel Index trade signals based on momentum. Take note of the X symbols.
- CMF - Chaikin Money Flow trade signals. Take note of the flag symbols.
- ADX - ADX is a component of the Directional Movement System developed by Welles Wilder. When it says to buy, I suggest that you go long, and then before it says to sell you try to sell. And then you can also try to go long before it says to buy. As soon as I see buy, I want to be in the stock and conversely, when I see sell I want to be out of it.
- Price-Volume Divergence - This indicator is a candle by candle indicator which shows that if volume is rising and price is falling, then there is bullish divergence , Conversely if price is rising and volume is falling there is bearish divergence. This a leading indicator.
- Ichimoku Clouds - This indicator just shows the clouds in the Ichimoku cloud system. It can be used to buy under the clouds and sell over the clouds. It can also be used as a possible support/resistance level during an uptrend/downtrend respectively.
- PSAR - Parabolic Stop and Reverse . Denotes uptrends/downtrends, by multiple dotted lines. You can use it by buying/selling when it breaks out of a downtrend/uptrend respectively. Or you can use it to sell/buy during an uptrend/downtrend respectively. Warning: it is generally slow. I find that it's very reliable from a 5 minute perspective.
- Fibonacci levels - People generally use Fibonacci levels for retracement for when a stock pulls back. I personally like to use it as a predictive tool along with looking at the slope. If the slope is negative/positive and moving away/near from 50% line then, I would be bearish / bullish respectively.
- Moving Average ( EMA and SMA ) lines - Exponential moving average and Smooth moving average lines. EMA lines move faster and SMA lines move slower. I like to use these lines as trend lines which can tell me if there is an uptrend or downtrend. The strength of the trend is shown by the distance away from the slowest EMA / SMA lines. I like to sell when it's far above the trendline, and buy when it's closer to the trendline. Be weary of the price crossing trendlines .
- Information Panel - (Price location, Trend Strength, Volatilty Ratio, Current State, Reversal/Continuation Odds): Mode 2 will give you basic price location info. Mode 3 is my favorite and will give you the most info. and Mode 4 will give you the Schwager volatility ratio which can help with stock selection; the higher the ratio, the more movement can be expected.
- Support & Resistance levels - Horizontal dotted lines which show the stock price and where it experiences support/resistance . Can be used in many ways. I like to use it by counting the number of support/resistance lines provided and if support lines exceed resistance lines, I will be more likely to go long.
- Candle Colors - Overlay a color onto the Candles. Note: I encourage the use of Heiken Ashi which helps a lot with low volume candles. Candles can be colored according to their location within the bands, and also according to a trailing stop loss based on Average True Range . Buy low, sell high for the location mode and for the stop loss mode, selling/buying is encouraged when the bars go completely red/green respectively.
- Linear Regression - Draws a (black) line of best fit, and shows 2 standard deviations away from the line of best fit above(red) and below(green). I suggest buying/selling below/above the line of best fit respectively. Strong buys or sells generally occur below or above the standard deviation lines respectively.

Cyber Momentum V2This Oscillator is another version of my previous Oscillator Cyber Momentum … in this version the CCI formula added to the core calculation therefore there is small differential behavior rather than Cyber Momentum because of different calculation methods …
But both of them are in the same concept; the most optimized signals are those that are in confluence of Cyber Momentum and Cyber Momentum V2 ...
