Gabriel's Asset Rotation System📈 Gabriel's Asset Rotation System
Overview
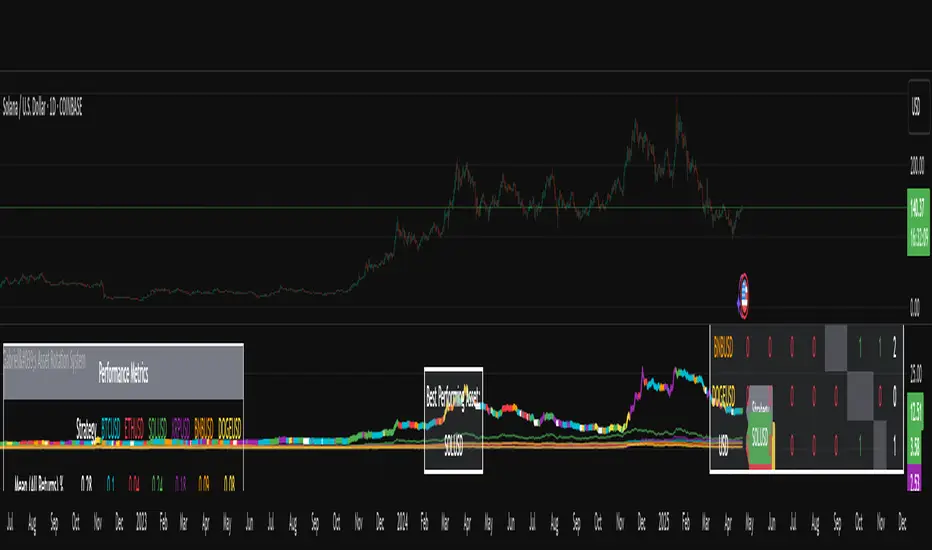
Gabriel’s Asset Rotation System is an advanced multi-asset trend-following tool that dynamically ranks and rotates up to 6 assets (plus USD) based on a customizable trend scoring matrix. Using enhanced signal detection techniques like Cauchy-weighted Supertrend, Jurík RSX, Fisherized CCI, Kalman-filtered PSAR, and Dynamic DMI Smoothing, the system identifies the most dominant asset and simulates strategy equity performance compared to buy-and-hold benchmarks.
🔍 Key Features
✅ Multi-Asset Rotation: Analyze up to 6 symbols and USD simultaneously.
✅ Relative Strength Matrix: Compares every asset against each other to find outperformers.
✅ Custom Trend Engine:
Jurik RSX with advanced RSX logic
Fisherized CCI for momentum confirmation
Kalman-smoothed PSAR for trend bias
SuperTrend using a Cauchy Moving Average
Smoothed DMI signal across looped periods (10–17)
✅ Dynamic Best Asset Detection: Identifies and tracks the asset with the highest trend score over time.
✅ Performance Table: Displays Sharpe, Sortino, and Omega Ratios along with drawdowns and means for both strategy and each asset.
✅ Visual Trend Matrix: Tabular view of asset strength comparisons against each other + final scoring.
✅ Realistic Strategy Equity Curve: Tracks performance assuming full capital rotation into the best asset.
✅ Alerts: Get notified when the top-performing asset changes.
⚙️ Inputs
🔹 Assets: Customize 6 tickers (crypto, stocks, ETFs, etc.)
🔹 Trend Classification Method:
RSI
CCI
SuperTrend
DMI
PSAR
or use all together
🔹 Jurik RSX Length
🔹 Fisherized CCI Length
🔹 Cauchy MA Gamma and ATR Settings
🔹 DMI Range and MA Type (SMA, EMA, HMA, etc.)
🔹 PSAR Parameters with Kalman smoothing
🔹 Custom Backtest Start Date
📊 Outputs
Plot 1: Best Asset Equity (colored dynamically)
Plot 2–7: Buy & Hold Curves for each asset (with labels)
Tables:
Rotation Matrix (bottom-right)
Best Performing Asset (bottom-center)
Performance Metrics Table (optional toggle)
🧠 Use Case Ideas
🔁 Dynamic Portfolio Rebalancing
⚖️ Compare Risk-Adjusted Returns Across Crypto or Stocks
🧪 Backtest Rotation Hypotheses
🚀 Identify Strongest Breakout Assets in Trend Environments
📉 Avoid Weakening Assets with Rising Drawdowns
🚨 Alerts
🔔 "New Optimal Asset": Triggers when a new top-ranking asset replaces the current one.
Tìm kiếm tập lệnh với "CCI"
Titan X 📈 Titan X – Optimized Trend Strategy with Gradient ZLEMA, RMI, CCI, ROC, and Volume Confirmation
Titan X is a precision-engineered trend-following strategy designed for crypto markets and high-volatility assets. It is not just a combination of indicators, but a carefully constructed, non-repainting system where each component plays a specific role in confirming high-probability trade setups. The strategy detects strong directional moves, confirms them with momentum and volume, and manages trade exits without relying on traditional stop losses.
🔍 How the Indicators Work Together
✅ 1. ZLEMA Baseline + Gradient Filter
A Zero Lag Exponential Moving Average (ZLEMA) is used to track directional trend with minimal lag.
A gradient (slope) is calculated from the ZLEMA to measure trend acceleration. This confirms whether a trend is gaining strength or losing momentum.
Entries are only taken when the ZLEMA gradient exceeds a user-defined threshold, ensuring trades are only taken in strong, developing trends.
✅ 2. RMI – Relative Momentum Index (with Memory)
RMI captures sustained momentum direction over time.
It helps validate that price isn't just spiking, but truly trending.
Titan X uses RMI as a trend memory filter, requiring consistent momentum alignment before entry.
✅ 3. Momentum Timing – ROC + CCI
The Rate of Change (ROC) determines the strength and direction of recent momentum.
The Commodity Channel Index (CCI) checks price deviation from a moving average baseline, identifying whether momentum is aligned with market structure.
This combo prevents trades in weak, flat, or conflicting conditions.
✅ 4. Volume Spike Confirmation
Titan X uses a relative volume filter, requiring the current bar’s volume to exceed a moving average threshold.
This ensures trades are only triggered when there is clear breakout interest from market participants, helping avoid fakeouts and low-volume moves.
🎯 Trade Entry & Exit Rules
✅ Entry Conditions:
All five filters must align:
Trend direction (ZLEMA slope)
Momentum (ROC & CCI)
Trend memory (RMI)
Volume (Spike filter)
Trades are entered on the next bar after all confirmations, ensuring 100% non-repainting behavior.
✅ Take Profit System (Multi-Level TP):
TP1: Closes 50% of the position at a user-defined % gain (default: 2%)
TP2: Closes the remaining 50% of the position at a higher % gain (default: 4%)
Each TP is executed via limit order to ensure realistic and backtestable fills.
❌ No Stop Loss Used
Instead of using fixed stop losses, Titan X closes positions early when trend conditions weaken.
This dynamic exit logic is based on a reversal in ZLEMA gradient, which serves as a weak trend detection system.
⏱️ Cooldown Logic
A 1-bar cooldown is enforced between trades to avoid same-bar exit/entry violations on TradingView.
This improves execution accuracy and avoids overtrading on choppy price action.
📊 Real-Time Strategy Dashboard
Titan X includes a live dashboard that provides full transparency:
Current Position (Long / Short / Flat)
Entry Price
TP1 Hit? / TP2 Hit?
Bars Since Entry
Win Rate (%)
Profit Factor
Ideal for both manual monitoring and automated bot strategies.
🔔 Bot-Ready Multi-Exchange Alerts
Alerts can be configured for:
ENTER-LONG, ENTER-SHORT
EXIT-LONG, EXIT-SHORT
TP1 / TP2 targets
Messages are fully customizable and designed for platforms like:
WonderTrading
3Commas
TradingConnector
⚙️ Designed For:
Timeframes: 1H and 4H (optimized for crypto)
Markets: Altcoins, BTC/ETH, high-volatility pairs
Traders: Trend-followers, momentum scalpers, algo bot users
Goal: High accuracy entries, structured exits, zero repainting, and flexible trade management
⚠️ TradingView Disclosure
This strategy is provided for educational purposes only. It does not constitute investment advice, nor does it guarantee any returns. Trading carries risk; test thoroughly before using in live environments.

DrawIndicatorOnTheChartLibrary "DrawIndicatorOnTheChart"
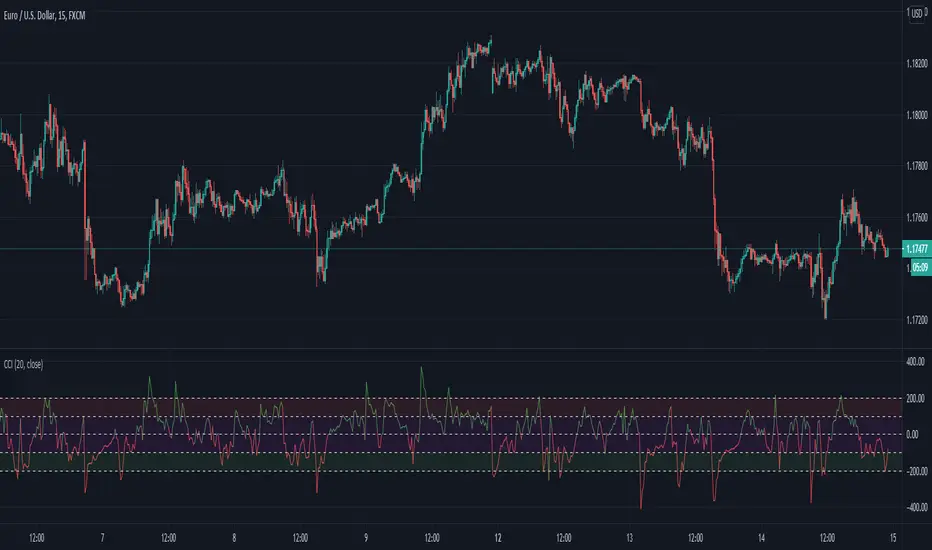
this library is used to show an indicator (such RSI, CCI, MOM etc) on the main chart with indicator's horizontal lines in a window. Location of the window is calculated dynamically by last price movemements
drawIndicator(enabled, indicatorName, indicator1, indicator2, indicator3, indicatorcolors, period, indimax_, indimin_, levels, precision, xlocation, lnwidth)
draws the realted indicator on the chart
Parameters:
enabled (bool) : if it's enabled to show
indicatorName (string) : is the indicator name as string such "RSI", "CCI" etc
indicator1 (float) : is first indicator you want to show, such rsi(close, 14), mom(close, 10) etc
indicator2 (float) : is second indicator you want to show, such -DI of DMI
indicator3 (float) : is third indicator you want to show, such ADX of DMI
indicatorcolors (array)
period (int) : is the length of the window to show
indimax_ (float) : is the maximum value of the indicator, for example for RSI it's 100.0, if the indicator (such CCI, MOM etc) doesn't have maximum value then use "na"
indimin_ (float) : is the minimum value of the indicator, for example for RSI it's 0.0, if the indicator (such CCI, MOM etc)doesn't have maximum value then use "na"
levels (array) : is the levels of the array for the horizontal lines. for example if you want horizontal lines at 30.0, and 70.0 then use array.from(30.0, 70.0). if no horizontal lines then use array.from(na)
precision (int) : is the precision/nuber of decimals that is used to show indicator values, for example for RSI set it 2
xlocation (int) : is end location of the indicator window, for example if xlocation = 0 window is created on the index of the last bar/candle
lnwidth (int) : is the line width of the indicator lines
Returns: none

Project R
Project R : Advanced Trading Strategy with Dynamic Entry Signals
Overview
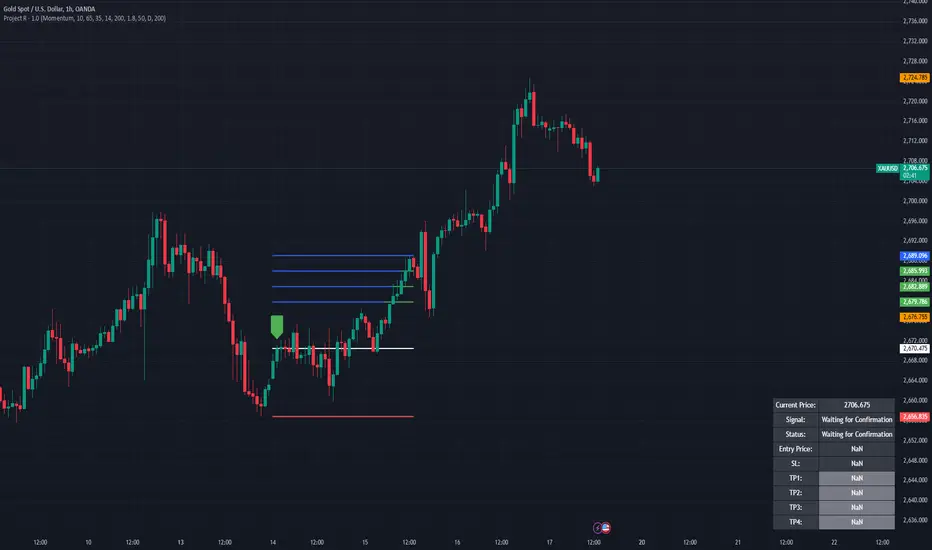
Project R is a comprehensive trading script tailored for traders seeking accuracy in market entries and exits. It merges multiple technical indicators—CCI, Momentum, RSI, and Mean Reversion Bands—with advanced trading tools like supply and demand zone detection, ATR-based stop-loss levels, and tiered take-profit targets. The script is designed to cater to both trend-following and mean-reversion strategies, offering dynamic adaptability to various market conditions. Its robust functionality and user-focused customization make it an invaluable tool for traders aiming to optimize their performance in live markets.
---
🔶 Key Features
1. Customizable Entry Signal Source
- Traders can select between CCI (Commodity Channel Index) and Momentum as the primary entry signal generator, depending on their preferred strategy.
- Additional confirmation through detection of regular bullish or bearish divergences within overbought and oversold zones of the RSI enhances signal reliability. This ensures the trader has an added layer of confidence in their decision-making.
2. Supply and Demand Area Tracking
- The script scans historical price action to detect critical supply and demand zones , areas where significant buying or selling interest has previously occurred.
- These zones are plotted on the chart to help traders anticipate reversals or breakouts, making it easier to identify high-probability entry and exit points.
3. Mean Reversion Bands
- EMA-based mean reversion bands provide clear visual guidance for traders employing mean-reversion strategies.
- The bands are calculated with adjustable multipliers, allowing traders to customize their sensitivity and identify optimal buy and sell zones within ranging markets.
4. ATR-Based Stop Loss and Take Profit Levels
- Dynamic risk management is achieved by calculating stop-loss levels and up to four take-profit targets using Average True Range (ATR) multipliers.
- This ensures that stop-loss and take-profit levels adjust automatically to market volatility, providing consistent risk-reward ratios tailored to prevailing conditions.
5. Higher Time Frame Confirmation
- The integration of a higher time frame EMA (Exponential Moving Average) filter ensures that trades are executed in alignment with broader market trends, increasing the probability of success.
- This feature is especially useful for traders who prioritize trend-following strategies and seek confirmation from larger time frames.
6. Status Tracking
- A dynamic status system displays the current state of the trade (e.g., "Waiting for Confirmation," "Enter Buy," or "Enter Sell") directly on the chart.
- The script also monitors and logs whether the stop loss or individual take-profit targets have been achieved, providing real-time updates for active trades.
---
🔹 Usage
How It Works
- Buy Signals : A buy signal is generated when the following conditions are met:
1. The chosen entry signal (CCI/Momentum) crosses upward, indicating bullish momentum.
2. RSI is in the oversold range or exhibits bullish divergence, signaling potential upward reversal.
3. Price is positioned above the higher time frame EMA and approaches identified demand zones, reinforcing a high-probability entry.
- Sell Signals: A sell signal is triggered when:
1. The chosen entry signal crosses downward, indicating bearish momentum.
2. RSI is in the overbought range or exhibits bearish divergence, suggesting potential downward reversal.
3. Price is positioned below the higher time frame EMA and approaches supply zones, aligning with bearish market sentiment.
- Stop Loss and Take Profit:
- Stop-loss levels are calculated dynamically based on ATR values, ensuring they adapt to market volatility.
- Multiple take-profit levels are provided to enable traders to scale out of positions incrementally, optimizing profit-taking strategies.
---
🔹 Practical Examples
- Mean Reversion Strategy: In ranging markets, traders can use the lower band as a buy zone and the upper band as a sell zone. For instance, when the price approaches the lower mean reversion band near a demand area, a buy signal is generated if other criteria are met.
- Trend Following Strategy: By aligning entries with the direction of the higher time frame EMA, traders can participate in long-term trends with greater confidence. For example, entering a buy trade when price crosses above the 50 EMA on a 1-hour chart ensures alignment with the dominant trend.
---
🔹 Visual Options
- Users can fully customize the color schemes, line styles, and visibility of key features, including:
- Mean reversion bands.
- Supply and demand zones.
- Take-profit and stop-loss levels.
- Entry points and trade progression are visually marked, ensuring traders can track real-time performance effortlessly.
---
🔶 Why Invite-Only?
Innovative Design
- Project R integrates advanced techniques, such as combining multiple indicators with supply and demand zone detection, to create a holistic and adaptable strategy.
- The use of ATR-based dynamic risk management and higher time frame confirmation offers traders a competitive edge in volatile markets.
Comprehensive Features
- The script provides a seamless trading experience by combining analysis, execution, and risk management in one tool.
- Its ability to cater to different trading styles (trend-following, mean-reversion, and divergence-based trading) ensures versatility and wide appeal.
Performance and Utility
- Real-time tracking, dynamic risk management, and precision in signal generation position Project R as a professional-grade tool that is suitable for traders of all levels.
- These features merit invite-only access to ensure the integrity of its use and provide exclusivity to dedicated traders who seek advanced functionality.
---
🔹 Settings
- Entry Signal Source: Choose between CCI and Momentum as the primary signal generator.
- RSI Levels: Adjust overbought and oversold thresholds to fine-tune divergence detection.
- ATR Multipliers: Customize stop-loss and take-profit levels based on your risk tolerance.
- Higher Time Frame EMA: Configure the higher time frame and EMA period to align with your preferred strategy.
- Supply/Demand Lookback Period: Modify the range for identifying supply and demand zones to suit market conditions.
- Mean Reversion Bands: Toggle the bands on or off and adjust their multipliers for a tailored mean-reversion strategy.
PUMP IndicatorsPUMP Indicator Description
★ Supported Markets and Assets
The PUMP indicator is a versatile tool that can be effectively applied to various markets and assets, including:
▶ Korean Stocks: KOSPI, KOSDAQ, etc.
▶ U.S. Stocks: NYSE, NASDAQ, etc.
▶ Cryptocurrencies: Major cryptocurrencies such as Bitcoin (BTC), Ethereum (ETH), etc.
▶ Futures: Major futures contracts like gold, silver, crude oil, etc.
▶ ETFs: SPY, QQQ, etc.
★ Indicator Description
The PUMP indicator is designed to analyze price divergence and volatility.
It is provided with minimal representation on the chart, allowing users to use it in conjunction with other indicators, such as classical RSI, TRIX, CCI, ADX, BWI, Bollinger Bands, etc.
Everything displayed on the chart can be turned on or off in the options, allowing users to customize their setup.
The PUMP indicator is based on the concept of the MACD indicator, which calculates the difference between the leading line and the lagging line to generate signals.
GOOD, UP, and CR signals predict price increases.
DOWN and BAD signals predict price decreases.
WARN emphasizes that the buy position is not certain, regardless of price increases or decreases.
Therefore, the PUMP indicator is good to use with other indicators. It visually displays divergence and volatility signals along with the MACD movements below, and users can receive alerts for movements in their interested stocks using the alarm function.
It can be used as an indicator for viewing buy and sell signals, as well as predicting the price flow.
▶ (Drawback) Unlike typical TRIX, RSI, TRIX, CCI, ADX, BWI indicators, which are implemented in a new lower window, the PUMP indicator displays both signals and the leading and lagging lines simultaneously, so it is not implemented in a new window, meaning the baseline may vary depending on the daily chart appearance.
★ The PUMP indicator consists of the following components:
▶ PUMP Indicator Leading and Lagging Lines
PUMP t: Leading line (yellow)
PUMP p: Lagging line (blue)
The MACD displayed at the bottom of the chart calculates the divergence between the PUMP t leading line and the PUMP p lagging line.
▶ EA Formula
The core calculation of the PUMP indicator is as follows:
EA (Exponential Average): 100 * (eavg1 / eavg2)
Where eavg1 is the short-term EMA, and eavg2 is the long-term EMA.
It calculates the divergence of the index.
▶ The PUMP indicator is a fixed indicator (cannot be arbitrarily modified).
▶ Highlights: The method of calculating the interval or number of uses is an important part of the index calculation and is therefore private.
★ Signal Description
The PUMP indicator provides a total of six major signals:
▶ UP Signal: Occurs when the divergence between the MACD PUMP t leading line and PUMP p lagging line narrows, and the divergence of the exponential moving average widens compared to before.
▶ DOWN Signal: Occurs when the MACD PUMP t leading line crosses above the PUMP p lagging line.
▶ GOOD Signal: Represents an UP signal with added volume.
(The GOOD signal is not necessarily better than the UP signal. If a GOOD signal appears in a stock that has sufficiently fallen in price, it helps understand that a rebound has started. Therefore, the GOOD signal is made to find a rebound in stocks that have continuously declined, rather than finding signals in consistently rising prices.)
▶ BAD Signal: Occurs when the PUMP t leading line crosses above the 0 baseline, indicating a potential sell signal.
▶ WARN Signal: A warning signal occurring at high levels, indicating that buying is not recommended (regardless of buy or sell).
▶ CR Signal: Occurs in all sections where the PUMP t leading line crosses below the PUMP p lagging line.
★ Lower MACD Horizontal Baseline
The PUMP indicator provides three horizontal baselines from the MACD indicator for additional analysis:
▶ Pump H
▶ PUMP M
▶ PUMP L
It visually provides the divergence of the lower MACD indicator for rising and falling changes, with the default set to 0, and users can change the numbers in the options as needed.
★ Moving Averages
The PUMP indicator provides three basic moving averages:
▶ Buzz 7: 7-day moving average
▶ Buzz 26: 26-day moving average
▶ Buzz 120: 120-day moving average
The number of moving averages is fixed, but users can use them in conjunction with the moving averages provided by TradingView as needed.
★ Alert Function
Using the Alert function of TradingView, you can set alerts for various signals generated by the PUMP indicator.
▶ GOOD Signal Alert
▶ UP Signal Alert
▶ CR Signal Alert
▶ DOWN Signal Alert
▶ BAD Signal Alert
▶ WARN Signal Alert
★ Usage
1. The PUMP indicator is not focused on buy and sell signals but calculates the current price movement and divergence and is designed to express it through MACD leading and lagging lines and signals.
2. The PUMP indicator can be used alone or in conjunction with other indicators for technical analysis.
3. You can analyze buy and sell using the signals of the PUMP indicator along with fundamental analysis, such as news, issues, national policies, company profits, and sales increases.
4. The MACD leading and lagging lines at the bottom of the chart move inversely to the price, ensuring that the PUMP indicator does not interfere when used with other indicators.
5. You can receive real-time alerts using the alarm function.
Below, we attach pictures to help users understand.
============================================
PUMP 인디케이터 설명(한글)
★ 지원되는 시장 및 자산
PUMP 표시기는 다음과 같은 다양한 시장 및 자산에 효과적으로 적용할 수 있는 다용도 도구입니다:
▶ 한국주식: KOSPI, KOSDAQ 등.
▶ 미국주식: NYSE, NASDAQ 등.
▶ 암호화폐: 비트코인(BTC), 이더리움(ETH) 등 주요 암호화폐.
▶ 선물 : 금, 은, 원유 등 주요 선물 계약.
▶ 상장지수펀드(ETF) : SPY, QQQ 등.
★ 지표 설명
PUMP 지표는 가격 이격과 변동성을 분석하도록 설계되었습니다.
사용자가 만든 지표 또는 고전 RSI, TRIX, CCI, ADX, BWI, Bollinger Bands 등과 함께 사용할 수 있게 차트에 최소한의 표현으로 제공됩니다.
그리고 차트에 표현되는 모든 것들을 옵션에서 on / off 가능하게 하였기에 사용자가 커스텀 할 수 있게 하였습니다.
PUMP 지표 신호를 생성하기 위해 선행 라인과 후행 라인 간의 차이를 계산하는 MACD 지표의 개념을 기반으로 합니다.
GOOD, UP, CR 신호는 가격 상승을 예측합니다.
DOWN, BAD 신호는 가격 하락을 예측합니다.
WARN은 가격 상승과 하락에 관계없이, 매수 자리는 확실히 아님을 강조한 신호입니다.
그러므로 PUMP 지표는 다른 지표와 함께 사용하기 좋고, 이격과 변동성을 신호와 하단 MACD 움직임을 눈으로 볼 수 있으며, 알람 기능을 활용하여 관심 있는 종목의 움직임을 알람으로 받아 볼 수 있는 지표입니다.
매수와 매도를 보는 지표로 사용할 수 있으며, 가격의 흐름을 예상하는 지표로 사용할 수 있습니다.
▶ (단점) 보통의 TRIX, RSI, TRIX, CCI, ADX, BWI 지표들은 하단의 새로운 창에서 구현됩니다. 하지만 PUMP 지표는 신호와 하단 선행과 후행을 동시에 표현하기 때문에 새로운 창에서 구현되지 않기에 기준 축이 일봉의 모습에 따라 달라질 수 있습니다.
★ PUMP 지표는 다음과 같은 구성요소로 구성됩니다
▶ PUMP 지표 선행과 후행
PUMP t : 선행라인 (노란색)
PUMP p : 후행라인 (파란색)
차트 하단에 나타나는 MACD는 PUMP t선행라인과 PUMP p 후행라인의 이격도를 계산합니다.
▶ EA공식
PUMP 지표의 핵심 계산식은 다음과 같습니다:
EA(지수평균): 100 * (eavg1 / eavg2)
여기서 eavg1은 단기 EMA이고 eavg2는 장기 EMA입니다.
지수의 이격도를 계산합니다.
▶ PUMP 지표는 고정 지표입니다. (임의 수정 불가)
▶ 강조 : 이격의 계산법이나 사용하는 숫자는 지표 계산의 중요한 부분이므로 비공개입니다.
★ 신호 설명
PUMP 표시등은 총 6개의 주요 신호를 제공합니다:
▶ UP 신호: MACD PUMP t 선행과 PUMP p 후행의 이격이 줄어들 때, 지수 이동 평균의 이격도가 이전 보다 넓어지면 발생합니다.
▶ DOWN 신호: MACD PUMP t 선행이 PUMP p 후행을 상향 교차할 때 발생합니다.
▶ GOOD 신호: 거래량이 추가된 UP 신호를 나타냅니다.
(GOOD 신호가 UP 신호보다 좋다기 보다, 충분히 가격 하락한 종목에서 GOOD 신호가 나온다면 반등이 시작되는 것을 이해할 수 있게 만든 지표입니다. 그러므로 GOOD 신호는 가격이 꾸준히 상승하는 곳에서 신호를 찾기보다, 지속 하락하다 반등을 찾는 신호로 만들었습니다.)
▶ BAD 신호: PUMP t 선행이 0 기준선 이상으로 교차할 때 발생하며, 이는 잠재적인 판매 신호를 나타냅니다.
▶ 경고 신호: 높은 수준에서 발생하는 경고 신호로, 매수가 권장되지 않음을 나타냅니다(매수, 매도와 무관함).
▶ CR 신호: PUMP t 선행 라인이 PUMP p 후행 라인 아래로 교차하는 모든 구간에서 발생합니다.
★ 하단 MACD 가로 기준선
PUMP 표시기는 추가 분석을 위해 MACD 지표에서 3가지 가로 기준을 제공합니다:
▶ pump H
▶ PUMP M
▶ PUMP L
하단의 MACD 지표의 이격도를 상승 및 하강의 변화를 시각적으로 기준을 만들 수 있게 제공하며, 기본은 0으로 제공하고, 사용자의 필요에 따라 옵션에서 숫자를 변경할 수 있게 하였습니다.
★ 이동 평균
PUMP 표시기는 세 가지 기본 이동 평균을 제공 합니다:
▶ Buzz 7: 7일 이동 평균
▶ Buzz 26: 26일 이동 평균
▶ Buzz 120 : 120일 이동 평균
이동 평균의 수는 고정되어 있지만, 사용자는 필요에 따라 TradingView에서 제공하는 이동 평균과 함께 사용할 수 있습니다.
★ 알림 기능
TradingView의 Alert 기능을 사용하여 PUMP 지표 생성되는 다양한 신호에 대한 Alert를 설정할 수 있습니다.
▶ GOOD 신호 알림
▶ UP 신호 알림
▶ CR 신호 알림
▶ DOWN 신호 알림
▶ BAD 신호 알림
▶ WARN 신호 알림
★ 사용법
1.PUMP 지표는 매수와 매도에 중점을 둔 지표가 아니며 현재 가격의 움직임과 이격도를 계산하며 MACD 선행과 후행 그리고 신호로 표현하기 위해 만들어진 지표입니다.
2. PUMP 지표는 단일로 사용할 수 있고, 또는 다른 지표와 함께 기술적분석으로 사용할 수 있습니다.
3. 뉴스와 이슈, 국가의 정책, 회사의 이익, 매출의 상승 등 기본적분석과 함께 PUMP 지표의 신호를 이용하여 매수와 매도 분석을 할 수 있습니다.
4. 차트 하단의 MACD 선행과 후행은 가격의 움직임을 반대로 움직이며, 가격과 반대로 움직이게 함으로써 다른 지표와 함께 사용하였을 때, PUMP 지표가 방해가 되지 않게 하였습니다.
5. 알람을 사용하여 실시간으로 알람을 받아 보실 수 있습니다.
아래 사진을 첨부하여 사용자 이해를 돕습니다.
============================================
UP신호는 이격을
▶ The UP signal indicates horizontal divergence.
CR신호는 선행이 후행을 아래로 돌파
▶ The CR signal indicates vertical divergence when the leading line crosses below the lagging line.
WARN 신호를 확인
▶ Check the WARN signal.
BAD와 DOWN 신호
▶ BAD and DOWN signals.
PUMP 지표의 기준 3개
3 criteria for PUMP indicators
따로 그림을 그리지 않은 차트
▶ A chart without separate drawings.
============================================
다른 지표와 + 조합
+ Combination with other indicators

MyLibrary_functions_D_S_3D_D_T_PART_1Library "MyLibrary_functions_D_S_3D_D_T_PART_1"
TODO: add library description here
color_(upcolor_txt, upcolor, dncolor_txt, dncolor, theme)
Parameters:
upcolor_txt (color)
upcolor (color)
dncolor_txt (color)
dncolor (color)
theme (string)
Source_Zigzag_F(Source)
Parameters:
Source (string)
p_lw_hg(Source_low, Source_high, Depth)
Parameters:
Source_low (float)
Source_high (float)
Depth (int)
lowing_highing(Source_low, Source_high, p_lw, p_hg, Deviation)
Parameters:
Source_low (float)
Source_high (float)
p_lw (int)
p_hg (int)
Deviation (int)
ll_lh(lowing, highing)
Parameters:
lowing (bool)
highing (bool)
down_ll_down_lh(ll, lh, Backstep)
Parameters:
ll (int)
lh (int)
Backstep (int)
down(down_ll, down_lh, lw, hg)
Parameters:
down_ll (bool)
down_lh (bool)
lw (int)
hg (int)
f_x_P_S123_lw(lw_, hg_, p_lw_, down, Source_low)
Parameters:
lw_ (int)
hg_ (int)
p_lw_ (int)
down (int)
Source_low (float)
f_x_P_S123_hg(lw_, hg_, p_hg_, down, Source_high)
Parameters:
lw_ (int)
hg_ (int)
p_hg_ (int)
down (int)
Source_high (float)
Update_lw_hg_last_l_last_h(lw, hg, last_l, last_h, p_lw, p_hg, down, Source_low, Source_high)
Parameters:
lw (int)
hg (int)
last_l (int)
last_h (int)
p_lw (int)
p_hg (int)
down (int)
Source_low (float)
Source_high (float)
x1_P_y1_P_x2_P_y2_P_x3_P_y3_P_x4_P_y4_P(lw, hg, last_l, last_h, Source)
Parameters:
lw (int)
hg (int)
last_l (int)
last_h (int)
Source (string)
x1_P_os(lw, hg, x2_D, Diverjence_MACD_Line_, Diverjence_MACD_Histagram_, Diverjence_RSI_, Diverjence_Stochastic_, Diverjence_volume_, Diverjence_CCI_, Diverjence_MFI_, Diverjence_Momentum_, Diverjence_OBV_, Diverjence_ADX_, MACD, hist_MACD, RSI, volume_ok, Stochastic_K, CCI, MFI, momentum, OBV, adx)
Parameters:
lw (int)
hg (int)
x2_D (int)
Diverjence_MACD_Line_ (bool)
Diverjence_MACD_Histagram_ (bool)
Diverjence_RSI_ (bool)
Diverjence_Stochastic_ (bool)
Diverjence_volume_ (bool)
Diverjence_CCI_ (bool)
Diverjence_MFI_ (bool)
Diverjence_Momentum_ (bool)
Diverjence_OBV_ (bool)
Diverjence_ADX_ (bool)
MACD (float)
hist_MACD (float)
RSI (float)
volume_ok (float)
Stochastic_K (float)
CCI (float)
MFI (float)
momentum (float)
OBV (float)
adx (float)
x3_P_os(lw, hg, x2_D, x4_D, Diverjence_MACD_Line_, Diverjence_MACD_Histagram_, Diverjence_RSI_, Diverjence_Stochastic_, Diverjence_volume_, Diverjence_CCI_, Diverjence_MFI_, Diverjence_Momentum_, Diverjence_OBV_, Diverjence_ADX_, MACD, hist_MACD, RSI, volume_ok, Stochastic_K, CCI, MFI, momentum, OBV, adx)
Parameters:
lw (int)
hg (int)
x2_D (int)
x4_D (int)
Diverjence_MACD_Line_ (bool)
Diverjence_MACD_Histagram_ (bool)
Diverjence_RSI_ (bool)
Diverjence_Stochastic_ (bool)
Diverjence_volume_ (bool)
Diverjence_CCI_ (bool)
Diverjence_MFI_ (bool)
Diverjence_Momentum_ (bool)
Diverjence_OBV_ (bool)
Diverjence_ADX_ (bool)
MACD (float)
hist_MACD (float)
RSI (float)
volume_ok (float)
Stochastic_K (float)
CCI (float)
MFI (float)
momentum (float)
OBV (float)
adx (float)
Err_test(lw, hg, x1, y1, x2, y2, y_d, start, finish, Err_Rate)
Parameters:
lw (int)
hg (int)
x1 (int)
y1 (float)
x2 (int)
y2 (float)
y_d (float)
start (int)
finish (int)
Err_Rate (float)
divergence_calculation(Feasibility_RD, Feasibility_HD, Feasibility_ED, lw, hg, Source_low, Source_high, x1_P_pr, x3_P_pr, x1_P_os, x3_P_os, x2_P_pr, x4_P_pr, oscillator, Fix_Err_Mid_Point_Pr, Fix_Err_Mid_Point_Os, Err_Rate_permissible_Mid_Line_Pr, Err_Rate_permissible_Mid_Line_Os, Number_of_price_periods_R_H, Permissible_deviation_factor_in_Pr_R_H, Number_of_oscillator_periods_R_H, Permissible_deviation_factor_in_OS_R_H, Number_of_price_periods_E, Permissible_deviation_factor_in_Pr_E, Number_of_oscillator_periods_E, Permissible_deviation_factor_in_OS_E)
Parameters:
Feasibility_RD (bool)
Feasibility_HD (bool)
Feasibility_ED (bool)
lw (int)
hg (int)
Source_low (float)
Source_high (float)
x1_P_pr (int)
x3_P_pr (int)
x1_P_os (int)
x3_P_os (int)
x2_P_pr (int)
x4_P_pr (int)
oscillator (float)
Fix_Err_Mid_Point_Pr (bool)
Fix_Err_Mid_Point_Os (bool)
Err_Rate_permissible_Mid_Line_Pr (float)
Err_Rate_permissible_Mid_Line_Os (float)
Number_of_price_periods_R_H (int)
Permissible_deviation_factor_in_Pr_R_H (float)
Number_of_oscillator_periods_R_H (int)
Permissible_deviation_factor_in_OS_R_H (float)
Number_of_price_periods_E (int)
Permissible_deviation_factor_in_Pr_E (float)
Number_of_oscillator_periods_E (int)
Permissible_deviation_factor_in_OS_E (float)
label_txt(label_ID, zigzag_Indicator_1_, zigzag_Indicator_2_, zigzag_Indicator_3_)
Parameters:
label_ID (string)
zigzag_Indicator_1_ (bool)
zigzag_Indicator_2_ (bool)
zigzag_Indicator_3_ (bool)
delet_scan_item_1(string_, NO_1, GAP)
Parameters:
string_ (string)
NO_1 (int)
GAP (int)
delet_scan_item_2(string_, NO_1, GAP)
Parameters:
string_ (string)
NO_1 (int)
GAP (int)
calculation_Final_total(MS_MN, Scan_zigzag_NO, zigzag_Indicator, zigzag_Indicator_1, zigzag_Indicator_2, zigzag_Indicator_3, LW_hg_P2, LW_hg_P1, lw_1, lw_2, lw_3, hg_1, hg_2, hg_3, lw_hg_D_POINT_ad_Array, lw_hg_D_POINT_id_Array, Array_Regular_MS, Array_Hidden_MS, Array_Exaggerated_MS, Array_Regular_MN, Array_Hidden_MN, Array_Exaggerated_MN)
Parameters:
MS_MN (string)
Scan_zigzag_NO (string)
zigzag_Indicator (bool)
zigzag_Indicator_1 (bool)
zigzag_Indicator_2 (bool)
zigzag_Indicator_3 (bool)
LW_hg_P2 (int)
LW_hg_P1 (int)
lw_1 (int)
lw_2 (int)
lw_3 (int)
hg_1 (int)
hg_2 (int)
hg_3 (int)
lw_hg_D_POINT_ad_Array (array)
lw_hg_D_POINT_id_Array (array)
Array_Regular_MS (array)
Array_Hidden_MS (array)
Array_Exaggerated_MS (array)
Array_Regular_MN (array)
Array_Hidden_MN (array)
Array_Exaggerated_MN (array)
Search_piote_1(array_id_7, scan_no)
Parameters:
array_id_7 (array)
scan_no (int)

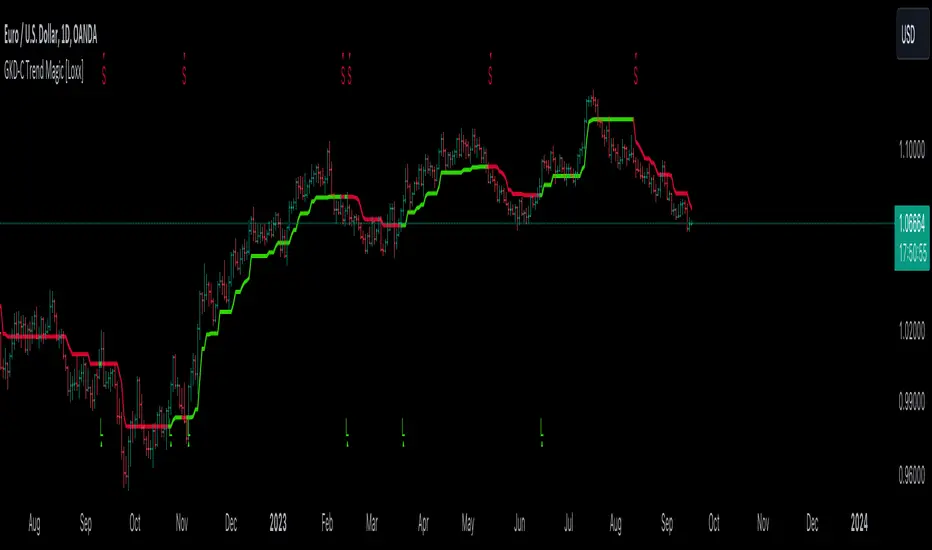
GKD-C Trend Magic [Loxx]The Giga Kaleidoscope GKD-C Trend Magic is a confirmation module included in Loxx's "Giga Kaleidoscope Modularized Trading System."
█ GKD-C Trend Magic
Trend Magic is a very old MT4 indicator used in Forex trading. Trend Magic utilizes the Average True Range (ATR) and the Commodity Channel Index (CCI) to determine market conditions. Firstly, the ATR is calculated based on a specific period to gauge market volatility. Using this, potential upward and downward thresholds are determined from the high and low prices, respectively. The CCI is then computed for a given period using a typical price (average of high, low, and close). Depending on the CCI's value, the algorithm sets a threshold value and assigns a corresponding color, green for positive CCI values indicating potential upward momentum, and red for negative values, indicating potential downward momentum.
█ Giga Kaleidoscope Modularized Trading System
Core components of an NNFX algorithmic trading strategy
The NNFX algorithm is built on the principles of trend, momentum, and volatility. There are six core components in the NNFX trading algorithm:
1. Volatility - price volatility; e.g., Average True Range, True Range Double, Close-to-Close, etc.
2. Baseline - a moving average to identify price trend
3. Confirmation 1 - a technical indicator used to identify trends
4. Confirmation 2 - a technical indicator used to identify trends
5. Continuation - a technical indicator used to identify trends
6. Volatility/Volume - a technical indicator used to identify volatility/volume breakouts/breakdown
7. Exit - a technical indicator used to determine when a trend is exhausted
8. Metamorphosis - a technical indicator that produces a compound signal from the combination of other GKD indicators*
*(not part of the NNFX algorithm)
What is Volatility in the NNFX trading system?
In the NNFX (No Nonsense Forex) trading system, ATR (Average True Range) is typically used to measure the volatility of an asset. It is used as a part of the system to help determine the appropriate stop loss and take profit levels for a trade. ATR is calculated by taking the average of the true range values over a specified period.
True range is calculated as the maximum of the following values:
-Current high minus the current low
-Absolute value of the current high minus the previous close
-Absolute value of the current low minus the previous close
ATR is a dynamic indicator that changes with changes in volatility. As volatility increases, the value of ATR increases, and as volatility decreases, the value of ATR decreases. By using ATR in NNFX system, traders can adjust their stop loss and take profit levels according to the volatility of the asset being traded. This helps to ensure that the trade is given enough room to move, while also minimizing potential losses.
Other types of volatility include True Range Double (TRD), Close-to-Close, and Garman-Klass
What is a Baseline indicator?
The baseline is essentially a moving average, and is used to determine the overall direction of the market.
The baseline in the NNFX system is used to filter out trades that are not in line with the long-term trend of the market. The baseline is plotted on the chart along with other indicators, such as the Moving Average (MA), the Relative Strength Index (RSI), and the Average True Range (ATR).
Trades are only taken when the price is in the same direction as the baseline. For example, if the baseline is sloping upwards, only long trades are taken, and if the baseline is sloping downwards, only short trades are taken. This approach helps to ensure that trades are in line with the overall trend of the market, and reduces the risk of entering trades that are likely to fail.
By using a baseline in the NNFX system, traders can have a clear reference point for determining the overall trend of the market, and can make more informed trading decisions. The baseline helps to filter out noise and false signals, and ensures that trades are taken in the direction of the long-term trend.
What is a Confirmation indicator?
Confirmation indicators are technical indicators that are used to confirm the signals generated by primary indicators. Primary indicators are the core indicators used in the NNFX system, such as the Average True Range (ATR), the Moving Average (MA), and the Relative Strength Index (RSI).
The purpose of the confirmation indicators is to reduce false signals and improve the accuracy of the trading system. They are designed to confirm the signals generated by the primary indicators by providing additional information about the strength and direction of the trend.
Some examples of confirmation indicators that may be used in the NNFX system include the Bollinger Bands, the MACD (Moving Average Convergence Divergence), and the MACD Oscillator. These indicators can provide information about the volatility, momentum, and trend strength of the market, and can be used to confirm the signals generated by the primary indicators.
In the NNFX system, confirmation indicators are used in combination with primary indicators and other filters to create a trading system that is robust and reliable. By using multiple indicators to confirm trading signals, the system aims to reduce the risk of false signals and improve the overall profitability of the trades.
What is a Continuation indicator?
In the NNFX (No Nonsense Forex) trading system, a continuation indicator is a technical indicator that is used to confirm a current trend and predict that the trend is likely to continue in the same direction. A continuation indicator is typically used in conjunction with other indicators in the system, such as a baseline indicator, to provide a comprehensive trading strategy.
What is a Volatility/Volume indicator?
Volume indicators, such as the On Balance Volume (OBV), the Chaikin Money Flow (CMF), or the Volume Price Trend (VPT), are used to measure the amount of buying and selling activity in a market. They are based on the trading volume of the market, and can provide information about the strength of the trend. In the NNFX system, volume indicators are used to confirm trading signals generated by the Moving Average and the Relative Strength Index. Volatility indicators include Average Direction Index, Waddah Attar, and Volatility Ratio. In the NNFX trading system, volatility is a proxy for volume and vice versa.
By using volume indicators as confirmation tools, the NNFX trading system aims to reduce the risk of false signals and improve the overall profitability of trades. These indicators can provide additional information about the market that is not captured by the primary indicators, and can help traders to make more informed trading decisions. In addition, volume indicators can be used to identify potential changes in market trends and to confirm the strength of price movements.
What is an Exit indicator?
The exit indicator is used in conjunction with other indicators in the system, such as the Moving Average (MA), the Relative Strength Index (RSI), and the Average True Range (ATR), to provide a comprehensive trading strategy.
The exit indicator in the NNFX system can be any technical indicator that is deemed effective at identifying optimal exit points. Examples of exit indicators that are commonly used include the Parabolic SAR, the Average Directional Index (ADX), and the Chandelier Exit.
The purpose of the exit indicator is to identify when a trend is likely to reverse or when the market conditions have changed, signaling the need to exit a trade. By using an exit indicator, traders can manage their risk and prevent significant losses.
In the NNFX system, the exit indicator is used in conjunction with a stop loss and a take profit order to maximize profits and minimize losses. The stop loss order is used to limit the amount of loss that can be incurred if the trade goes against the trader, while the take profit order is used to lock in profits when the trade is moving in the trader's favor.
Overall, the use of an exit indicator in the NNFX trading system is an important component of a comprehensive trading strategy. It allows traders to manage their risk effectively and improve the profitability of their trades by exiting at the right time.
What is an Metamorphosis indicator?
The concept of a metamorphosis indicator involves the integration of two or more GKD indicators to generate a compound signal. This is achieved by evaluating the accuracy of each indicator and selecting the signal from the indicator with the highest accuracy. As an illustration, let's consider a scenario where we calculate the accuracy of 10 indicators and choose the signal from the indicator that demonstrates the highest accuracy.
The resulting output from the metamorphosis indicator can then be utilized in a GKD-BT backtest by occupying a slot that aligns with the purpose of the metamorphosis indicator. The slot can be a GKD-B, GKD-C, or GKD-E slot, depending on the specific requirements and objectives of the indicator. This allows for seamless integration and utilization of the compound signal within the GKD-BT framework.
How does Loxx's GKD (Giga Kaleidoscope Modularized Trading System) implement the NNFX algorithm outlined above?
Loxx's GKD v2.0 system has five types of modules (indicators/strategies). These modules are:
1. GKD-BT - Backtesting module (Volatility, Number 1 in the NNFX algorithm)
2. GKD-B - Baseline module (Baseline and Volatility/Volume, Numbers 1 and 2 in the NNFX algorithm)
3. GKD-C - Confirmation 1/2 and Continuation module (Confirmation 1/2 and Continuation, Numbers 3, 4, and 5 in the NNFX algorithm)
4. GKD-V - Volatility/Volume module (Confirmation 1/2, Number 6 in the NNFX algorithm)
5. GKD-E - Exit module (Exit, Number 7 in the NNFX algorithm)
6. GKD-M - Metamorphosis module (Metamorphosis, Number 8 in the NNFX algorithm, but not part of the NNFX algorithm)
(additional module types will added in future releases)
Each module interacts with every module by passing data to A backtest module wherein the various components of the GKD system are combined to create a trading signal.
That is, the Baseline indicator passes its data to Volatility/Volume. The Volatility/Volume indicator passes its values to the Confirmation 1 indicator. The Confirmation 1 indicator passes its values to the Confirmation 2 indicator. The Confirmation 2 indicator passes its values to the Continuation indicator. The Continuation indicator passes its values to the Exit indicator, and finally, the Exit indicator passes its values to the Backtest strategy.
This chaining of indicators requires that each module conform to Loxx's GKD protocol, therefore allowing for the testing of every possible combination of technical indicators that make up the six components of the NNFX algorithm.
What does the application of the GKD trading system look like?
Example trading system:
Backtest: Multi-Ticker CC Backtest
Baseline: Hull Moving Average
Volatility/Volume: Hurst Exponent
Confirmation 1: Advance Trend Pressure as shown on the chart above
Confirmation 2: uf2018
Continuation: Coppock Curve
Exit: Rex Oscillator
Metamorphosis: Baseline Optimizer
Each GKD indicator is denoted with a module identifier of either: GKD-BT, GKD-B, GKD-C, GKD-V, GKD-M, or GKD-E. This allows traders to understand to which module each indicator belongs and where each indicator fits into the GKD system.
█ Giga Kaleidoscope Modularized Trading System Signals
Standard Entry
1. GKD-C Confirmation gives signal
2. Baseline agrees
3. Price inside Goldie Locks Zone Minimum
4. Price inside Goldie Locks Zone Maximum
5. Confirmation 2 agrees
6. Volatility/Volume agrees
1-Candle Standard Entry
1a. GKD-C Confirmation gives signal
2a. Baseline agrees
3a. Price inside Goldie Locks Zone Minimum
4a. Price inside Goldie Locks Zone Maximum
Next Candle
1b. Price retraced
2b. Baseline agrees
3b. Confirmation 1 agrees
4b. Confirmation 2 agrees
5b. Volatility/Volume agrees
Baseline Entry
1. GKD-B Baseline gives signal
2. Confirmation 1 agrees
3. Price inside Goldie Locks Zone Minimum
4. Price inside Goldie Locks Zone Maximum
5. Confirmation 2 agrees
6. Volatility/Volume agrees
7. Confirmation 1 signal was less than 'Maximum Allowable PSBC Bars Back' prior
1-Candle Baseline Entry
1a. GKD-B Baseline gives signal
2a. Confirmation 1 agrees
3a. Price inside Goldie Locks Zone Minimum
4a. Price inside Goldie Locks Zone Maximum
5a. Confirmation 1 signal was less than 'Maximum Allowable PSBC Bars Back' prior
Next Candle
1b. Price retraced
2b. Baseline agrees
3b. Confirmation 1 agrees
4b. Confirmation 2 agrees
5b. Volatility/Volume agrees
Volatility/Volume Entry
1. GKD-V Volatility/Volume gives signal
2. Confirmation 1 agrees
3. Price inside Goldie Locks Zone Minimum
4. Price inside Goldie Locks Zone Maximum
5. Confirmation 2 agrees
6. Baseline agrees
7. Confirmation 1 signal was less than 7 candles prior
1-Candle Volatility/Volume Entry
1a. GKD-V Volatility/Volume gives signal
2a. Confirmation 1 agrees
3a. Price inside Goldie Locks Zone Minimum
4a. Price inside Goldie Locks Zone Maximum
5a. Confirmation 1 signal was less than 'Maximum Allowable PSVVC Bars Back' prior
Next Candle
1b. Price retraced
2b. Volatility/Volume agrees
3b. Confirmation 1 agrees
4b. Confirmation 2 agrees
5b. Baseline agrees
Confirmation 2 Entry
1. GKD-C Confirmation 2 gives signal
2. Confirmation 1 agrees
3. Price inside Goldie Locks Zone Minimum
4. Price inside Goldie Locks Zone Maximum
5. Volatility/Volume agrees
6. Baseline agrees
7. Confirmation 1 signal was less than 7 candles prior
1-Candle Confirmation 2 Entry
1a. GKD-C Confirmation 2 gives signal
2a. Confirmation 1 agrees
3a. Price inside Goldie Locks Zone Minimum
4a. Price inside Goldie Locks Zone Maximum
5a. Confirmation 1 signal was less than 'Maximum Allowable PSC2C Bars Back' prior
Next Candle
1b. Price retraced
2b. Confirmation 2 agrees
3b. Confirmation 1 agrees
4b. Volatility/Volume agrees
5b. Baseline agrees
PullBack Entry
1a. GKD-B Baseline gives signal
2a. Confirmation 1 agrees
3a. Price is beyond 1.0x Volatility of Baseline
Next Candle
1b. Price inside Goldie Locks Zone Minimum
2b. Price inside Goldie Locks Zone Maximum
3b. Confirmation 1 agrees
4b. Confirmation 2 agrees
5b. Volatility/Volume agrees
Continuation Entry
1. Standard Entry, 1-Candle Standard Entry, Baseline Entry, 1-Candle Baseline Entry, Volatility/Volume Entry, 1-Candle Volatility/Volume Entry, Confirmation 2 Entry, 1-Candle Confirmation 2 Entry, or Pullback entry triggered previously
2. Baseline hasn't crossed since entry signal trigger
4. Confirmation 1 agrees
5. Baseline agrees
6. Confirmation 2 agrees
Composite Momentum IndicatorComposite Momentum Indicator" combines the signals from several oscillators, including Stochastic, RSI, Ultimate Oscillator, and Commodity Channel Index (CCI) by averaging the standardized values (Z-Scores). Since it is a Z-Score based indicators the values will be typically be bound between +3 and -3 oscillating around 0. Here's a summary of the code:
Input Parameters: Users can customize the look-back period and set threshold values for overbought and oversold conditions. They can also choose which oscillators to include in the composite calculation.
Oscillator Calculations: The code calculates four separate oscillators - Stochastic, RSI, Ultimate Oscillator, and CCI - each measuring different aspects of market momentum.
Z-Scores Calculation: For each oscillator, the code calculates a Z-Score, which normalizes the oscillator's values based on its historical standard deviation and mean. This allows for a consistent comparison of oscillator values across different timeframes.
Composite Z-Score: The code aggregates the Z-Scores from the selected oscillators, taking into account user preferences (whether to include each oscillator). It then calculates an average Z-Score to create the "Composite Momentum Oscillator."
Conditional Color Coding: The composite oscillator is color-coded based on its average Z-Score value. It turns green when it's above the overbought threshold, red when it's below the oversold threshold, and blue when it's within the specified range.
Horizontal Lines: The code plots horizontal lines at key levels, including 0, ±3, ±2, and ±1, to help users identify important momentum levels.
Gradient Fills: It adds gradient fills above the overbought threshold and below the oversold threshold to visually highlight extreme momentum conditions.
Combining the Stochastic, RSI, Ultimate Oscillator, and Commodity Channel Index (CCI) into one composite indicator offers several advantages for traders and technical analysts:
Comprehensive Insight: Each of these oscillators measures different aspects of market momentum and price action. Combining them into one indicator provides a more comprehensive view of the market's behavior, as it takes into account various dimensions of momentum simultaneously.
Reduced Noise: Standalone oscillators can generate conflicting signals and produce noisy readings, especially during choppy market conditions. A composite indicator smoothes out these discrepancies by averaging the signals from multiple indicators, potentially reducing false signals.
Confirmation and Divergence: By combining multiple oscillators, traders can seek confirmation or divergence signals. When multiple oscillators align in the same direction, it can strengthen a trading signal. Conversely, divergence between the oscillators can warn of potential reversals or weakening trends.
Customization: Traders can tailor the composite indicator to their specific trading strategies and preferences. They have the flexibility to include or exclude specific oscillators, adjust look-back periods, and set threshold levels. This adaptability allows for a more personalized approach to technical analysis.
Clarity and Efficiency: Rather than cluttering the chart with multiple individual oscillators, a composite indicator condenses the information into a single plot. This enhances the clarity of the chart and makes it easier for traders to quickly interpret market conditions.
Overbought/Oversold Identification: Combining these oscillators can improve the identification of overbought and oversold conditions. It reduces the likelihood of false signals since multiple indicators must align to trigger these extreme conditions.
Educational Tool: For novice traders and analysts, a composite indicator can serve as an educational tool by demonstrating how different oscillators interact and influence each other's signals. It allows users to learn about multiple technical indicators in one glance.
Efficient Use of Screen Space: A single composite indicator occupies less screen space compared to multiple separate indicators. This is especially beneficial when analyzing multiple markets or timeframes simultaneously.
Holistic Approach: Instead of relying on a single indicator, a composite approach encourages a more holistic assessment of market conditions. Traders can consider a broader range of factors before making trading decisions.
Increased Confidence: A composite indicator can boost traders' confidence in their decisions. When multiple reliable indicators align, it can provide a stronger basis for taking action in the market.
In summary, combining the Stochastic, RSI, Ultimate Oscillator, and CCI into one composite indicator enhances the depth and reliability of technical analysis. It simplifies the decision-making process, reduces noise, and offers a more complete picture of market momentum, ultimately helping traders make more informed and well-rounded trading decisions.
* Feel free to compare against individual oscillatiors*

Reversion Zone IndexThe Reversion Zone Index (RZI) is an indicator that combines the Commodity Channel Index (CCI), Choppiness Index (CI), and Bollinger Bands Percentage (BBPct) to identify mean reversion signals in the market. It is plotted as an Exponential Moving Average (EMA) smoothed oscillator with overbought and oversold zones, and mean reversion signals are represented by red and green arrows.
The three indicators are combined to benefit from their complementary aspects and create a more comprehensive view of mean reversion conditions. Here's a brief overview of each indicator's benefits:
1. Commodity Channel Index (CCI): CCI measures the current price level relative to its average over a specified period. It helps identify overbought and oversold conditions, as well as potential trend retracements. By incorporating CCI, the RZI gains insights into momentum and potential turning points.
2. Choppiness Index (CI): CI quantifies the market's choppiness or trendiness by analyzing the range between the highest high and lowest low over a specific period. It indicates whether the market is in a trending or ranging phase. CI provides valuable information about the market state, which can be useful in mean reversion analysis.
3. Bollinger Bands Percentage (BBPct): BBPct measures the current price's position relative to the Bollinger Bands. It calculates the percentage difference between the current price and the bands, identifying potential overbought or oversold conditions. BBPct helps gauge the market's deviation from its typical behavior and highlights potential reversal opportunities.
The RZI combines the three indicators by taking an average of their values and applying further calculations. It smooths the combined oscillator using an EMA to reduce noise and enhance the visibility of the trends. Smoothing with EMA provides a more responsive representation of the overall trend and helps filter out short-term fluctuations.
The overbought and oversold zones are marked on the chart as reference levels. When the combined oscillator is above the overbought zone or below the oversold zone, it suggests a potential mean reversion signal. Red and green arrows are displayed to visually indicate these mean retracement signals.
The RZI is a valuable tool for identifying mean reversion opportunities in the market. It incorporates multiple indicators, each providing unique insights into different aspects of mean reversion, such as momentum, volatility, and price positioning. Traders can use this indicator to spot potential turning points and time their trades accordingly.

GKD-C StableFX [Loxx]The Giga Kaleidoscope GKD-C StableFX is a confirmation module included in Loxx's "Giga Kaleidoscope Modularized Trading System."
█ GKD-C StableFX
StableFX is an indicator based on the Commodity Channel Index (CCI) that incorporates a lagged CCI calculation using the typical source price. It applies a smoothing algorithm to generate a signal. The lagged CCI calculations are weighted by the inputs C1, C2, and C3. The minimum and maximum values of the lagged CCI are calculated, and the sum of these values is then smoothed. This line is the green and red trigger line. This final smoothed value is then also lagged. This final output his the signal line in white
█ Giga Kaleidoscope Modularized Trading System
Core components of an NNFX algorithmic trading strategy
The NNFX algorithm is built on the principles of trend, momentum, and volatility. There are six core components in the NNFX trading algorithm:
1. Volatility - price volatility; e.g., Average True Range, True Range Double, Close-to-Close, etc.
2. Baseline - a moving average to identify price trend
3. Confirmation 1 - a technical indicator used to identify trends
4. Confirmation 2 - a technical indicator used to identify trends
5. Continuation - a technical indicator used to identify trends
6. Volatility/Volume - a technical indicator used to identify volatility/volume breakouts/breakdown
7. Exit - a technical indicator used to determine when a trend is exhausted
8. Metamorphosis - a technical indicator that produces a compound signal from the combination of other GKD indicators*
*(not part of the NNFX algorithm)
What is Volatility in the NNFX trading system?
In the NNFX (No Nonsense Forex) trading system, ATR (Average True Range) is typically used to measure the volatility of an asset. It is used as a part of the system to help determine the appropriate stop loss and take profit levels for a trade. ATR is calculated by taking the average of the true range values over a specified period.
True range is calculated as the maximum of the following values:
-Current high minus the current low
-Absolute value of the current high minus the previous close
-Absolute value of the current low minus the previous close
ATR is a dynamic indicator that changes with changes in volatility. As volatility increases, the value of ATR increases, and as volatility decreases, the value of ATR decreases. By using ATR in NNFX system, traders can adjust their stop loss and take profit levels according to the volatility of the asset being traded. This helps to ensure that the trade is given enough room to move, while also minimizing potential losses.
Other types of volatility include True Range Double (TRD), Close-to-Close, and Garman-Klass
What is a Baseline indicator?
The baseline is essentially a moving average, and is used to determine the overall direction of the market.
The baseline in the NNFX system is used to filter out trades that are not in line with the long-term trend of the market. The baseline is plotted on the chart along with other indicators, such as the Moving Average (MA), the Relative Strength Index (RSI), and the Average True Range (ATR).
Trades are only taken when the price is in the same direction as the baseline. For example, if the baseline is sloping upwards, only long trades are taken, and if the baseline is sloping downwards, only short trades are taken. This approach helps to ensure that trades are in line with the overall trend of the market, and reduces the risk of entering trades that are likely to fail.
By using a baseline in the NNFX system, traders can have a clear reference point for determining the overall trend of the market, and can make more informed trading decisions. The baseline helps to filter out noise and false signals, and ensures that trades are taken in the direction of the long-term trend.
What is a Confirmation indicator?
Confirmation indicators are technical indicators that are used to confirm the signals generated by primary indicators. Primary indicators are the core indicators used in the NNFX system, such as the Average True Range (ATR), the Moving Average (MA), and the Relative Strength Index (RSI).
The purpose of the confirmation indicators is to reduce false signals and improve the accuracy of the trading system. They are designed to confirm the signals generated by the primary indicators by providing additional information about the strength and direction of the trend.
Some examples of confirmation indicators that may be used in the NNFX system include the Bollinger Bands, the MACD (Moving Average Convergence Divergence), and the MACD Oscillator. These indicators can provide information about the volatility, momentum, and trend strength of the market, and can be used to confirm the signals generated by the primary indicators.
In the NNFX system, confirmation indicators are used in combination with primary indicators and other filters to create a trading system that is robust and reliable. By using multiple indicators to confirm trading signals, the system aims to reduce the risk of false signals and improve the overall profitability of the trades.
What is a Continuation indicator?
In the NNFX (No Nonsense Forex) trading system, a continuation indicator is a technical indicator that is used to confirm a current trend and predict that the trend is likely to continue in the same direction. A continuation indicator is typically used in conjunction with other indicators in the system, such as a baseline indicator, to provide a comprehensive trading strategy.
What is a Volatility/Volume indicator?
Volume indicators, such as the On Balance Volume (OBV), the Chaikin Money Flow (CMF), or the Volume Price Trend (VPT), are used to measure the amount of buying and selling activity in a market. They are based on the trading volume of the market, and can provide information about the strength of the trend. In the NNFX system, volume indicators are used to confirm trading signals generated by the Moving Average and the Relative Strength Index. Volatility indicators include Average Direction Index, Waddah Attar, and Volatility Ratio. In the NNFX trading system, volatility is a proxy for volume and vice versa.
By using volume indicators as confirmation tools, the NNFX trading system aims to reduce the risk of false signals and improve the overall profitability of trades. These indicators can provide additional information about the market that is not captured by the primary indicators, and can help traders to make more informed trading decisions. In addition, volume indicators can be used to identify potential changes in market trends and to confirm the strength of price movements.
What is an Exit indicator?
The exit indicator is used in conjunction with other indicators in the system, such as the Moving Average (MA), the Relative Strength Index (RSI), and the Average True Range (ATR), to provide a comprehensive trading strategy.
The exit indicator in the NNFX system can be any technical indicator that is deemed effective at identifying optimal exit points. Examples of exit indicators that are commonly used include the Parabolic SAR, the Average Directional Index (ADX), and the Chandelier Exit.
The purpose of the exit indicator is to identify when a trend is likely to reverse or when the market conditions have changed, signaling the need to exit a trade. By using an exit indicator, traders can manage their risk and prevent significant losses.
In the NNFX system, the exit indicator is used in conjunction with a stop loss and a take profit order to maximize profits and minimize losses. The stop loss order is used to limit the amount of loss that can be incurred if the trade goes against the trader, while the take profit order is used to lock in profits when the trade is moving in the trader's favor.
Overall, the use of an exit indicator in the NNFX trading system is an important component of a comprehensive trading strategy. It allows traders to manage their risk effectively and improve the profitability of their trades by exiting at the right time.
What is an Metamorphosis indicator?
The concept of a metamorphosis indicator involves the integration of two or more GKD indicators to generate a compound signal. This is achieved by evaluating the accuracy of each indicator and selecting the signal from the indicator with the highest accuracy. As an illustration, let's consider a scenario where we calculate the accuracy of 10 indicators and choose the signal from the indicator that demonstrates the highest accuracy.
The resulting output from the metamorphosis indicator can then be utilized in a GKD-BT backtest by occupying a slot that aligns with the purpose of the metamorphosis indicator. The slot can be a GKD-B, GKD-C, or GKD-E slot, depending on the specific requirements and objectives of the indicator. This allows for seamless integration and utilization of the compound signal within the GKD-BT framework.
How does Loxx's GKD (Giga Kaleidoscope Modularized Trading System) implement the NNFX algorithm outlined above?
Loxx's GKD v2.0 system has five types of modules (indicators/strategies). These modules are:
1. GKD-BT - Backtesting module (Volatility, Number 1 in the NNFX algorithm)
2. GKD-B - Baseline module (Baseline and Volatility/Volume, Numbers 1 and 2 in the NNFX algorithm)
3. GKD-C - Confirmation 1/2 and Continuation module (Confirmation 1/2 and Continuation, Numbers 3, 4, and 5 in the NNFX algorithm)
4. GKD-V - Volatility/Volume module (Confirmation 1/2, Number 6 in the NNFX algorithm)
5. GKD-E - Exit module (Exit, Number 7 in the NNFX algorithm)
6. GKD-M - Metamorphosis module (Metamorphosis, Number 8 in the NNFX algorithm, but not part of the NNFX algorithm)
(additional module types will added in future releases)
Each module interacts with every module by passing data to A backtest module wherein the various components of the GKD system are combined to create a trading signal.
That is, the Baseline indicator passes its data to Volatility/Volume. The Volatility/Volume indicator passes its values to the Confirmation 1 indicator. The Confirmation 1 indicator passes its values to the Confirmation 2 indicator. The Confirmation 2 indicator passes its values to the Continuation indicator. The Continuation indicator passes its values to the Exit indicator, and finally, the Exit indicator passes its values to the Backtest strategy.
This chaining of indicators requires that each module conform to Loxx's GKD protocol, therefore allowing for the testing of every possible combination of technical indicators that make up the six components of the NNFX algorithm.
What does the application of the GKD trading system look like?
Example trading system:
Backtest: Multi-Ticker CC Backtest
Baseline: Hull Moving Average
Volatility/Volume: Hurst Exponent
Confirmation 1: StableFX as shown on the chart above
Confirmation 2: uf2018
Continuation: Coppock Curve
Exit: Rex Oscillator
Metamorphosis: Baseline Optimizer
Each GKD indicator is denoted with a module identifier of either: GKD-BT, GKD-B, GKD-C, GKD-V, GKD-M, or GKD-E. This allows traders to understand to which module each indicator belongs and where each indicator fits into the GKD system.
█ Giga Kaleidoscope Modularized Trading System Signals
Standard Entry
1. GKD-C Confirmation gives signal
2. Baseline agrees
3. Price inside Goldie Locks Zone Minimum
4. Price inside Goldie Locks Zone Maximum
5. Confirmation 2 agrees
6. Volatility/Volume agrees
1-Candle Standard Entry
1a. GKD-C Confirmation gives signal
2a. Baseline agrees
3a. Price inside Goldie Locks Zone Minimum
4a. Price inside Goldie Locks Zone Maximum
Next Candle
1b. Price retraced
2b. Baseline agrees
3b. Confirmation 1 agrees
4b. Confirmation 2 agrees
5b. Volatility/Volume agrees
Baseline Entry
1. GKD-B Baseline gives signal
2. Confirmation 1 agrees
3. Price inside Goldie Locks Zone Minimum
4. Price inside Goldie Locks Zone Maximum
5. Confirmation 2 agrees
6. Volatility/Volume agrees
7. Confirmation 1 signal was less than 'Maximum Allowable PSBC Bars Back' prior
1-Candle Baseline Entry
1a. GKD-B Baseline gives signal
2a. Confirmation 1 agrees
3a. Price inside Goldie Locks Zone Minimum
4a. Price inside Goldie Locks Zone Maximum
5a. Confirmation 1 signal was less than 'Maximum Allowable PSBC Bars Back' prior
Next Candle
1b. Price retraced
2b. Baseline agrees
3b. Confirmation 1 agrees
4b. Confirmation 2 agrees
5b. Volatility/Volume agrees
Volatility/Volume Entry
1. GKD-V Volatility/Volume gives signal
2. Confirmation 1 agrees
3. Price inside Goldie Locks Zone Minimum
4. Price inside Goldie Locks Zone Maximum
5. Confirmation 2 agrees
6. Baseline agrees
7. Confirmation 1 signal was less than 7 candles prior
1-Candle Volatility/Volume Entry
1a. GKD-V Volatility/Volume gives signal
2a. Confirmation 1 agrees
3a. Price inside Goldie Locks Zone Minimum
4a. Price inside Goldie Locks Zone Maximum
5a. Confirmation 1 signal was less than 'Maximum Allowable PSVVC Bars Back' prior
Next Candle
1b. Price retraced
2b. Volatility/Volume agrees
3b. Confirmation 1 agrees
4b. Confirmation 2 agrees
5b. Baseline agrees
Confirmation 2 Entry
1. GKD-C Confirmation 2 gives signal
2. Confirmation 1 agrees
3. Price inside Goldie Locks Zone Minimum
4. Price inside Goldie Locks Zone Maximum
5. Volatility/Volume agrees
6. Baseline agrees
7. Confirmation 1 signal was less than 7 candles prior
1-Candle Confirmation 2 Entry
1a. GKD-C Confirmation 2 gives signal
2a. Confirmation 1 agrees
3a. Price inside Goldie Locks Zone Minimum
4a. Price inside Goldie Locks Zone Maximum
5a. Confirmation 1 signal was less than 'Maximum Allowable PSC2C Bars Back' prior
Next Candle
1b. Price retraced
2b. Confirmation 2 agrees
3b. Confirmation 1 agrees
4b. Volatility/Volume agrees
5b. Baseline agrees
PullBack Entry
1a. GKD-B Baseline gives signal
2a. Confirmation 1 agrees
3a. Price is beyond 1.0x Volatility of Baseline
Next Candle
1b. Price inside Goldie Locks Zone Minimum
2b. Price inside Goldie Locks Zone Maximum
3b. Confirmation 1 agrees
4b. Confirmation 2 agrees
5b. Volatility/Volume agrees
Continuation Entry
1. Standard Entry, 1-Candle Standard Entry, Baseline Entry, 1-Candle Baseline Entry, Volatility/Volume Entry, 1-Candle Volatility/Volume Entry, Confirmation 2 Entry, 1-Candle Confirmation 2 Entry, or Pullback entry triggered previously
2. Baseline hasn't crossed since entry signal trigger
4. Confirmation 1 agrees
5. Baseline agrees
6. Confirmation 2 agrees

GKD-C Digital Kahler Stochastic [Loxx]Giga Kaleidoscope GKD-C Digital Kahler Stochastic is a Confirmation module included in Loxx's "Giga Kaleidoscope Modularized Trading System".
█ Giga Kaleidoscope Modularized Trading System
What is Loxx's "Giga Kaleidoscope Modularized Trading System"?
The Giga Kaleidoscope Modularized Trading System is a trading system built on the philosophy of the NNFX (No Nonsense Forex) algorithmic trading.
What is the NNFX algorithmic trading strategy?
The NNFX (No-Nonsense Forex) trading system is a comprehensive approach to Forex trading that is designed to simplify the process and remove the confusion and complexity that often surrounds trading. The system was developed by a Forex trader who goes by the pseudonym "VP" and has gained a significant following in the Forex community.
The NNFX trading system is based on a set of rules and guidelines that help traders make objective and informed decisions. These rules cover all aspects of trading, including market analysis, trade entry, stop loss placement, and trade management.
Here are the main components of the NNFX trading system:
1. Trading Philosophy: The NNFX trading system is based on the idea that successful trading requires a comprehensive understanding of the market, objective analysis, and strict risk management. The system aims to remove subjective elements from trading and focuses on objective rules and guidelines.
2. Technical Analysis: The NNFX trading system relies heavily on technical analysis and uses a range of indicators to identify high-probability trading opportunities. The system uses a combination of trend-following and mean-reverting strategies to identify trades.
3. Market Structure: The NNFX trading system emphasizes the importance of understanding the market structure, including price action, support and resistance levels, and market cycles. The system uses a range of tools to identify the market structure, including trend lines, channels, and moving averages.
4. Trade Entry: The NNFX trading system has strict rules for trade entry. The system uses a combination of technical indicators to identify high-probability trades, and traders must meet specific criteria to enter a trade.
5. Stop Loss Placement: The NNFX trading system places a significant emphasis on risk management and requires traders to place a stop loss order on every trade. The system uses a combination of technical analysis and market structure to determine the appropriate stop loss level.
6. Trade Management: The NNFX trading system has specific rules for managing open trades. The system aims to minimize risk and maximize profit by using a combination of trailing stops, take profit levels, and position sizing.
Overall, the NNFX trading system is designed to be a straightforward and easy-to-follow approach to Forex trading that can be applied by traders of all skill levels.
Core components of an NNFX algorithmic trading strategy
The NNFX algorithm is built on the principles of trend, momentum, and volatility. There are six core components in the NNFX trading algorithm:
1. Volatility - price volatility; e.g., Average True Range, True Range Double, Close-to-Close, etc.
2. Baseline - a moving average to identify price trend
3. Confirmation 1 - a technical indicator used to identify trends
4. Confirmation 2 - a technical indicator used to identify trends
5. Continuation - a technical indicator used to identify trends
6. Volatility/Volume - a technical indicator used to identify volatility/volume breakouts/breakdown
7. Exit - a technical indicator used to determine when a trend is exhausted
What is Volatility in the NNFX trading system?
In the NNFX (No Nonsense Forex) trading system, ATR (Average True Range) is typically used to measure the volatility of an asset. It is used as a part of the system to help determine the appropriate stop loss and take profit levels for a trade. ATR is calculated by taking the average of the true range values over a specified period.
True range is calculated as the maximum of the following values:
-Current high minus the current low
-Absolute value of the current high minus the previous close
-Absolute value of the current low minus the previous close
ATR is a dynamic indicator that changes with changes in volatility. As volatility increases, the value of ATR increases, and as volatility decreases, the value of ATR decreases. By using ATR in NNFX system, traders can adjust their stop loss and take profit levels according to the volatility of the asset being traded. This helps to ensure that the trade is given enough room to move, while also minimizing potential losses.
Other types of volatility include True Range Double (TRD), Close-to-Close, and Garman-Klass
What is a Baseline indicator?
The baseline is essentially a moving average, and is used to determine the overall direction of the market.
The baseline in the NNFX system is used to filter out trades that are not in line with the long-term trend of the market. The baseline is plotted on the chart along with other indicators, such as the Moving Average (MA), the Relative Strength Index (RSI), and the Average True Range (ATR).
Trades are only taken when the price is in the same direction as the baseline. For example, if the baseline is sloping upwards, only long trades are taken, and if the baseline is sloping downwards, only short trades are taken. This approach helps to ensure that trades are in line with the overall trend of the market, and reduces the risk of entering trades that are likely to fail.
By using a baseline in the NNFX system, traders can have a clear reference point for determining the overall trend of the market, and can make more informed trading decisions. The baseline helps to filter out noise and false signals, and ensures that trades are taken in the direction of the long-term trend.
What is a Confirmation indicator?
Confirmation indicators are technical indicators that are used to confirm the signals generated by primary indicators. Primary indicators are the core indicators used in the NNFX system, such as the Average True Range (ATR), the Moving Average (MA), and the Relative Strength Index (RSI).
The purpose of the confirmation indicators is to reduce false signals and improve the accuracy of the trading system. They are designed to confirm the signals generated by the primary indicators by providing additional information about the strength and direction of the trend.
Some examples of confirmation indicators that may be used in the NNFX system include the Bollinger Bands, the MACD (Moving Average Convergence Divergence), and the Stochastic Oscillator. These indicators can provide information about the volatility, momentum, and trend strength of the market, and can be used to confirm the signals generated by the primary indicators.
In the NNFX system, confirmation indicators are used in combination with primary indicators and other filters to create a trading system that is robust and reliable. By using multiple indicators to confirm trading signals, the system aims to reduce the risk of false signals and improve the overall profitability of the trades.
What is a Continuation indicator?
In the NNFX (No Nonsense Forex) trading system, a continuation indicator is a technical indicator that is used to confirm a current trend and predict that the trend is likely to continue in the same direction. A continuation indicator is typically used in conjunction with other indicators in the system, such as a baseline indicator, to provide a comprehensive trading strategy.
What is a Volatility/Volume indicator?
Volume indicators, such as the On Balance Volume (OBV), the Chaikin Money Flow (CMF), or the Volume Price Trend (VPT), are used to measure the amount of buying and selling activity in a market. They are based on the trading volume of the market, and can provide information about the strength of the trend. In the NNFX system, volume indicators are used to confirm trading signals generated by the Moving Average and the Relative Strength Index. Volatility indicators include Average Direction Index, Waddah Attar, and Volatility Ratio. In the NNFX trading system, volatility is a proxy for volume and vice versa.
By using volume indicators as confirmation tools, the NNFX trading system aims to reduce the risk of false signals and improve the overall profitability of trades. These indicators can provide additional information about the market that is not captured by the primary indicators, and can help traders to make more informed trading decisions. In addition, volume indicators can be used to identify potential changes in market trends and to confirm the strength of price movements.
What is an Exit indicator?
The exit indicator is used in conjunction with other indicators in the system, such as the Moving Average (MA), the Relative Strength Index (RSI), and the Average True Range (ATR), to provide a comprehensive trading strategy.
The exit indicator in the NNFX system can be any technical indicator that is deemed effective at identifying optimal exit points. Examples of exit indicators that are commonly used include the Parabolic SAR, the Average Directional Index (ADX), and the Chandelier Exit.
The purpose of the exit indicator is to identify when a trend is likely to reverse or when the market conditions have changed, signaling the need to exit a trade. By using an exit indicator, traders can manage their risk and prevent significant losses.
In the NNFX system, the exit indicator is used in conjunction with a stop loss and a take profit order to maximize profits and minimize losses. The stop loss order is used to limit the amount of loss that can be incurred if the trade goes against the trader, while the take profit order is used to lock in profits when the trade is moving in the trader's favor.
Overall, the use of an exit indicator in the NNFX trading system is an important component of a comprehensive trading strategy. It allows traders to manage their risk effectively and improve the profitability of their trades by exiting at the right time.
How does Loxx's GKD (Giga Kaleidoscope Modularized Trading System) implement the NNFX algorithm outlined above?
Loxx's GKD v1.0 system has five types of modules (indicators/strategies). These modules are:
1. GKD-BT - Backtesting module (Volatility, Number 1 in the NNFX algorithm)
2. GKD-B - Baseline module (Baseline and Volatility/Volume, Numbers 1 and 2 in the NNFX algorithm)
3. GKD-C - Confirmation 1/2 and Continuation module (Confirmation 1/2 and Continuation, Numbers 3, 4, and 5 in the NNFX algorithm)
4. GKD-V - Volatility/Volume module (Confirmation 1/2, Number 6 in the NNFX algorithm)
5. GKD-E - Exit module (Exit, Number 7 in the NNFX algorithm)
(additional module types will added in future releases)
Each module interacts with every module by passing data between modules. Data is passed between each module as described below:
GKD-B => GKD-V => GKD-C(1) => GKD-C(2) => GKD-C(Continuation) => GKD-E => GKD-BT
That is, the Baseline indicator passes its data to Volatility/Volume. The Volatility/Volume indicator passes its values to the Confirmation 1 indicator. The Confirmation 1 indicator passes its values to the Confirmation 2 indicator. The Confirmation 2 indicator passes its values to the Continuation indicator. The Continuation indicator passes its values to the Exit indicator, and finally, the Exit indicator passes its values to the Backtest strategy.
This chaining of indicators requires that each module conform to Loxx's GKD protocol, therefore allowing for the testing of every possible combination of technical indicators that make up the six components of the NNFX algorithm.
What does the application of the GKD trading system look like?
Example trading system:
Backtest: Strategy with 1-3 take profits, trailing stop loss, multiple types of PnL volatility, and 2 backtesting styles
Baseline: Hull Moving Average
Volatility/Volume: Hurst Exponent
Confirmation 1: Digital Kahler Stochastic as shown on the chart above
Confirmation 2: Williams Percent Range
Continuation: Fisher Transform
Exit: Rex Oscillator
Each GKD indicator is denoted with a module identifier of either: GKD-BT, GKD-B, GKD-C, GKD-V, or GKD-E. This allows traders to understand to which module each indicator belongs and where each indicator fits into the GKD protocol chain.
Giga Kaleidoscope Modularized Trading System Signals (based on the NNFX algorithm)
Standard Entry
1. GKD-C Confirmation 1 Signal
2. GKD-B Baseline agrees
3. Price is within a range of 0.2x Volatility and 1.0x Volatility of the Goldie Locks Mean
4. GKD-C Confirmation 2 agrees
5. GKD-V Volatility/Volume agrees
Baseline Entry
1. GKD-B Baseline signal
2. GKD-C Confirmation 1 agrees
3. Price is within a range of 0.2x Volatility and 1.0x Volatility of the Goldie Locks Mean
4. GKD-C Confirmation 2 agrees
5. GKD-V Volatility/Volume agrees
6. GKD-C Confirmation 1 signal was less than 7 candles prior
Continuation Entry
1. Standard Entry, Baseline Entry, or Pullback; entry triggered previously
2. GKD-B Baseline hasn't crossed since entry signal trigger
3. GKD-C Confirmation Continuation Indicator signals
4. GKD-C Confirmation 1 agrees
5. GKD-B Baseline agrees
6. GKD-C Confirmation 2 agrees
1-Candle Rule Standard Entry
1. GKD-C Confirmation 1 signal
2. GKD-B Baseline agrees
3. Price is within a range of 0.2x Volatility and 1.0x Volatility of the Goldie Locks Mean
Next Candle:
1. Price retraced (Long: close < close or Short: close > close )
2. GKD-B Baseline agrees
3. GKD-C Confirmation 1 agrees
4. GKD-C Confirmation 2 agrees
5. GKD-V Volatility/Volume agrees
1-Candle Rule Baseline Entry
1. GKD-B Baseline signal
2. GKD-C Confirmation 1 agrees
3. Price is within a range of 0.2x Volatility and 1.0x Volatility of the Goldie Locks Mean
4. GKD-C Confirmation 1 signal was less than 7 candles prior
Next Candle:
1. Price retraced (Long: close < close or Short: close > close )
2. GKD-B Baseline agrees
3. GKD-C Confirmation 1 agrees
4. GKD-C Confirmation 2 agrees
5. GKD-V Volatility/Volume Agrees
PullBack Entry
1. GKD-B Baseline signal
2. GKD-C Confirmation 1 agrees
3. Price is beyond 1.0x Volatility of Baseline
Next Candle:
1. Price is within a range of 0.2x Volatility and 1.0x Volatility of the Goldie Locks Mean
3. GKD-C Confirmation 1 agrees
4. GKD-C Confirmation 2 agrees
5. GKD-V Volatility/Volume Agrees
█ GKD-C Digital Kahler Stochastic
What is Digital Kahler?
From Philipp Kahler's article for www.traders-mag.com, August 2008. "A Classic Indicator in a New Suit: Digital Stochastic"
Digital Indicators
Whenever you study the development of trading systems in particular, you will be struck in an extremely unpleasant way by the seemingly unmotivated indentations and changes in direction of each indicator. An experienced trader can recognise many false signals of the indicator on the basis of his solid background; a stupid trading system usually falls into any trap offered by the unclear indicator course. This is what motivated me to improve even further this and other indicators with the help of a relatively simple procedure. The goal of this development is to be able to use this indicator in a trading system with as few additional conditions as possible. Discretionary traders will likewise be happy about this clear course, which is not nerve-racking and makes concentrating on the essential elements of trading possible.
How Is It Done?
The digital stochastic is a child of the original indicator. We owe a debt of gratitude to George Lane for his idea to design an indicator which describes the position of the current price within the high-low range of the historical price movement. My contribution to this indicator is the changed pattern which improves the quality of the signal without generating too long delays in giving signals. The trick used to generate this “digital” behavior of the indicator. It can be used with most oscillators like RSI or CCI .
First of all, the original is looked at. The indicator always moves between 0 and 100. The precise position of the indicator or its course relative to the trigger line are of no interest to me, I would just like to know whether the indicator is quoted below or above the value 50. This is tantamount to the question of whether the market is just trading above or below the middle of the high-low range of the past few days. If the market trades in the upper half of its high-low range, then the digital stochastic is given the value 1; if the original stochastic is below 50, then the value –1 is given. This leads to a sequence of 1/-1 values – the digital core of the new indicator. These values are subsequently smoothed by means of a short exponential moving average . This way minor false signals are eliminated and the indicator is given its typical form.
Calculation
The calculation is simple
Step1: create the CCI
Step 2: Use CCI as Fast MA and smoothed CCI as Slow MA
Step 3: Multiple the Slow and Fast MAs by their respective input ratios, and then divide by their sum. if the result is greater than 0, then the result is 1, if it's less than 0 then the result is -1, then chart the data
if ((slowr * slow_k + fastr * fast_k) / (fastr + slowr) > 50.0)
temp := 1
if ((slowr * slow_k + fastr * fast_k) / (fastr + slowr) < 50.0)
temp := -1
Step 4: Profit
Requirements
Inputs
Confirmation 1 and Solo Confirmation: GKD-V Volatility / Volume indicator
Confirmation 2: GKD-C Confirmation indicator
Outputs
Confirmation 2 and Solo Confirmation Complex: GKD-E Exit indicator
Confirmation 1: GKD-C Confirmation indicator
Continuation: GKD-E Exit indicator
Solo Confirmation Simple: GKD-BT Backtest strategy
Additional features will be added in future releases.
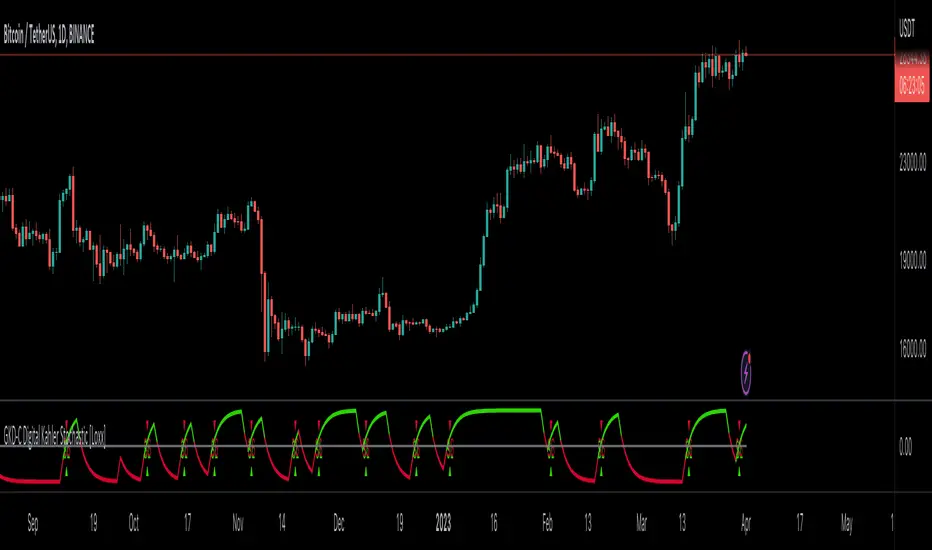
Direction Analysis WavesDescription
It is an indicator that aims to provide information about the direction of the trend, the basis of which is the CCI, CMO and MFI indices.
Symbols on the indicator are for informational purposes. Information about colors and symbols is given below.
Blue Wave: Graphical representation of the Commodity Channel Index (CCI) curve.
Green/Red Wave: Graphical representation of the Chande Momentum Oscillator (CMO) curve. This curve turns green when it rises above zero, and turns red when it falls below zero.
Yellow Wave: Graphical representation of the Money Flow Index (MFI) curve.
Blue Line: CCI line.
Green/Red Cross: CCI line shows green cross on red cross below 0 value.
Warning
As a result, this indicator should be expected to give an idea of the trend direction, not a trading signal.
Version
v1.0
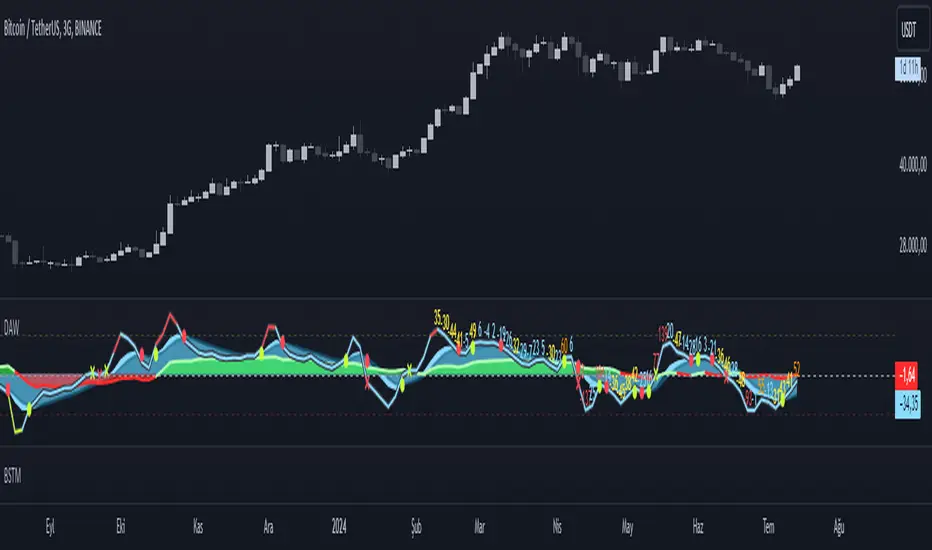
ZCrypto 3commas - All in oneIntroducing the "3commas All Built-in Indicators in One Script" for TradingView!
Tired of wondering which 3commas-built-in indicators to use and how to combine them? This script is here to make your life easier by answering this question for you.
Instead of spending hours paper trading on 3commas and hoping for the best combined indicator signals, save time and find more accurate results on TradingView.
This indicator combines any of the 3commas-built-in indicators into one signal, allowing you to verify which indicators work best together.
You can combine two or more indicators, up to a maximum of 17, and backtest your combined signal with the Zendog integration - it's simple and easy!
The script includes the following indicators:
• TV Technical Rating x 3
• RSI x 3
• ULT x 1
• BB x 3
• MACD x 2
• MFI x 1
• CCI x 1
• PSAR x 1
• BTC, DXY Filter x 1
• QFL
• Zendog integration
The indicator fires two types of signals: entry signals and exit signals.
To fire entry signals, the script uses the following conditions:
• TV Technical Rating: If the rating is "Buy" or "Strong Buy”, then the signal is fired.
• RSI: If the RSI value is below the RSI threshold, then the signal is fired.
• ULT: If the Ultimate Oscillator value is below the ULT threshold, then the signal is fired.
• BB: If the candle is closed below the channel (lower band), then the signal is fired.
• MACD: If the value of the MACD line is < 0 and the MACD line crosses the Signal line from bottom to top, then the signal is fired.
• MFI: If the candle is closed and its value crosses the MFI threshold from bottom to top, then the signal is fired.
• CCI: If the CCI Value crosses the CCI threshold, then the signal is fired.
• PSAR: If the current price is above the Parabolic SAR, then the signal is fired.
• QFL: If the QFL base (support level) is cracked and the price is <= the crack % of drop, then the signal is fired.
• BTC, DXY Filter: If the current price is higher than the SMA length of Bitcoin (BTC) and the US Dollar Index (DXY) is below it, then the signal is fired.
To fire exit signals, the script uses the following conditions:
• TV Technical Rating: If the rating is "Sell" or "Strong Sell”, then the signal is fired.
• RSI: If the RSI value is above the RSI threshold, then the signal is fired.
• QFL SELL: If the QFL peak (resistance level) is cracked and the price is >= the crack % of pump, then the signal is fired.
to use it with Zendog Backtester here is how you could set it up
Say goodbye to the guessing game and save time with the "3commas All Built-in Indicators in One Script" on TradingView.

EventsLibrary "Events"
events()
Returns the list of dates supported by this library as a string array.
Returns: array : Names of events supported by this library
fomcMeetings()
Gets the FOMC Meeting Dates. The FOMC meets eight times a year to determine the course of monetary policy. The FOMC announces its decision on the federal funds rate at the conclusion of each meeting and also issues a statement that provides information on the economic outlook and the Committee's assessment of the risks to the outlook.
Returns: array : FOMC Meeting Dates as timestamps
fomcMinutes()
Gets the FOMC Meeting Minutes Dates. The FOMC Minutes are released three weeks after each FOMC meeting. The Minutes provide information on the Committee's deliberations and decisions at the meeting.
Returns: array : FOMC Meeting Minutes Dates as timestamps
ppiReleases()
Gets the Producer Price Index (PPI) Dates. The Producer Price Index (PPI) measures the average change over time in the selling prices received by domestic producers for their output. The PPI is a leading indicator of CPI, and CPI is a leading indicator of inflation.
Returns: array : PPI Dates as timestamps
cpiReleases()
Gets the Consumer Price Index (CPI) Rekease Dates. The Consumer Price Index (CPI) measures changes in the price level of a market basket of consumer goods and services purchased by households. The CPI is a leading indicator of inflation.
Returns: array : CPI Dates as timestamps
csiReleases()
Gets the CSI release dates. The Consumer Sentiment Index (CSI) is a survey of consumer attitudes about the economy and their personal finances. The CSI is a leading indicator of consumer spending.
Returns: array : CSI Dates as timestamps
cciReleases()
Gets the CCI release dates. The Conference Board's Consumer Confidence Index (CCI) is a survey of consumer attitudes about the economy and their personal finances. The CCI is a leading indicator of consumer spending.
Returns: array : CCI Dates as timestamps
nfpReleases()
Gets the NFP release dates. Nonfarm payrolls is an employment report released monthly by the Bureau of Labor Statistics (BLS) that measures the change in the number of employed people in the United States.
Returns: array : NFP Dates as timestamps
eciReleases()
Gets the ECI The Employment Cost Index (ECI) is a measure of the change in the cost of labor,

SH_LibraryLibrary "SH_Library"
events()
Returns the list of dates supported by this library as a string array.
Returns: array : Names of events supported by this library
fomcMeetings()
Gets the FOMC Meeting Dates. The FOMC meets eight times a year to determine the course of monetary policy. The FOMC announces its decision on the federal funds rate at the conclusion of each meeting and also issues a statement that provides information on the economic outlook and the Committee's assessment of the risks to the outlook.
Returns: array : FOMC Meeting Dates as timestamps
fomcMinutes()
Gets the FOMC Meeting Minutes Dates. The FOMC Minutes are released three weeks after each FOMC meeting. The Minutes provide information on the Committee's deliberations and decisions at the meeting.
Returns: array : FOMC Meeting Minutes Dates as timestamps
ppiReleases()
Gets the Producer Price Index (PPI) Dates. The Producer Price Index (PPI) measures the average change over time in the selling prices received by domestic producers for their output. The PPI is a leading indicator of CPI, and CPI is a leading indicator of inflation.
Returns: array : PPI Dates as timestamps
cpiReleases()
Gets the Consumer Price Index (CPI) Rekease Dates. The Consumer Price Index (CPI) measures changes in the price level of a market basket of consumer goods and services purchased by households. The CPI is a leading indicator of inflation.
Returns: array : CPI Dates as timestamps
csiReleases()
Gets the CSI release dates. The Consumer Sentiment Index (CSI) is a survey of consumer attitudes about the economy and their personal finances. The CSI is a leading indicator of consumer spending.
Returns: array : CSI Dates as timestamps
cciReleases()
Gets the CCI release dates. The Conference Board's Consumer Confidence Index (CCI) is a survey of consumer attitudes about the economy and their personal finances. The CCI is a leading indicator of consumer spending.
Returns: array : CCI Dates as timestamps
nfpReleases()
Gets the NFP release dates. Nonfarm payrolls is an employment report released monthly by the Bureau of Labor Statistics (BLS) that measures the change in the number of employed people in the United States.
Returns: array : NFP Dates as timestamps
eciReleases()
Gets the ECI The Employment Cost Index (ECI) is a measure of the change in the cost of labor,

TASC 2022.12 Short-Term Continuation And Reversal Signals█ OVERVIEW
TASC's December 2022 edition Traders' Tips includes an article by Barbara Star titled "Short-Term Continuation And Reversal Signals". This is the code that implements the concepts presented in this publication.
█ CONCEPTS
The article takes two classic indicators, the Commodity Channel Index (CCI) and the Directional Movement Indicator (DMI), makes changes to the traditional ways of visualizing their readings, and uses them together to generate potential signals. The author first discusses the benefits of converting the DMI indicator to an oscillator format by subtracting the −DI from the +DI, which is then displayed as a histogram. Next, the author shows how the use of an on-chart visual framework (i.e., choosing the line style and color, coloring price bars, etc.) can help traders interpret the signals produced the considered pair of indicators.
█ CALCULATIONS
The article offers the following signals based on the readings of the DMI and CCI pair, suitable for several types of trades:
• Short-term trend change signals:
A DMI oscillator above zero indicates that prices are in an uptrend. A DMI oscillator below the zero line and falling means that selling pressure is dominating and price is trending down. The sign of the DMI oscillator is indicated by the color of the price bars (which correlates with the color of the DMI histogram). Namely, green, red and grey price bars correspond to the DMI oscillator above, below and equal to zero . Colored price bars and the DMI oscillator make it easy for trend traders to recognize changes in short-term trends.
• Trend continuation signals:
Blue circles appear near the bottom of the oscillator chart border when the DMI is above the zero line and the price is above its simple moving average in an uptrend . Dark red circles appear near the top of the chart in a downtrend when the DMI oscillator is below its zero line and below the 18-period moving average. Trend continuation signals are useful for those looking to add to existing positions, as well as for traders waiting for a pullback after a trend has started.
• Reversal signals:
The CCI signals a reversal to the downside when it breaks out of its +100 and then returns at some point, crossing below the +100 level. This is indicated by a magenta-colored diamond shape near the top the chart. The CCI signals a reversal to the upside when it moves below its −100 level and then at some point comes back to cross above the −100 level. This is indicated by a yellow diamond near the bottom of the chart. Reversal signals offer short-term rallies for countertrend traders as well as for swing traders looking for longer-term moves using the interplay between continuation and reversal signals.
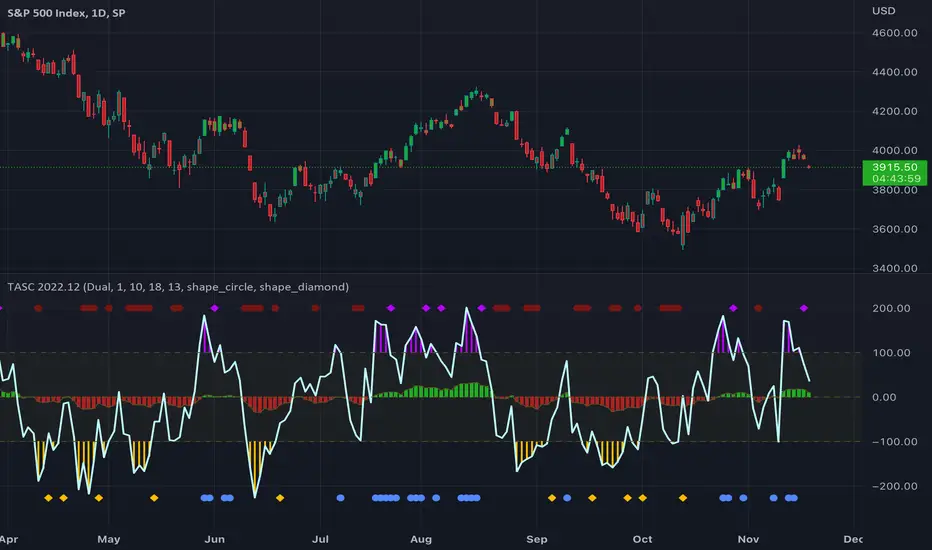
EconomicCalendarLibrary "EconomicCalendar"
This library is a data provider for important dates and times from the Economic Calendar.
events()
Returns the list of dates supported by this library as a string array.
Returns: array : Names of events supported by this library
fomcMeetings()
Gets the FOMC Meeting Dates. The FOMC meets eight times a year to determine the course of monetary policy. The FOMC announces its decision on the federal funds rate at the conclusion of each meeting and also issues a statement that provides information on the economic outlook and the Committee's assessment of the risks to the outlook.
Returns: array : FOMC Meeting Dates as timestamps
fomcMinutes()
Gets the FOMC Meeting Minutes Dates. The FOMC Minutes are released three weeks after each FOMC meeting. The Minutes provide information on the Committee's deliberations and decisions at the meeting.
Returns: array : FOMC Meeting Minutes Dates as timestamps
ppiReleases()
Gets the Producer Price Index (PPI) Dates. The Producer Price Index (PPI) measures the average change over time in the selling prices received by domestic producers for their output. The PPI is a leading indicator of CPI, and CPI is a leading indicator of inflation.
Returns: array : PPI Dates as timestamps
cpiReleases()
Gets the Consumer Price Index (CPI) Rekease Dates. The Consumer Price Index (CPI) measures changes in the price level of a market basket of consumer goods and services purchased by households. The CPI is a leading indicator of inflation.
Returns: array : CPI Dates as timestamps
csiReleases()
Gets the CSI release dates. The Consumer Sentiment Index (CSI) is a survey of consumer attitudes about the economy and their personal finances. The CSI is a leading indicator of consumer spending.
Returns: array : CSI Dates as timestamps
cciReleases()
Gets the CCI release dates. The Conference Board's Consumer Confidence Index (CCI) is a survey of consumer attitudes about the economy and their personal finances. The CCI is a leading indicator of consumer spending.
Returns: array : CCI Dates as timestamps
nfpReleases()
Gets the NFP release dates. Nonfarm payrolls is an employment report released monthly by the Bureau of Labor Statistics (BLS) that measures the change in the number of employed people in the United States.
Returns: array : NFP Dates as timestamps

High-Low CandleSimplified trading with only High Low candles. It uses CCI for trade selection and filtering. Use it either in normal candle mode or better in Heikin Ashi mode. Recommend using standard Stochastics and CCI 20 indicators to learn usage and behaviors.
Trading rules and color legend:
Teal (Green): Long
Red: Short
Grey/Silver: No trade zone, Indecisive candle
Yellow: Potential trend change (Outside Bar) needs confirmation on either side
Purple: Extreme momentum (CCI above 195/below -195) . Alert for reversal possibilities and divergences
Trading recommendations:
When color transitions from Grey or Purple or Red to Green - Enter long above high of this green candle
When color transitions from Grey or Purple or Green to Red enter short below low of this Red candle
Exit trade on 2 consecutive Red bars (for long) and Green bars (for Short) or Super Trend changes direction
Additionally can use Stochastics, CCI (and VWAP for shorter time frames) for validation/confirmation.
Thank you for looking this up. This is my first publish of an indicator/pine script so please judge me kindly! Happy trading.

Buy / Sell alert indicator [Crypto_BCT]Hello everyone!
I bring to your attention a indicator to determine the point of buy and sell purchase.
It is based on oscillators and a moving average.
It can be used to work with bots, for example 3COMMAS DCA bot.
Signal Condition Settings:
ATR
The current candle is larger than the ATR for this period
EMA
The signal is necessarily below (for buy) and above (for sell) the EMA of the specified period
(Buy) RSI low
The RSI index is below this value
(Sell) RSI High
The RSI index is higher than this value
(Buy) MFI low
The MFI index is below this value
(Sell) MFI High
The MFI index is higher than this value
(Buy) CCI low
CCI index is below this value
(Sell) CCI High
The CCI index is higher than this value
(Buy) Lowest bar from
The closing of the current bar is lower than the closing of the bars back in this range
(Sell) Highest bar from
The closing of the current bar is higher than the closing of bars in this range
(Buy) Lowest EMA bar ago
During a given distance back, the EMA value only decreased
(Sell) Highest EMA bar ago
At a given distance back, the EMA value only increased
I hope it will be useful!

DrawIndicatorOnTheChartLibrary "DrawIndicatorOnTheChart"
this library is used to show an indicator (such RSI, CCI, MOM etc) on the main chart with indicator's horizontal lines in a window. Location of the window is calculated dynamically by last price movemements
drawIndicator(indicatorName, indicator, indicatorcolor, period, indimax_, indimin_, levels, precision, xlocation) draws the related indicator on the chart
Parameters:
indicatorName : is the indicator name as string such "RSI", "CCI" etc
indicator : is the indicator you want to show, such rsi(close, 14), mom(close, 10) etc
indicatorcolor : is the color of indicator line
period : is the length of the window to show
indimax_ : is the maximum value of the indicator, for example for RSI it's 100.0, if the indicator (such CCI, MOM etc) doesn't have maximum value then use "na"
indimin_ : is the minimum value of the indicator, for example for RSI it's 0.0, if the indicator (such CCI, MOM etc)doesn't have maximum value then use "na"
levels : is the levels of the array for the horizontal lines. for example if you want horizontal lines at 30.0, and 70.0 then use array.from(30.0, 70.0). if no horizontal lines then use array.from(na)
precision : is the precision/number of decimals that is used to show indicator values, for example for RSI set it 2
xlocation : is end location of the indicator window, for example if xlocation = 0 window is created on the index of the last bar/candle
Returns: none
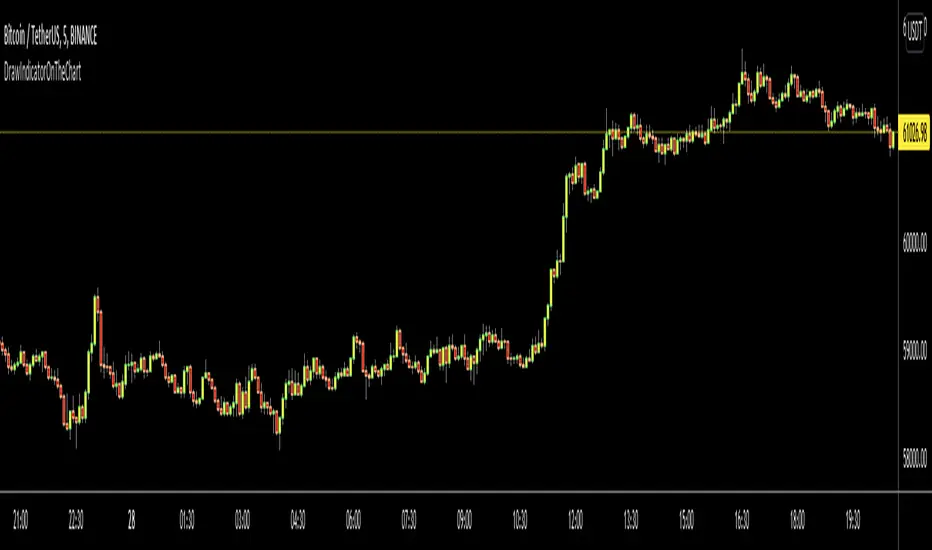
MJ ECT== One Line Introduction ==
ECT is a multi-level, trend focused technical indicator based on a three-step hierarchical approach - comprising the tide, wave, and ripple - to trend identification.
== Indicator Philosophy ==
The author believes that market trends can be understood in a three-step hierarchy, with tide at the top, wave in the middle, and ripple at the bottom, corresponding to long-, middle-, and short-term momentum in the stock price. This indicator therefore comprises three technical indicators which aims to reflect the abovementioned features of a trend. These three components are True Strength Index (TSI), Exponential Moving Averages ( EMA ), and Commodity Channel Index ( CCI ).
== Indicator Components and Breakdown ==
True Strength Index (TSI) -> Tide
A 20-period TSI is used to visualize the bullish or bearish sentiment surrounding the stock. Crossovers above the zero line are interpreted as bullish while crossovers below the zero line are interpreted as bearish . This is painted into the background where green represents bullish and red represents bearish . While the background is red ( bearish ), no bullish positions should be taken. Hence, the TSI painted background acts as a directional bias filter and going against the bias is not recommended. After understanding the directional bias, the user can delve further into the areas of value for the stock in the Wave.
Exponential Moving Averages ( EMA ) -> Wave
Four EMA are used (20, 50, 100, 200) to identify the dynamic support and resistance waves in a trending market. Stock price pullbacks into any of these EMA represent areas of value where the user can consider taking positions. The correct EMA to use depends on individual stock's behavior, with multiple bounces on a specified EMA being the priority. After understanding which wave best reflects the area of value of a stock, the user can move on to the Ripple to time their entries.
Commodity Channel Index ( CCI ) -> Ripple
A 5-period CCI is used to identify short-term oversold conditions where prices are on discount. Discount is defined by the 5-period CCI crossing below -100 as it reflects a weekly oversold condition. The indicator will display a small triangle below the candle when this condition is met.
== Ready To Deploy Field Manual ==
When background is painted red, do nothing.
When background is painted green, begin thinking of bullish opportunities.
Look for the specific EMA that has the most bounces of stock price in recent months, this is the area of value to look for buying opportunity.
For the candles that intersect the EMA you identified above, watch for the appearance of a small triangle below the candle that tells you the entry timing.
When the entry timing signal triangle appears, remember the High of that candle and buy your position when the subsequent candle breaks above this High.
If the High is not broken above in the next immediate candle, remember the newer High of the newer candle (basically follow / trail the latest High until a break above is hit).
If the background turns from green to red, stop following the High and do not enter because the market sentiment has changed to bearish .
If you are holding an existing position and the background turns red, consider exiting the position. You may consider remembering the Low of the candle and exit your position if this Low is broken below on a subsequent candle.
== Best Wishes ==
The author wishes the best success for all users of this technical indicator.
TradeChartist Tracker™𝗧𝗿𝗮𝗱𝗲𝗖𝗵𝗮𝗿𝘁𝗶𝘀𝘁 𝗧𝗿𝗮𝗰𝗸𝗲𝗿 is an essential real-time multi Indicator tracking toolkit that can be plotted as a standalone Indicator plot, a multi symbol tracker/screener for upto 10 different symbols and a visual scorecard for upto 5 different symbols. The indicators included in the tracker are Stochastic Oscillator, RSI, CCI, 15 different Moving Averages, MACD, Bollinger Bands %B (including Bollinger Bands and Breakout Signals), Ichimoku Cloud (including Breakout signals), Donchian Channels Oscillator (including Donchian Channels and Breakout Signals), Net Volume and Heikin Ashi Trend.
===================================================================================================================
™𝗧𝗿𝗮𝗱𝗲𝗖𝗵𝗮𝗿𝘁𝗶𝘀𝘁 𝗧𝗿𝗮𝗰𝗸𝗲𝗿 𝗨𝘀𝗲𝗿 𝗠𝗮𝗻𝘂𝗮𝗹
=====================================
™TradeChartist Tracker Plot Types
==============================
1. Indicator plot of Chart Symbol on its own , chosen from the 𝗜𝗻𝗱𝗶𝗰𝗮𝘁𝗼𝗿 𝗧𝘆𝗽𝗲 dropdown, enabling 𝐃𝐢𝐬𝐩𝐥𝐚𝐲 𝐈𝐧𝐝𝐢𝐜𝐚𝐭𝐨𝐫 𝐏𝐥𝐨𝐭 (𝐝𝐢𝐬𝐚𝐛𝐥𝐞𝐬 𝐓𝐫𝐚𝐜𝐤𝐞𝐫/𝐒𝐜𝐨𝐫𝐞𝐜𝐚𝐫𝐝).
In this example Daily chart of XRP-USDT, 55 period Stochastic is tracked for the chart symbol XRP-USDT.
2. Indicator plot of a Symbol different from the Chart Symbol , chosen from the 𝗜𝗻𝗱𝗶𝗰𝗮𝘁𝗼𝗿 𝗧𝘆𝗽𝗲 dropdown by enabling Tʀᴀᴄᴋ ᴀɴᴏᴛʜᴇʀ Sʏᴍʙᴏʟ's Iɴᴅɪᴄᴀᴛᴏʀ and entering the symbol name in the Sʏᴍʙᴏʟ ᴛᴏ Tʀᴀᴄᴋ input box, whilst keeping 𝐃𝐢𝐬𝐩𝐥𝐚𝐲 𝐈𝐧𝐝𝐢𝐜𝐚𝐭𝐨𝐫 𝐏𝐥𝐨𝐭 (𝐝𝐢𝐬𝐚𝐛𝐥𝐞𝐬 𝐓𝐫𝐚𝐜𝐤𝐞𝐫/𝐒𝐜𝐨𝐫𝐞𝐜𝐚𝐫𝐝) enabled.
In this example Daily chart of XRP-USDT, 55 period Stochastic is tracked for the BTC-USD (different from chart symbol XRP-USDT).
3. Tracker Plot of up to 10 Multiple Symbol Trackers for the Indicator chosen from the 𝗜𝗻𝗱𝗶𝗰𝗮𝘁𝗼𝗿 𝗧𝘆𝗽𝗲 dropdown, by disabling 𝐃𝐢𝐬𝐩𝐥𝐚𝐲 𝐈𝐧𝐝𝐢𝐜𝐚𝐭𝐨𝐫 𝐏𝐥𝐨𝐭 (𝐝𝐢𝐬𝐚𝐛𝐥𝐞𝐬 𝐓𝐫𝐚𝐜𝐤𝐞𝐫/𝐒𝐜𝐨𝐫𝐞𝐜𝐚𝐫𝐝) and by entering the number of trackers required in the 𝐍𝐮𝐦𝐛𝐞𝐫 𝐨𝐟 𝐓𝐫𝐚𝐜𝐤𝐞𝐫𝐬 input box under 𝗧𝗿𝗮𝗰𝗸𝗲𝗿 𝗣𝗹𝗼𝘁𝘀 section. Upto 10 Symbols can be tracked and can be input by the user in the input boxes from Sʏᴍʙᴏʟ 1,...Sʏᴍʙᴏʟ 10 . 𝐃𝐢𝐬𝐩𝐥𝐚𝐲 𝐈𝐧𝐝𝐢𝐜𝐚𝐭𝐨𝐫 𝐏𝐥𝐨𝐭 (𝐝𝐢𝐬𝐚𝐛𝐥𝐞𝐬 𝐓𝐫𝐚𝐜𝐤𝐞𝐫/𝐒𝐜𝐨𝐫𝐞𝐜𝐚𝐫𝐝) must be disabled for this plot type.
In this example Daily chart of Crypto Total Market Cap, Bollinger Bands %B is tracked for the chart symbol + 10 other Crypto symbols using Multi Symbol Trackers
4. Visual Scorecards of up to 5 Symbols for 8 indicators (all except Net Volume and HA Trend) can be plotted with real-time data by enabling 𝗗𝗶𝘀𝗽𝗹𝗮𝘆 𝗩𝗶𝘀𝘂𝗮𝗹 𝗦𝗰𝗼𝗿𝗲𝗰𝗮𝗿𝗱 - (𝟓 𝐓𝐫𝐚𝐜𝐤𝐞𝐫𝐬 𝐋𝐢𝐦𝐢𝐭). 𝐃𝐢𝐬𝐩𝐥𝐚𝐲 𝐈𝐧𝐝𝐢𝐜𝐚𝐭𝐨𝐫 𝐏𝐥𝐨𝐭 (𝐝𝐢𝐬𝐚𝐛𝐥𝐞𝐬 𝐓𝐫𝐚𝐜𝐤𝐞𝐫/𝐒𝐜𝐨𝐫𝐞𝐜𝐚𝐫𝐝) must be disabled for this plot type.
For the same example Daily chart of Crypto Total Market Cap as above, Visual Scorecard is plotted for 5 Symbols as shown.
5. Indicator Tracker labels can be plotted on Price chart by overlaying the Tracker on main chart and by switching from Separate Tracker Pane - Default to Tracker Labels only on Price Scale in the Lᴀʙᴇʟs Dɪsᴘʟᴀʏ Tʏᴘᴇ dropdown box.
In this example chart of 1hr XLM-USDT, Tracker labels of 55 EMA are plotted for 10 different symbols along with the 55 EMA plot of XLM-USDT.
Indicator plot that doesn't fit on price scale can be visualised using a second Tracker added to chart as shown in the ETH-USDT example below tracking Net Volume.
===================================================================================================================
𝗜𝗻𝗱𝗶𝗰𝗮𝘁𝗼𝗿𝘀 𝗜𝗻𝗰𝗹𝘂𝗱𝗲𝗱 𝗶𝗻 ™𝗧𝗿𝗮𝗱𝗲𝗖𝗵𝗮𝗿𝘁𝗶𝘀𝘁 𝗧𝗿𝗮𝗰𝗸𝗲𝗿
==============================================
1. Stochastic Oscillator
2. RSI
3. CCI
4. MA - (15 types included)
5. MACD
6. Bollinger Bands %B + Optional plots of Bollinger Bands and Breakout Signals
7. Ichimoku Cloud Oscillator + Optional plots of Ichimoku Cloud and Breakout Signals
8. Donchian Channels + Optional plots of Donchian Channels and Breakout Signals
9. Net Volume
10. Heikin Ashi Trend
All of the above indicators can be plotted as independent plots of the Chart Symbol or of a different symbol by enabling 𝐃𝐢𝐬𝐩𝐥𝐚𝐲 𝐈𝐧𝐝𝐢𝐜𝐚𝐭𝐨𝐫 𝐏𝐥𝐨𝐭 (𝐝𝐢𝐬𝐚𝐛𝐥𝐞𝐬 𝐓𝐫𝐚𝐜𝐤𝐞𝐫/𝐒𝐜𝐨𝐫𝐞𝐜𝐚𝐫𝐝). Some Oscillators have the option of Pʟᴏᴛ Sᴛʏʟᴇ under their relevant sections, and can be plotted as line, area or a histogram.
Oscillators 1-8 (except 4) require source price, lookback length and smoothing (where available) for the indicator plot. The colour of the tracker blocks is based on the Upper/Lower bands (where available), specified by the user in the respective sections. For example, if the RSI indicator is chosen to be plotted with Upper band at 60 and Lower band at 40, the tracker blocks and the Indicator plot paint the values between 40 and 60 in neutral colour which can be changed from the settings.
Multi Window BTC-USDT 1hr example chart below with various indicators from ™TradeChartist Tracker.
Note: The tracker colour is exactly colour of the Indicator Plot. The Visual Scorecard , however uses the mid values and doesn't take into account the bands specified by the user. For example, RSI score is green on the Visual Scorecard as long as RSI is above 50 and doesn't get affected by the user specified upper/lower band and this applies to all Oscillators. This is shown in the 1hr BTC-USDT chart below.
Moving Averages (MA) and MACD
------------------------------------------------------
Tracker plots and tracks one of 15 Moving Averages that can be chosen from the MA ᴛʏᴘᴇ and by specifying the MA Lᴇɴɢᴛʜ .
MACD uses EMA as default for calculating the MACD plots and Tracker data using Fᴀsᴛ Lᴇɴɢᴛʜ , Sʟᴏᴡ Lᴇɴɢᴛʜ and Sᴍᴏᴏᴛʜɪɴɢ . To experiment or use a different Moving Average to calculate MACD, disable 𝐔𝐬𝐞 𝐄𝐌𝐀 (Uɴᴄʜᴇᴄᴋ ᴛᴏ ᴜsᴇ MA ғʀᴏᴍ ᴀʙᴏᴠᴇ) and select the required Moving Average from MA ᴛʏᴘᴇ drop down of the 𝟰. 𝗠𝗼𝘃𝗶𝗻𝗴 𝗔𝘃𝗲𝗿𝗮𝗴𝗲 section.
Bollinger Bands %B + Optional plots of Bollinger Bands and Breakout Signals
---------------------------------------------------------------------------------------------------------------------------
Bollinger Bands %B is a companion oscillator for Bollinger Bands and helps depict where the price is, in relation to the Bollinger Bands. To plot the actual Bollinger Bands, enable Dɪsᴘʟᴀʏ Bᴏʟʟɪɴɢᴇʀ Bᴀɴᴅs and to plot the Bollinger Bands Breakout Signals, enable Sʜᴏᴡ BB Bʀᴇᴀᴋᴏᴜᴛ Sɪɢɴᴀʟs , with 𝐃𝐢𝐬𝐩𝐥𝐚𝐲 𝐈𝐧𝐝𝐢𝐜𝐚𝐭𝐨𝐫 𝐏𝐥𝐨𝐭 (𝐝𝐢𝐬𝐚𝐛𝐥𝐞𝐬 𝐓𝐫𝐚𝐜𝐤𝐞𝐫/𝐒𝐜𝐨𝐫𝐞𝐜𝐚𝐫𝐝) enabled.
Ichimoku Cloud Oscillator + Optional plots of Ichimoku Cloud and Breakout Signals
------------------------------------------------------------------------------------------------------------------------------------
Ichimoku Cloud Oscillator helps visualize the current price in relation to the breakout support/resistance of the Ichimoku Cloud using strict Ichimoku Cloud criteria (including Chikou Span agreeing with the breakout etc.). To plot the actual Ichimoku Cloud, enable Dɪsᴘʟᴀʏ Iᴄʜɪᴍᴏᴋᴜ Cʟᴏᴜᴅ and to plot the Kumo Breakout Signals, enable Sʜᴏᴡ Kᴜᴍᴏ Bʀᴇᴀᴋᴏᴜᴛ Sɪɢɴᴀʟs , with 𝐃𝐢𝐬𝐩𝐥𝐚𝐲 𝐈𝐧𝐝𝐢𝐜𝐚𝐭𝐨𝐫 𝐏𝐥𝐨𝐭 (𝐝𝐢𝐬𝐚𝐛𝐥𝐞𝐬 𝐓𝐫𝐚𝐜𝐤𝐞𝐫/𝐒𝐜𝐨𝐫𝐞𝐜𝐚𝐫𝐝) enabled.
Cloud Settings form the fundamental factor for this indicator to detect the breakouts. The settings for the Ichimoku Cloud is Automatic (detects right settings for the symbol type) by default, but this can be changed to Classic or 24/7 Crypto , based on the user preference from the settings under 𝐂𝐥𝐨𝐮𝐝 𝐓𝐲𝐩𝐞, which also includes a manual input option. Ichimoku traders can experiment different settings combinations under manual settings to suit their trading frequency and timeframe traded.
Donchian Channels + Optional plots of Donchian Channels and Breakout Signals
-------------------------------------------------------------------------------------------------------------------------------
Donchian Channels comprises of three plots - a upper band, a lower band and a mean line (or mid line of the channel). The upper band is based on highest high of N periods specified by the user and the lower band is based on the lowest low of N periods specified by the user. These channels help spot price breaching high or low of last N periods clearly, thereby aiding the trader to understand the price action of any symbol better on any given timeframe.
Donchian Channels Oscillator helps visualize the current price in relation to the Mean line of the Donchian Channels of user specified lookback period (specified in the Dᴏɴᴄʜɪᴀɴ Cʜᴀɴɴᴇʟ Lᴇɴɢᴛʜ input box). The sensitivity of the oscillator can be adjusted using smoothing factor in the Sᴍᴏᴏᴛʜɪɴɢ input box. To plot the actual Donchian Channels, enable Dɪsᴘʟᴀʏ Dᴏɴᴄʜɪᴀɴ Cʜᴀɴɴᴇʟs and to plot the Donchian Channels Breakout Signals, enable Sʜᴏᴡ DC Bʀᴇᴀᴋᴏᴜᴛ Sɪɢɴᴀʟs , with 𝐃𝐢𝐬𝐩𝐥𝐚𝐲 𝐈𝐧𝐝𝐢𝐜𝐚𝐭𝐨𝐫 𝐏𝐥𝐨𝐭 (𝐝𝐢𝐬𝐚𝐛𝐥𝐞𝐬 𝐓𝐫𝐚𝐜𝐤𝐞𝐫/𝐒𝐜𝐨𝐫𝐞𝐜𝐚𝐫𝐝) enabled.
Note: Using smoothing factor more than 1 doesn't reflect the actual Donchian Channels Mean line and also impacts the Tracker block colours.
Net Volume and Heikin Ashi Trend
-------------------------------------------------------
Net Volume and Heikin Ashi Trend can be tracked and plotted for up to 10 symbols in addition to the chart symbol, but both Net Volume and Heikin Ashi Trend are not included in the Visual Scorecard. Since the colour of the Net Volume depends on candle being bullish or bearish, it can help the user visualize if the current candle close of the symbol tracked is above or below the symbols's candle open.
Note: Bar Replay doesn't update the bar by bar indicator plot for historic bars for symbols other than the chart symbol. However, the Indicator Plot is perfectly usable for the realtime bar as data updates for both the Trackers and the Scorecard in realtime.
===================================================================================================================
𝗩𝗶𝘀𝘂𝗮𝗹 𝗦𝗰𝗼𝗿𝗲𝗰𝗮𝗿𝗱
=================
Visual Scorecard plots a green Bull or a red Bear Score colour plot for each Indicator from RSI to Donchian Channels Oscillator against every symbol tracked for up to 5 symbols max (First 5 symbols under 𝗧𝗿𝗮𝗰𝗸𝗲𝗿 𝗣𝗹𝗼𝘁𝘀 section). The gap between the scores can be adjusted using gap factor under Gᴀᴘ Fᴀᴄᴛᴏʀ ʙᴇᴛᴡᴇᴇɴ Sᴄᴏʀᴇs dropdown.
Visual Scorecard scoring method
----------------------------------------------------
RSI > 50 - 🟢
RSI < 50 - 🔴
Stoch > 50 - 🟢
Stoch < 50 - 🔴
CCI > 0 - 🟢
CCI < 0 - 🔴
Close price above MA plot - 🟢
Close price below MA plot - 🔴
MACD > 0 - 🟢
MACD < 0 - 🔴
Bollinger Bands %B > 50 - 🟢
Bollinger Bands %B < 50 - 🔴
Ichimoku Bullish Kumo Trend - 🟢
Ichimoku Bearish Kumo Trend - 🔴
Donchian Channels Oscillator > 0 (or close price above DC Mean Line) - 🟢
Donchian Channels Oscillator < 0 (or close price below DC Mean Line) - 🔴
Note: Bar Replay doesn't update the bar by bar scores/tracker data for historic bars for symbols other than the chart symbol. However, the Scorecard is perfectly usable for the realtime bar as data updates for both the Trackers and the Scorecard in realtime.
===================================================================================================================
𝗠𝘂𝗹𝘁𝗶 𝗦𝘆𝗺𝗯𝗼𝗹 𝗧𝗿𝗮𝗰𝗸𝗲𝗿𝘀/𝗟𝗮𝗯𝗲𝗹𝘀
=============================
Multi Symbol Tracker blocks continuously track the real-time indicator data of up to 10 symbols (in addition to the chart symbol) based on the number of Symbol Trackers preferred in the 𝐍𝐮𝐦𝐛𝐞𝐫 𝐨𝐟 𝐒𝐲𝐦𝐛𝐨𝐥 𝐓𝐫𝐚𝐜𝐤𝐞𝐫𝐬 (𝟎-𝟏𝟎) input box under the 𝗧𝗿𝗮𝗰𝗸𝗲𝗿 𝗣𝗹𝗼𝘁𝘀 section, and plots Bull, Bear and Neutral colour coded blocks based on both the indicator selected and settings preferred by the user under the relevant indicator section.
Multi Symbol Tracker Labels also continuously track the real-time indicator data in addition to the last close price (if 𝐒𝐡𝐨𝐰 𝐏𝐫𝐢𝐜𝐞 is enabled under 𝗧𝗿𝗮𝗰𝗸𝗲𝗿 𝗣𝗹𝗼𝘁𝘀 section), which helps user see the real-time changes in the indicator values and price changes of the symbols tracked.
The Tracker Label colours are exactly the same as the Tracker Block colours and are filtered based on the user preferred bands on the Oscillator values. This is slightly different to the Visual Scorecard Colour coding as the range between the user preferred bands is colour coded in a neutral colour, whereas the Scorecard uses only Bull and Bear Colours as explained in the 𝗩𝗶𝘀𝘂𝗮𝗹 𝗦𝗰𝗼𝗿𝗲𝗰𝗮𝗿𝗱 heading above. For example, if the user prefers RSI upper band of 60 and lower band of 40, the range between the values of 40 and 60 will be colour coded in neutral colour which can be changed from the 𝗨𝘀𝗲𝗳𝘂𝗹 𝗘𝘅𝘁𝗿𝗮𝘀 section of the indicator settings.
Note 1: Default settings are based on the Oscillator mid values and hence the Tracker Blocks match with the Visual Scorecard colour codes. Using Upper and Lower bands for oscillators help spot the oversold and overbought zones and also helps spot breakout threshold based on Indicator values specified by the user. Example chart with visual depiction below using RSI.
Note 2: Bar Replay doesn't update the bar by bar scores/tracker data for historic bars for symbols other than the chart symbol. However, the Tracker blocks/labels are perfectly usable for the realtime bar as data updates for both the Trackers and the Scorecard in realtime.
===================================================================================================================
Frequently Asked Questions
========================
Q: When I load the ™TradeChartist Tracker, why are the values in the labels blurred sometimes?
A: This happens occasionally as shown in the chart below, when the script is loaded for the first time or when a different setting is used.
To resolve this, just hide and unhide the script using the 👁 next to the Indicator title. If it is not visible, just hover the mouse/crosshair over the Indicator Title and it will be visible.
Q: Why does the indicator plot, tracker blocks and labels of Symbols being tracked, not update when I use Bar Replay?
A: As explained in the relevant sections above, historic data for bars and indicators other than chart symbol doesn't update on bar replay. But the chart symbol data does update for every bar on bar replay. This doesn't affect the real-time values and block colours for the symbols tracked.
Q: Can I track real-time values of a currently trading symbol when I'm on a symbol chart that is inactive? For example, can I see labels with real-time BTC values on a Sunday when I'm on a SPX chart when its not in session?
A: Simple answer is no. This is because, the plots are based on bar times of the chart and the symbols are tracked based on the bar time. So if the SPX session ended on Friday, the last known value of the BTC labels will be from Friday and hence it is always recommended to track symbols from a symbol chart that is in session.
Q: Does ™TradeChartist Tracker repaint?
A: This indicator doesn't repaint but it is not recommended to trade a different symbol from the chart based on the real-time data alone without checking if the current symbol chart is in session as inactive price chart will not have updated data on symbols tracked. Also, bar replay doesn't work on data pulled from external symbol data than the chart symbol, but signals confirmed at candle close and confirmed by Tracker blocks with appropriate colour code will be in agreement with the respective indicator and can be double checked for building trust and confidence on the indicator.
Q: Can ™TradeChartist Tracker be connected to other indicators as external source?
A: Yes. ™TradeChartist Tracker can be connected to another script and there are several use cases in doing so. A couple of examples are shown below.
1. ™TradeChartist Tracker 's Bollinger Bands %B 𝗜𝗻𝗱𝗶𝗰𝗮𝘁𝗼𝗿 𝗣𝗹𝗼𝘁 connected to ™TradeChartist Plotter to plot Divergences on the 4hr XAU-USD main price chart.
2. ™TradeChartist Tracker 's 𝐁𝐫𝐞𝐚𝐤𝐨𝐮𝐭 𝐓𝐫𝐞𝐧𝐝 𝐈𝐝𝐞𝐧𝐭𝐢𝐟𝐢𝐞𝐫 connected to ™TradeChartist Plug and Trade as Oscillatory Signal with 0/0 to generate trade signals with Targets and performance information on trades.
More Example Charts
==================
===================================================================================================================
Best Practice: Test with different settings first using Paper Trades before trading with real money
===================================================================================================================
This is not a free to use indicator. Get in touch with me (PM me directly if you would like trial access to test the indicator)
Premium Scripts - Trial access and Information
Trial access offered on all Premium scripts.
PM me directly to request trial access to the scripts or for more information.
===================================================================================================================
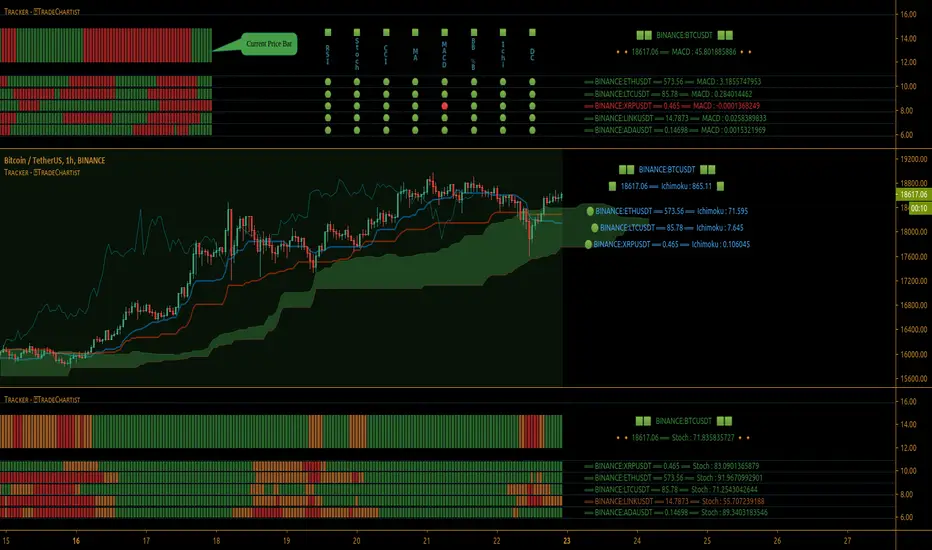
Improved Commodity Channel IndexI took the normal CCI version and I made it better and more pleasantly visual.
At the same time now the CCI changes color based on the direction is going to take
We also have more levels, to define even better the current situation.
Details are simple :
green color cci = uptrend - > buy
red color cci = downtrend - > sell