Moving Averages By MoneyTribe21This custom indicator displays three Smoothed Moving Averages (SMAs) designed to help traders identify market trends, potential reversals, and key support/resistance levels. It is ideal for trend-following strategies, momentum trading, and confirming price direction in various timeframes.
Three Smoothed Moving Averages to track short-term, mid-term, and long-term trends:
21-Day SMA: Captures short-term price momentum and trend direction.
50-Day SMA: Represents the mid-term trend, often used as dynamic support/resistance.
200-Day SMA: The long-term trend filter, commonly watched by institutional traders.
Fully Customizable Settings
Adjust period length for each SMA to fit your strategy.
Modify line colors, thickness, and styles for better visibility.
Enable/disable specific SMAs based on preference.
Works Across All Markets
Compatible with Forex, Stocks, Commodities, Crypto, and Indices.
Supports multiple timeframes (1M, 5M, 1H, Daily, Weekly, etc.)
Tìm kiếm tập lệnh với "averages"

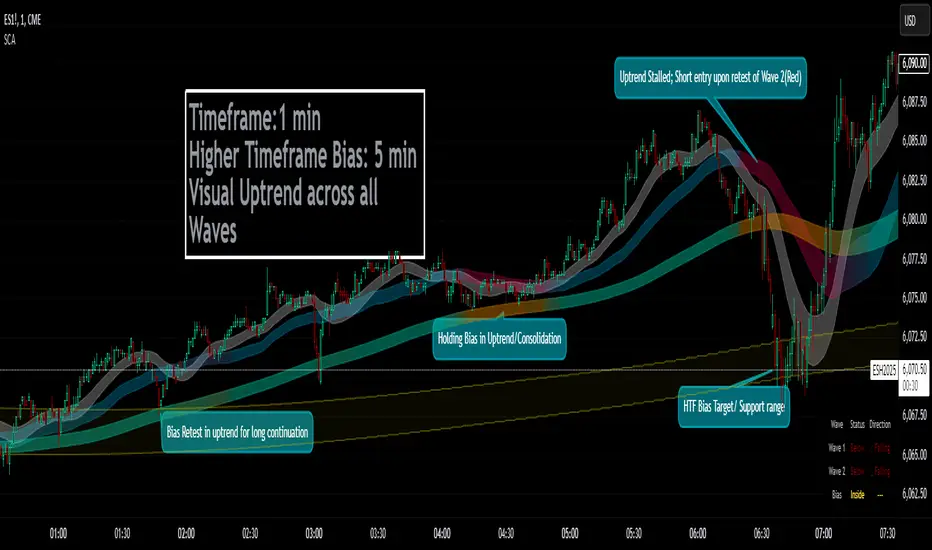
Smoothed Candle Averages- NovaTheMachineThis script utilizes a series of moving averages that the user is able to change as they see fit for their own use.
The averages plotted for the first 2 waves are the High-Low rays of the selected period of time with the chosen moving average style.
The Bias is the Heikin Ashi High-Low ray plotted over the chosen time period, while the Secondary Bias is a higher Timeframe Bias for the same period of time on a selected higher timeframe.
The visuals for each ray are able to be changed to either; lines, solid wave, or dynamic wave.
The Dynamic waves will change color according to the total dissection and utilize the Min-Max range selected as a weight for the strength of the trend. Thus providing an at-a-glance overview of the price relative to trend.
The key objective with this script is to gauge the longer term trend with the current price action, to establish patterns and determine strength of moves both away from and towards the moving average/bias.
When both waves are trending with the Bias, it can be reasoned that there is a strong trend established, when waves and Bias are mixed or trending sideways it can be reasoned there is a range forming or potential for a direction change. When price has broken the waves and biases we can reasonably assume that a new trend has been formed, using the waves and biases again to determine the strength and length of the trend.
The Table will display whether the current price is above or below each wave, and whether the price is continuing or retracing. The Signals plotted are used to help identify when price has broken a wave more swiftly.
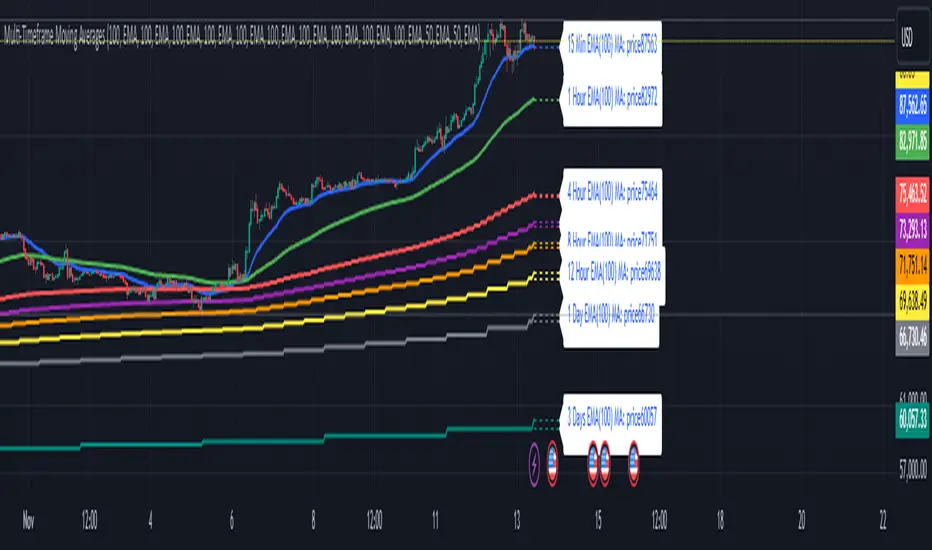
Multi-Timeframe Moving Averages by Skyito"Hope everyone likes this and finds it useful! This multi-timeframe moving average indicator provides a comprehensive view of moving averages from various timeframes directly on one chart. It’s designed to help traders analyze market trends and levels more effectively without constantly switching between charts.
Script Explanation: This indicator supports a range of moving average types, including SMA, EMA, HMA, WMA, VWMA, RMA, SSMA, and DEMA, allowing for flexibility in analysis. Each moving average is fully customizable by length and type for each timeframe, giving you control over how trends are represented.
The indicator includes timeframes such as 15 minutes, 1 hour, 4 hours, 6 hours, 8 hours, 12 hours, 1 day, 3 days, 5 days, 1 week, 3 weeks, and 1 month. Each moving average is displayed as a line with a small dashed extension, showing a label that contains the moving average’s timeframe, type, and current price level. The dark blue labels are slightly enlarged to enhance readability on the chart, making it easier to track important levels at a glance.
Use Case: This tool is ideal for traders looking to stay aware of trend levels across multiple timeframes on one chart. Adjusting the moving averages’ lengths and types enables customization for any strategy, while the label information provides an immediate understanding of the timeframe and trend context.
Enjoy the streamlined view and the added insights from multi-timeframe analysis!"
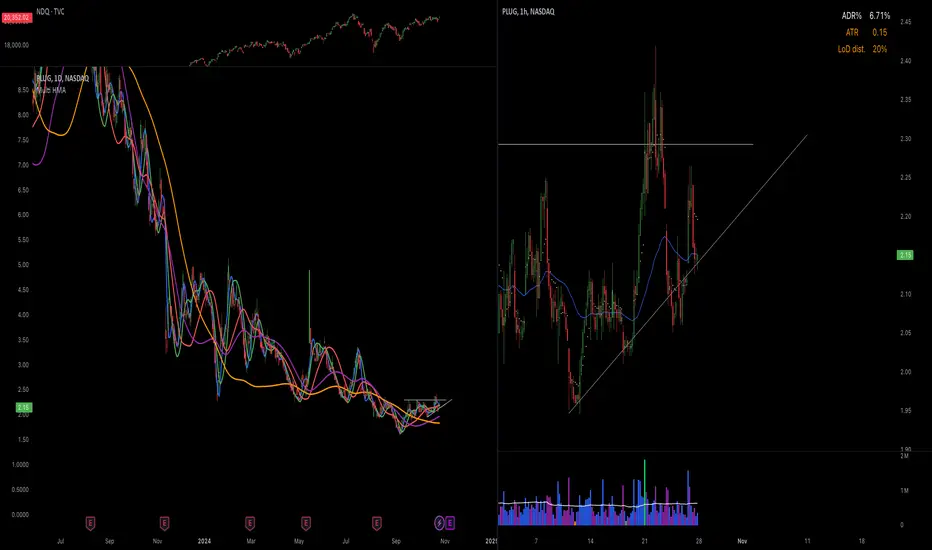
Hull Moving Averages 10, 20, 50, 100, 200This script generates multiple Hull Moving Averages (HMAs) on a trading chart, allowing for comprehensive trend analysis across different timeframes. Five HMAs with lengths of 10, 20, 50, 100, and 200 periods are plotted on the chart, providing insights into short, medium, and long-term market trends.
Each HMA can be customized with individual colors to easily distinguish between the different timeframes, helping traders visually track momentum changes and trend strength across these intervals. The Hull Moving Average is known for reducing lag compared to other moving averages, which makes it particularly useful for identifying turning points more accurately.
With this script:
You can adjust the colors of each HMA line individually, ensuring optimal visual differentiation.
You can analyze short-term trends with HMA 10 and HMA 20, medium-term trends with HMA 50, and long-term trends with HMA 100 and HMA 200.
The chart provides an at-a-glance view of multi-timeframe trends, making it useful for trading strategies that rely on crossovers or divergence patterns.
This tool is ideal for traders who want to identify trend direction, strength, and possible reversal points with minimal lag.
Multi-timeframe 24 moving averages + BB+SAR+Supertrend+VWAP █ OVERVIEW
The script allows to display up to 24 moving averages ("MA"'s) across 5 timeframes plus two bands (Bollinger Bands or Supertrend or Parabolic SAR or VWAP bands) each from its own timeframe.
The main difference of this script from many similar ones is the flexibility of its settings:
- Bulk enable/disable and/or change properties of several MAs at once.
- Save 3 of your frequently used templates as presets using CSV text configurations.
█ HOW TO USE
Some use examples:
In order to "show 31, 50, 200 EMAs and 20, 100, 200 SMAs for each of 1H, 4H, D, W, M timeframes using blue for short MA, yellow for mid MA and red for long MA" use the settings as shown on a screenshot below.
In order to "Show a band of chart timeframe MA's of lengths 5, 8, 13, 21, 34, 55, 100 and 200 plus some 1H, 4H, D and W MAs. Be able to quickly switch off the band of chart tf's MAs. For chart timeframe MA's only show labels for 21, 100 and 200 EMAs". You can set TF1 and TF2 to chart's TF and set you fib MAs there and configure fixed higher timeframe MAs using TF3, TF4 and TF5 (e.g. using 1H, D and W timeframes and using 1H 800 in place of 4H 200 MA). However, quicker way may be using CSV - the syntax is very simple and intuitive, see Preset 2 as it comes in the script. You can easily switch chart tf's band of MAs by toggling on/off your chart timeframe TF's (in our example, TF1 and TF2).
The settings are either obvious or explained in tooltips.
Note 1: When using group settings and CSV presets do not forget that individual setting affected will no have any effect. So, if some setting does not work, check whether it is overridden with some group setting or a CSV preset.
Note 2: Sometimes you can notice parts of MA's hanging in the air, not lasting up to the last bar. This is not a bug as explained on this screenshot:
█ FOR DEVELOPERS
The script is a use case of my CSVParser library, which in turn uses Autotable library, both of which I hope will be quite helpful. Autotable is so powerful and comprehensive that you will hardly ever wish to use normal table functions again for complex tables.
The indicator was inspired by Pablo Limonetti's url=https://www.tradingview.com/script/nFs56VUZ/]Multi Timeframe Moving Averages and Raging @RagingRocketBull's # Multi SMA EMA WMA HMA BB (5x8 MAs Bollinger Bands) MAX MTF - RRB

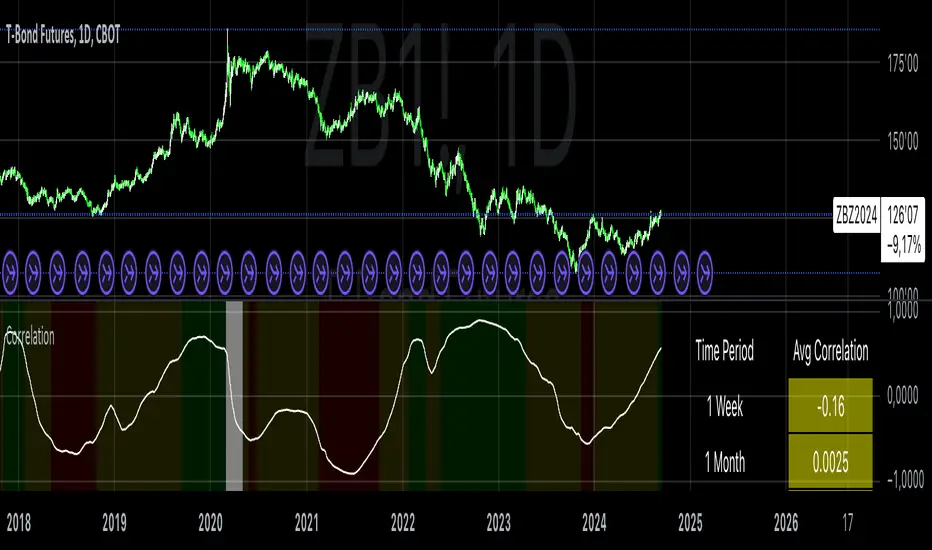
Correlation with AveragesThe "Correlation with Averages" indicator is designed to visualize and analyze the correlation between a selected asset's price and a base symbol's price, such as the S&P 500 (SPY). This indicator allows users to evaluate how closely an asset’s price movements align with those of the base symbol over various time periods, providing insights into market trends and potential portfolio adjustments.
Key Features:
Base Symbol and Correlation Period:
Users can specify the base symbol (default is SPY) and the period for correlation measurement (default is 252 trading days, approximating one year).
Correlation Calculation:
The indicator computes the correlation between the asset’s closing price and the base symbol’s closing price for the defined period.
Visualization:
The correlation value is plotted on the chart, with conditional background colors indicating the strength and direction of the correlation:
Red for negative correlation (below -0.5)
Green for positive correlation (above 0.5)
Yellow for neutral correlation (between -0.5 and 0.5)
Average Correlation Over Time:
Average correlations are calculated and displayed for various periods: one week, one month, one year, and five years.
A table on the chart provides dynamic updates of these average values with color-coded backgrounds to indicate correlation strength.
The Role of Correlation in Portfolio Management
Correlation is a crucial concept in portfolio management because it measures the degree to which two securities move in relation to each other. Understanding correlation helps investors construct diversified portfolios that balance risk and return. Here's why correlation is important:
Diversification:
By including assets with low or negative correlation in a portfolio, investors can reduce overall portfolio volatility and risk. For instance, if one asset is negatively correlated with another, when one performs poorly, the other may perform well, thus smoothing the overall returns.
Risk Management:
Correlation analysis helps in identifying the potential impact of one asset’s performance on the entire portfolio. Assets with high correlation can lead to concentrated risk, while those with low correlation offer better risk management.
Performance Analysis:
Correlation measures the degree to which asset returns move together. This can inform strategic decisions, such as whether to adjust positions based on expected market conditions.
Scientific References
Markowitz, H. M. (1952). "Portfolio Selection." Journal of Finance, 7(1), 77-91.
This foundational paper introduced Modern Portfolio Theory, highlighting the importance of diversification and correlation in reducing portfolio risk.
Jorion, P. (2007). Financial Risk Manager Handbook. Wiley.
This handbook provides an in-depth exploration of risk management techniques, including the use of correlation in portfolio management.
Elton, E. J., Gruber, M. J., Brown, S. J., & Goetzmann, W. N. (2014). Modern Portfolio Theory and Investment Analysis. Wiley.
This book elaborates on the concepts of correlation and diversification, offering practical insights into portfolio construction and risk management.
By utilizing the "Correlation with Averages" indicator, traders and portfolio managers can make informed decisions based on the relationship between asset prices and the base symbol, ultimately enhancing their investment strategies.
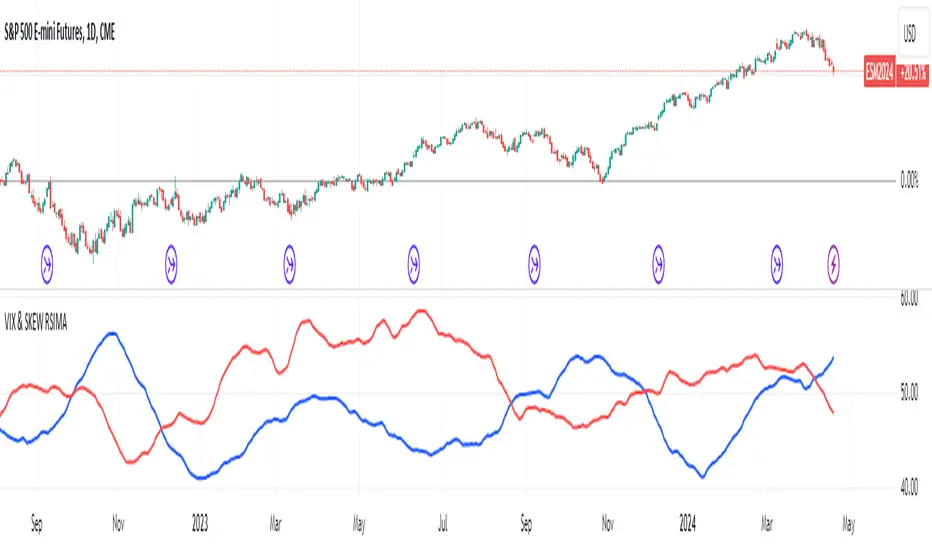
VIX and SKEW RSI Moving AveragesSKEW and VIX are both indicators of market volatility and risk, but they represent different aspects.
VIX (CBOE Volatility Index) :.
The VIX is a well-known indicator for predicting future market volatility. It is calculated primarily based on S&P 500 options premiums and indicates the degree of market instability and risk.
Typically, when the VIX is high, market participants view the future as highly uncertain and expect sharp volatility in stock prices. It is generally considered an indicator of market fear.
SKEW Index :.
The SKEW is a measure of how much market participants estimate the risk of future declines in stock prices, calculated by the CBOE (Chicago Board Options Exchange) and derived from the premium on S&P 500 options.
If the SKEW is high, market participants consider the risk of future declines in stock prices to be high. This generally indicates a "fat tail at the base" of the market and suggests that the market perceives it as very risky.
These indicators are used by market participants to indicate their concerns and expectations about future stock price volatility. In general, when the VIX is high and the SKEW is high, the market is considered volatile and risky. Conversely, when the VIX is low and the SKEW is low, the market is considered relatively stable and low risk.
Inverse Relationship between SKEW and VIX
It is often observed that there is an inverse correlation between SKEW and VIX. In general, the relationship is as follows
High VIX and low SKEW: When the VIX is high and the SKEW is low, the market is considered volatile while the risk of future stock price declines is low. This indicates that the market is exposed to sharp volatility, but market participants do not expect a major decline.
Low VIX and High SKEW: A low VIX and high SKEW indicates that the market is relatively stable, while the risk of future declines in stock prices is considered high. This indicates that the market is calm, but market participants are wary of a sharp future decline.
This inverse correlation is believed to be the result of market participants' psychology and expectations affecting the movements of the VIX and SKEW. For example, when the VIX is high, it is evident that the market is volatile, and under such circumstances, people tend to view the risk of a sharp decline in stock prices as low. Conversely, when the VIX is low, the market is considered relatively stable and the risk of future declines is likely to be higher.
SKEWVIX RSIMACROSS
In order to compare the trends of the SKEW and VIX, the 50-period moving average of the Relative Strength Index (RSI) was used for verification. the RSI is an indicator of market overheating or overcooling, and the 50-period moving average can be used to determine the medium- to long-term trend. This analysis reveals how the inverse correlation between the SKEW and the VIX relates to the long-term moving average of the RSI.
how to use
Moving Average Direction
Rising blue for VIXRSI indicates increased uncertainty in the market
Rising red for SKEWRSI indicates optimism and beyond
RSI moving average crossing
When the SKEW is dominant, market participants are considered less concerned about a black swan event (significant unexpected price volatility). This suggests that the market is stable and willing to take risks. On the other hand, when the VIX is dominant, it indicates increased market volatility. Investors are more concerned about market uncertainty and tend to take more conservative positions to avoid risk. The direction of the moving averages and the crossing of the moving averages of the two indicators can give an indication of the state of the market.
SKEW>VIX Optimistic/Goldilocks
VIX>SKEW Uncertainty/turbulence
The market can be judged as follows.
BestRegards
Triple Moving Averages (Gradient, Alarm & Multi TF)Triple Moving Averages
Features:
- 7 Different MA's (RMA, SMA, EMA, 'WMA', HMA, DEMA, EMA)
- Gradient coloring
- Multi timeframe
- Crossover alarm's and alarm delay function
- Forecasting (By removing the last bar in the MA period)
Moving Average to easely identify the trend and trend strength.
Gradient coloring and personal color preferences can be made.
Alert Delay System
When timing is essentially, this helps you get the alarm just in time.
Use it with the triggers ONLY ONCE PER BAR or ONLY ONCE. Then the alarm comes before the close, but you don't have to worry about it triggering just seconds after bar open :)
Default = 15m Recomended for 1h chart
Alarm's
Get the alarms before it's actually crossing or when it crosses
*This is not a selfmade indicator but simply merging from several indicators and added alert delay function and multi timeframe support
// Credits
- BigBitsIO Script : Scripting Tutorial 6 Triple Many Moving Averages Forecasting
- PineCoders Script : Color Gradient Framework PineCoders

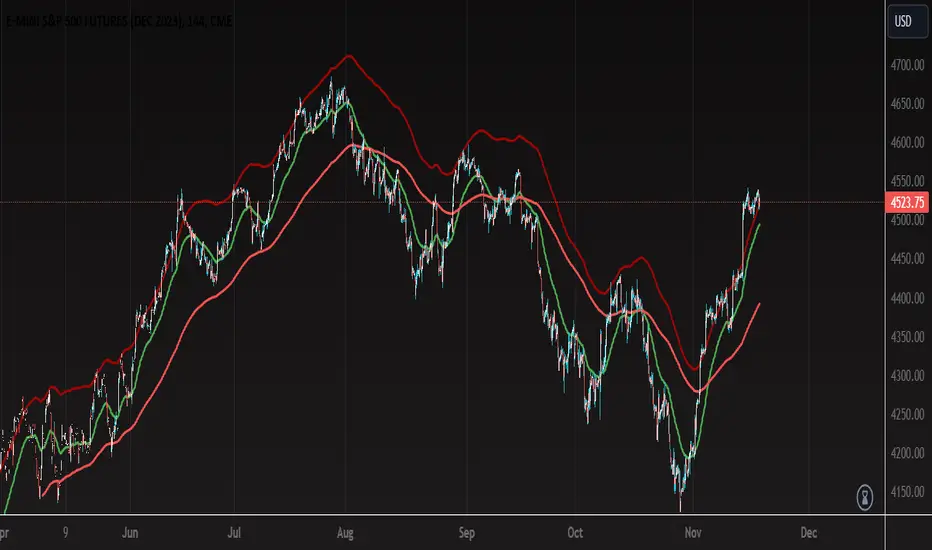
Multiple Moving Averages with OffsetUser Description:
This indicator is designed to provide insights into market trends based on multiple moving averages with customizable offsets. It combines short-term and long-term moving averages to offer a comprehensive view of price movements. The user can adjust various parameters to tailor the indicator to their preferred settings.
How the Strategy Works:
Short-Term Fast Moving Average:
Length: 47 (Adjustable by the user)
Offset: Adjustable (User-defined)
Color: Green
Line Thickness: 2 (Thicker green line for better visibility)
Long-Term Fast Moving Average:
Length: 203 (Adjustable by the user)
Offset: Adjustable (User-defined)
Color: Red
Line Thickness: 2 (Thicker red line for better visibility)
Long-Term Slow Moving Average:
Length: 100 (Adjustable by the user)
Offset: 77 (Adjustable by the user)
Color: Custom Red (RGB: 161, 5, 5)
Line Thickness: 2 (Thicker red line for better visibility)
Interpretation:
When the Short-Term Fast Moving Average (green line) is above the Long-Term Fast Moving Average (red line), it may signal a potential uptrend.
Conversely, when the Short-Term Fast Moving Average is below the Long-Term Fast Moving Average, it may indicate a potential downtrend.
The Long-Term Slow Moving Average provides additional context, allowing users to assess the strength and stability of trends.
Customization:
Users can experiment with different lengths and offsets to fine-tune the indicator based on their trading preferences and market conditions.
TIPS:
- When price action reaches upper RED moving average is probable that the price action is close to a pull back or change of direction.
- When price action falls and closes below the bottom RED moving average it can be a possible change of direction to the downside.
- You can use the green moving average as a filter and confluence to identify if the price action is moving towards the upside or downside.
Note: This indicator is for informational purposes only and should be used in conjunction with other analysis tools for comprehensive decision-making.
Z-Score Weighted Moving Averages
Indicator: Z-Score Weighted Moving Averages
Another way of calculating moving average
This indicator calculates two types of weighted moving averages (WMAs) based on z-scores and inverse z-scores. The indicator's purpose is to provide traders with a unique perspective on price movements by assigning different weights to data points based on their deviations from the mean . The two types of WMAs generated are as follows:
Smoothed Weighted Moving Average (wma_smoothed):
Z-score is calculated as (price - SMA of price/(MAD*1.2533), where MAD is mean absolute deviation around the median).
Weights are assigned to each data point based on the inverse of (1 + absolute value of the z-scores). This emphasizes points closer to the mean and reduces the influence of extreme deviations.
The weighted moving average is computed using the calculated weights, giving more importance to data points with smaller z-scores and, therefore, points that are closer to the mean.
Dynamic Weighted Moving Average (wma_dynamic):
Z-scores are still calculated in the same way.
Weights are assigned based on the absolute value of the z-scores. This emphasizes data points with significant deviations from the mean, without considering the direction of deviation.
The weighted moving average is computed using these dynamic weights, giving more weight to data points that have larger absolute z-scores, irrespective of whether they are above or below the mean.

Consensio Allocation ToolOriginally created and taught by Taylor Jenks, this indicator provides portfolio allocation suggestions based on the behaviour of price and 3 simple moving averages (4/10/40 by default)
(ie. when short & medium term SMAs are above the long term then allocation is to be 100%).
This percentage allocated to the stock/commodity is to be reduced as it passes below the SMA's, particularly as each moving average crosses.
Consensio is useful for scaling in and out of a position as the portfolio allocation will change according to the momentum of the asset.
The rules below are my own based on understanding of the trading system developed by Jenks and his online content.
This script has the following rules:
if fastAboveSlowMA and not mediumAboveSlowMA
allocation := 30.0
else if longAboveFastMA
allocation := 0.0
else if fastAboveMediumMA and fastAboveSlowMA
allocation := 100.0
else if not fastAboveMediumMA and fastAboveSlowMA
allocation := 80.0
else if not fastAboveMediumMA and not fastAboveSlowMA
allocation := 50.0
else if not mediumAboveSlowMA and fastAboveSlowMA
allocation := 50.0
// Calculate adjusted allocation percentage based on crossing moving averages
allocation := allocation + (priceAboveFastMA ? 10.0 : -10.0)
allocation := allocation + (priceAboveMediumMA ? 10.0 : -10.0)

Colorful Moving Averageswhat is Colorful Moving Averages?
This indicator allows you to use your favorite moving averages in their advanced form.
what it does?
It gives you easy access to the following information with a single indicator: the direction and momentum of the price,
rate of change of momentum (acceleration),
time-dependent change in momentum,
and all the other information a moving average provides.
it paints the selected moving average type according to the momentum it has, and also shows the momentum and acceleration values in a table. colors are interpreted as follows: the color of the moving average is red, the momentum is negative; A green color means the momentum is positive, and a yellow color means the momentum is 0. As the momentum changes, the moving average takes on different shades of these 3 colors. how it actually works can be easily understood at a glance.
"Δ" sign indicates momentum compressed between 100 and -100.
"Γ" sign indicates the momentum of the momentum, that is the acceleration. its values are compressed between 100 and -100.
how it does it?
it uses this formulas:
how to use it?
First, select the moving average type you want to use. then set the length and source. Now, with a single indicator, you can observe both the distance of the price from the mean, its instantaneous momentum relative to the last candle by looking at the symbol "Δ", the current change of momentum by looking at the symbol "Γ", and the time-dependent change in its momentum by looking at the colors. you can also see the maximum and minimum points where the momentum is equal to 0.

Multi-Asset Month/Month % change 10yr Averages10 Year Averages of Month-on-Month % change: Shows current asset, and 3x user input assets
-For comparing seasonal tendencies among different assets.
-Choose from a variety of monthly average measures as source: sma(close, length), sma(ohlc4, length); as well as sma's of vwap, vwma, volume, volatility. (sma = simple moving average).
-Averages based on month cf previous month: i.e. Feb % = Feb compared to Jan; Jan % = Jan compared to prev year's Dec. Average of the last 10yrs of these values is the printed value.
-Plot on current year (2023), or previous year (2022). If Plotting on current year, and a month of year has not yet occured, a 9yr average will be printed.
/// notes ///
-daily bars in month is a global setting; so choose assets which have similar trading days per month. i.e. Crypto: length = 30 (days per month); Stocks/FX/Indices: length = 21 (days per month).
-only plots on Daily timeframe.
10yr Avgs; Plotting with Year = 2022; using sma(close, 21) as source for average M/M change

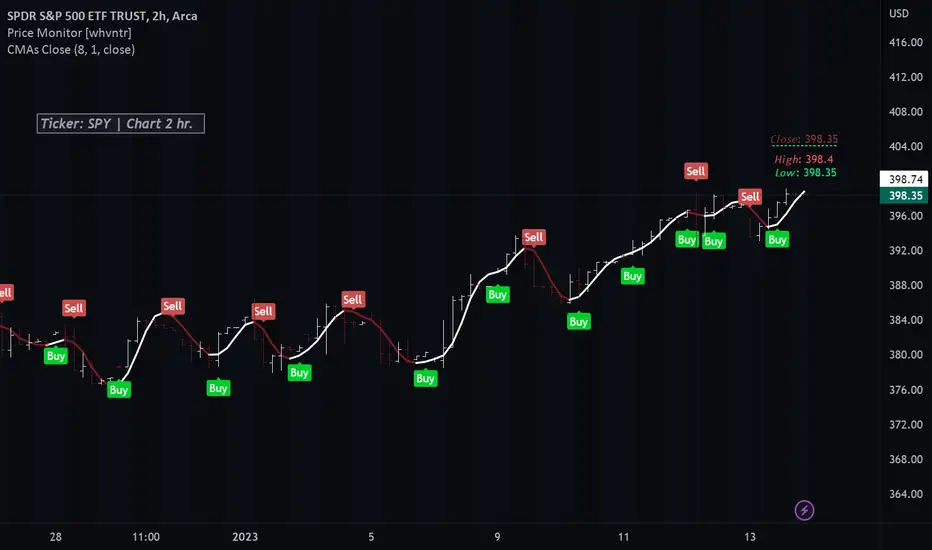
Colored Moving Averages With Close Signals[Whvntr][TradeStation]Plots the first time the close price is above or below the colored portion of the chosen MA. The MA's formula is from TradeStation's indicator: "Colored Moving Averages Can Help You Spot Trends" . I modified that indicator with customizations that include: Buy and Sell signals. Each time the current bar closes above the MA, while it's red (bearish), there's a Sell label at the start of that MA trend. Likewise: each time the current bar closes below the MA, while it's white (bullish), there's a Buy label at the beginning of that MA trend. You can now, also, easily see which MA you are selecting by hovering your cursor over the tooltips icon. I've included a modified Hull MA as default because I've found this SMA combination with the WMA to be a very smooth oscillation. I've also added some different types of MA's. Colored moving averages are helpful to determine when a trend may be reversing.
MA's
1 · Modified Hull MA: (SMA of the WMAs Hull Formula)
2 · Hull MA
3 · Exponential Moving Average
4 · Weighted Moving Average
5 · RMA Moving Average used in RSI
6 · Volume Weighted MA
7 · Simple Moving Average
This indicator isn't endorsed as a guarantee of future, favorable, results.
Seasonal tendency: week-on-week % change and 10yr Averages-shows week-on-week % change, and 10yr averages of these % changes
-scan across the 10yr averages to get a good idea of the seasonality of an asset
-best used on commodities with strong seasonal tendencies (Gold, Wheat, Coffee, Lean hogs etc)
-works only on daily timeframe
-by default it will compare SMA(length) in the following way, BTC: Sunday cf previous Sunday | ES/Gold: Monday cf previous Monday
-for most assets, 5 daily bars in a week (SMA(5)) => that's the default. For BTC can change this to 7.
~~inputs:
-change input year to show any previous decade of asset's history; the table will display over that year on the chart
-choose expression for Average of % change week on week: SMA, ohlc4, vwma, vwap (default SMA)
-choose number of daily bars in a week (i.e. SMA length)
-change label sizes/colors
~~notes:
-When applied to current year: will print the 10yr average for previous weeks in the year; 9yr average for future weeks in the year
-drawings and SMA plot on the above chart are just to show visually how the week's average is calculated, and how this lines up with the label
-current week of year will highlight in large font orange by default
-the first 2 weeks of the year are omitted because of a bug i can't figure out, which throws out bad numbers.
-cannot print all the values for each of previous 10yrs; 'code too long' error. Could likely do this via using matrices but would require a rewrite
17th Dec 2022
@twingall

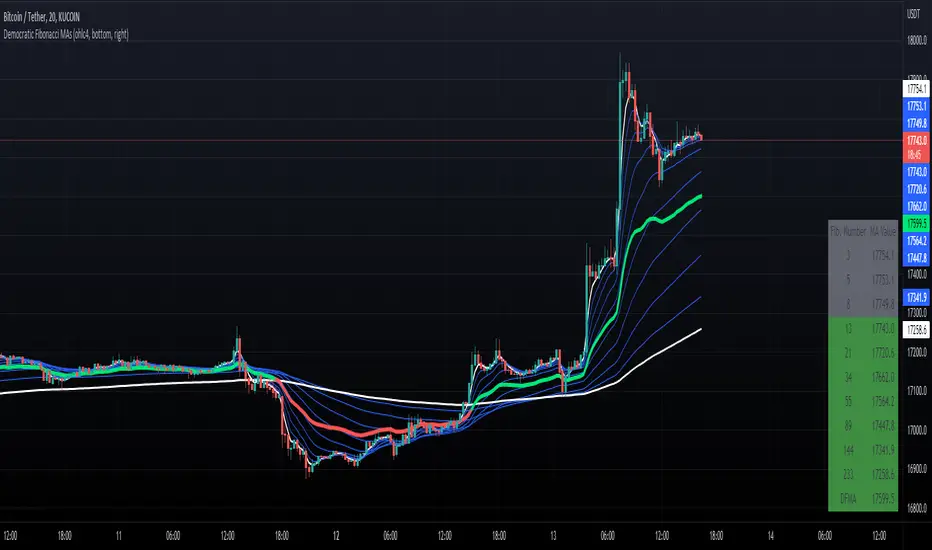
Democratic Fibonacci Moving AveragesWith this indicator, we have taken moving averages at Fibonacci lengths (3 to 233) as well as the average of these values, labeled the DFMA. Additionally, these values have been inputted into a table overlay. The cross of the FibMA(233) and the DFMA can be used as a signal for long or short.
The FibMA lengths of 3 and 233 are plotted in white by default, the FibMAs with lengths between 3 and 233 are plotted in blue by default, and the democratic line (DFMA) that averages these lines is plotted in green or red (depending on if the value is above or below the 233-length FibMA).
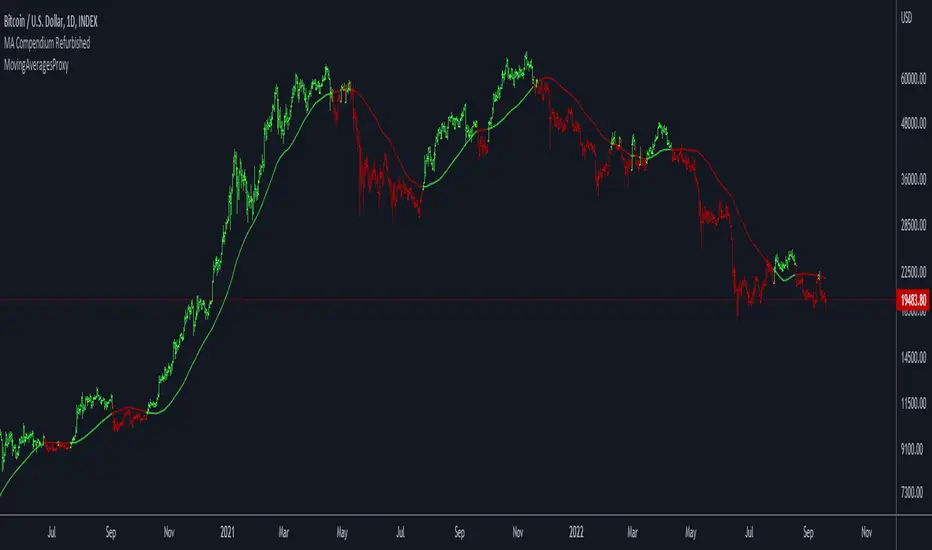
Moving Averages ProxyLibrary "MovingAveragesProxy"
Moving Averages Proxy - Library of all moving averages spread out in different libraries
rvwap(_src, fixedTfInput, minsInput, hoursInput, daysInput, minBarsInput)
Calculates the Rolling VWAP (customized VWAP developed by the team of TradingView)
Parameters:
_src : (float) Source. Default: close
fixedTfInput : (bool) Use a fixed time period. Default: false
minsInput : (int) Minutes. Default: 0
hoursInput : (int) Hours. Default: 0
daysInput : (int) Days. Default: 1
minBarsInput : (int) Bars. Default: 10
Returns: (float) Rolling VWAP
correlationMa(src, len, factor)
Correlation Moving Average
Parameters:
src : (float) Source. Default: close
len : (int) Length
factor : (float) Factor. Default: 1.7
Returns: (float) Correlation Moving Average
regma(src, len, lambda)
Regularized Exponential Moving Average
Parameters:
src : (float) Source. Default: close
len : (int) Length
lambda : (float) Lambda. Default: 0.5
Returns: (float) Regularized Exponential Moving Average
repma(src, len)
Repulsion Moving Average
Parameters:
src : (float) Source. Default: close
len : (int) Length
Returns: (float) Repulsion Moving Average
epma(src, length, offset)
End Point Moving Average
Parameters:
src : (float) Source. Default: close
length : (int) Length
offset : (float) Offset. Default: 4
Returns: (float) End Point Moving Average
lc_lsma(src, length)
1LC-LSMA (1 line code lsma with 3 functions)
Parameters:
src : (float) Source. Default: close
length : (int) Length
Returns: (float) 1LC-LSMA Moving Average
aarma(src, length)
Adaptive Autonomous Recursive Moving Average
Parameters:
src : (float) Source. Default: close
length : (int) Length
Returns: (float) Adaptive Autonomous Recursive Moving Average
alsma(src, length)
Adaptive Least Squares
Parameters:
src : (float) Source. Default: close
length : (int) Length
Returns: (float) Adaptive Least Squares
ahma(src, length)
Ahrens Moving Average
Parameters:
src : (float) Source. Default: close
length : (int) Length
Returns: (float) Ahrens Moving Average
adema(src)
Ahrens Moving Average
Parameters:
src : (float) Source. Default: close
Returns: (float) Moving Average
autol(src, lenDev)
Auto-Line
Parameters:
src : (float) Source. Default: close
lenDev : (int) Length for standard deviation
Returns: (float) Auto-Line
fibowma(src, length)
Fibonacci Weighted Moving Average
Parameters:
src : (float) Source. Default: close
length : (int) Length
Returns: (float) Moving Average
fisherlsma(src, length)
Fisher Least Squares Moving Average
Parameters:
src : (float) Source. Default: close
length : (int) Length
Returns: (float) Moving Average
leoma(src, length)
Leo Moving Average
Parameters:
src : (float) Source. Default: close
length : (int) Length
Returns: (float) Moving Average
linwma(src, period, weight)
Linear Weighted Moving Average
Parameters:
src : (float) Source. Default: close
period : (int) Length
weight : (int) Weight
Returns: (float) Moving Average
mcma(src, length)
McNicholl Moving Average
Parameters:
src : (float) Source. Default: close
length : (int) Length
Returns: (float) Moving Average
srwma(src, length)
Square Root Weighted Moving Average
Parameters:
src : (float) Source. Default: close
length : (int) Length
Returns: (float) Moving Average
EDSMA(src, len)
Ehlers Dynamic Smoothed Moving Average.
Parameters:
src : Series to use ('close' is used if no argument is supplied).
len : Lookback length to use.
Returns: EDSMA smoothing.
dema(x, t)
Double Exponential Moving Average.
Parameters:
x : Series to use ('close' is used if no argument is supplied).
t : Lookback length to use.
Returns: DEMA smoothing.
tema(src, len)
Triple Exponential Moving Average.
Parameters:
src : Series to use ('close' is used if no argument is supplied).
len : Lookback length to use.
Returns: TEMA smoothing.
smma(src, len)
Smoothed Moving Average.
Parameters:
src : Series to use ('close' is used if no argument is supplied).
len : Lookback length to use.
Returns: SMMA smoothing.
hullma(src, len)
Hull Moving Average.
Parameters:
src : Series to use ('close' is used if no argument is supplied).
len : Lookback length to use.
Returns: Hull smoothing.
frama(x, t)
Fractal Reactive Moving Average.
Parameters:
x : Series to use ('close' is used if no argument is supplied).
t : Lookback length to use.
Returns: FRAMA smoothing.
kama(x, t)
Kaufman's Adaptive Moving Average.
Parameters:
x : Series to use ('close' is used if no argument is supplied).
t : Lookback length to use.
Returns: KAMA smoothing.
vama(src, len)
Volatility Adjusted Moving Average.
Parameters:
src : Series to use ('close' is used if no argument is supplied).
len : Lookback length to use.
Returns: VAMA smoothing.
donchian(len)
Donchian Calculation.
Parameters:
len : Lookback length to use.
Returns: Average of the highest price and the lowest price for the specified look-back period.
Jurik(src, len)
Jurik Moving Average.
Parameters:
src : Series to use ('close' is used if no argument is supplied).
len : Lookback length to use.
Returns: JMA smoothing.
xema(src, len)
Optimized Exponential Moving Average.
Parameters:
src : Series to use ('close' is used if no argument is supplied).
len : Lookback length to use.
Returns: XEMA smoothing.
ehma(src, len)
EHMA - Exponential Hull Moving Average
Parameters:
src : Source
len : Period
Returns: Exponential Hull Moving Average (EHMA)
covwema(src, len)
Coefficient of Variation Weighted Exponential Moving Average (COVWEMA)
Parameters:
src : Source
len : Period
Returns: Coefficient of Variation Weighted Exponential Moving Average (COVWEMA)
covwma(src, len)
Coefficient of Variation Weighted Moving Average (COVWMA)
Parameters:
src : Source
len : Period
Returns: Coefficient of Variation Weighted Moving Average (COVWMA)
eframa(src, len, FC, SC)
Ehlrs Modified Fractal Adaptive Moving Average (EFRAMA)
Parameters:
src : Source
len : Period
FC : Lower Shift Limit for Ehlrs Modified Fractal Adaptive Moving Average
SC : Upper Shift Limit for Ehlrs Modified Fractal Adaptive Moving Average
Returns: Ehlrs Modified Fractal Adaptive Moving Average (EFRAMA)
etma(src, len)
Exponential Triangular Moving Average (ETMA)
Parameters:
src : Source
len : Period
Returns: Exponential Triangular Moving Average (ETMA)
rma(src, len)
RMA - RSI Moving average
Parameters:
src : Source
len : Period
Returns: RSI Moving average (RMA)
thma(src, len)
THMA - Triple Hull Moving Average
Parameters:
src : Source
len : Period
Returns: Triple Hull Moving Average (THMA)
vidya(src, len)
Variable Index Dynamic Average (VIDYA)
Parameters:
src : Source
len : Period
Returns: Variable Index Dynamic Average (VIDYA)
zsma(src, len)
Zero-Lag Simple Moving Average (ZSMA)
Parameters:
src : Source
len : Period
Returns: Zero-Lag Simple Moving Average (ZSMA)
zema(src, len)
Zero-Lag Exponential Moving Average (ZEMA)
Parameters:
src : Source
len : Period
Returns: Zero-Lag Exponential Moving Average (ZEMA)
evwma(src, len)
EVWMA - Elastic Volume Weighted Moving Average
Parameters:
src : Source
len : Period
Returns: Elastic Volume Weighted Moving Average (EVWMA)
tt3(src, len, a1_t3)
Tillson T3
Parameters:
src : Source
len : Period
a1_t3 : Tillson T3 Volume Factor
Returns: Tillson T3
gma(src, len)
GMA - Geometric Moving Average
Parameters:
src : Source
len : Period
Returns: Geometric Moving Average (GMA)
wwma(src, len)
WWMA - Welles Wilder Moving Average
Parameters:
src : Source
len : Period
Returns: Welles Wilder Moving Average (WWMA)
cma(src, len)
Corrective Moving average (CMA)
Parameters:
src : Source
len : Period
Returns: Corrective Moving average (CMA)
edma(src, len)
Exponentially Deviating Moving Average (MZ EDMA)
Parameters:
src : Source
len : Period
Returns: Exponentially Deviating Moving Average (MZ EDMA)
rema(src, len)
Range EMA (REMA)
Parameters:
src : Source
len : Period
Returns: Range EMA (REMA)
sw_ma(src, len)
Sine-Weighted Moving Average (SW-MA)
Parameters:
src : Source
len : Period
Returns: Sine-Weighted Moving Average (SW-MA)
mama(src, len)
MAMA - MESA Adaptive Moving Average
Parameters:
src : Source
len : Period
Returns: MESA Adaptive Moving Average (MAMA)
fama(src, len)
FAMA - Following Adaptive Moving Average
Parameters:
src : Source
len : Period
Returns: Following Adaptive Moving Average (FAMA)
hkama(src, len)
HKAMA - Hilbert based Kaufman's Adaptive Moving Average
Parameters:
src : Source
len : Period
Returns: Hilbert based Kaufman's Adaptive Moving Average (HKAMA)
getMovingAverage(type, src, len, lsmaOffset, inputAlmaOffset, inputAlmaSigma, FC, SC, a1_t3, fixedTfInput, daysInput, hoursInput, minsInput, minBarsInput, lambda, volumeWeighted, gamma_aarma, smooth, linweight, volatility_lookback, jurik_phase, jurik_power)
Abstract proxy function that invokes the calculation of a moving average according to type
Parameters:
type : (string) Type of moving average
src : (float) Source of series (close, high, low, etc.)
len : (int) Period of loopback to calculate the average
lsmaOffset : (int) Offset for Least Squares MA
inputAlmaOffset : (float) Offset for ALMA
inputAlmaSigma : (float) Sigma for ALMA
FC : (int) Lower Shift Limit for Ehlrs Modified Fractal Adaptive Moving Average
SC : (int) Upper Shift Limit for Ehlrs Modified Fractal Adaptive Moving Average
a1_t3 : (float) Tillson T3 Volume Factor
fixedTfInput : (bool) Use a fixed time period in Rolling VWAP
daysInput : (int) Days in Rolling VWAP
hoursInput : (int) Hours in Rolling VWAP
minsInput : (int) Minutrs in Rolling VWAP
minBarsInput : (int) Bars in Rolling VWAP
lambda : (float) Regularization Constant in Regularized EMA
volumeWeighted : (bool) Apply volume weighted calculation in selected moving average
gamma_aarma : (float) Gamma for Adaptive Autonomous Recursive Moving Average
smooth : (float) Smooth for Adaptive Least Squares
linweight : (float) Weight for Volume Weighted Moving Average
volatility_lookback : (int) Loopback for Volatility Adjusted Moving Average
jurik_phase : (int) Phase for Jurik Moving Average
jurik_power : (int) Power for Jurik Moving Average
Returns: (float) Moving average
Variety N-Tuple Moving Averages [Loxx]Variety N-Tuple Moving Averages is a moving average indicator that allows you to create 1- 30 tuple moving average types; i.e., Double-MA, Triple-MA, Quadruple-MA, Quintuple-MA, ... N-tuple-MA. This version contains 5 different moving average types including T3. A list of tuples can be found here if you'd like to name the order of the moving average by depth: Tuples extrapolated
You'll notice that this is a lot of code and could normally be packed into a single loop in order to extract the N-tuple MA, however due to Pine Script limitations and processing paradigm this is not possible ... yet.
If you choose the EMA option and select a depth of 2, this is the classic DEMA; EMA with a depth of 3 is the classic TEMA, and so on and so forth this is to help you understand how this indicator works. This version of NTMA is restricted to a maximum depth of 30 or less. Normally this indicator would include 50 depths but I've cut this down to 30 to reduce indicator load time. In the future, I'll create an updated NTMA that allows for more depth levels.
This is considered one of the top ten indicators in forex. You can read more about it here: forex-station.com
How this works
Step 1: Run factorial calculation on the depth value,
Step 2: Calculate weights of nested moving averages
factorial(nemadepth) / (factorial(nemadepth - k) * factorial(k); where nemadepth is the depth and k is the weight position
Examples of coefficient outputs:
6 Depth: 6 15 20 15 6
7 Depth: 7 21 35 35 21 7
8 Depth: 8 28 56 70 56 28 8
9 Depth: 9 36 34 84 126 126 84 36 9
10 Depth: 10 45 120 210 252 210 120 45 10
11 Depth: 11 55 165 330 462 462 330 165 55 11
12 Depth: 12 66 220 495 792 924 792 495 220 66 12
13 Depth: 13 78 286 715 1287 1716 1716 1287 715 286 78 13
Step 3: Apply coefficient to each moving average
For QEMA, which is 5 depth EMA, the caculation is as follows
ema1 = ta.ema(src, length)
ema2 = ta.ema(ema1, length)
ema3 = ta.ema(ema2, length)
ema4 = ta.ema(ema3, length)
ema5 = ta.ema(ema4, length)
qema = 5 * ema1 - 10 * ema2 + 10 * ema3 - 5 * ema4 + ema5
Included:
Alerts
Loxx's Expanded Source Types
Bar coloring

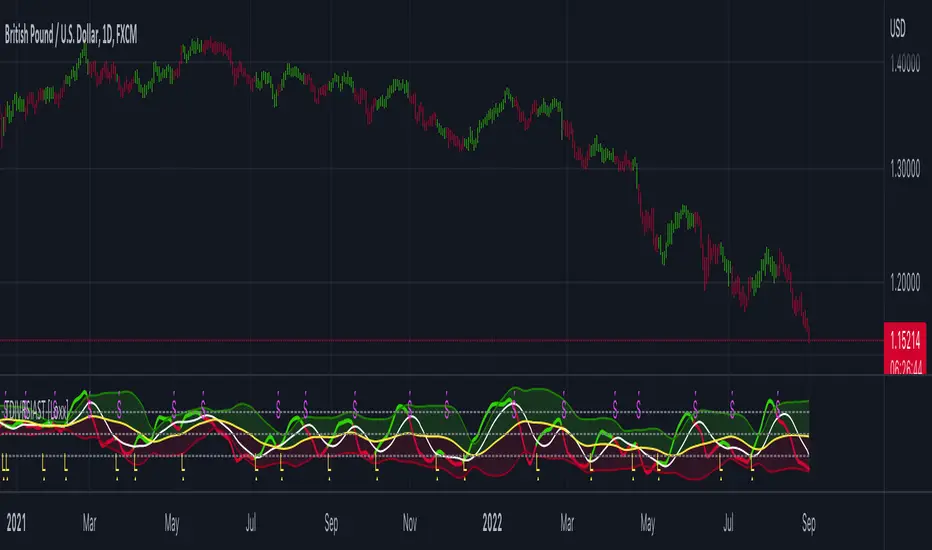
TDI w/ Variety RSI, Averages, & Source Types [Loxx]This hybrid indicator is developed to assist traders in their ability to decipher and monitor market conditions related to trend direction, market strength, and market volatility. Even though comprehensive, the Traders Dynamic Index (TDI) is easy to read and use. This version of TDI has 7 different types of RSI, 38 different types of Moving Averages, 33 source types, and 5 types of signals as well as alerts and coloring. Default RSI type is set to Jurik's RSX. This indicator can be used on any timeframe.
Green/Red line = RSI Price line
White line = Trade Signal line
Dark Green/Red lines = Volatility Band
Yellow line = Market Base Line
Gray dashed lines = Horizontal boundary lines, oversold/overbought
5 Signal Types w/ Alerts
Signal Crosses = Green/Red line crosses over or under White line
Floating Boundary Crosses = Green/Red line crosses over or under upper Dark Green/ lower Red lines
Horizontal Boundary Crosses = Green/Red line crosses over or under Gray dashed upper/lower lines
Floating Middle Crosses = Green/Red line crosses over or under Yellow line
Horizontal Middle Crosses = Green/Red line crosses over or under Gray dashed middle line
Manual Signal Types (no alerts included, this requires manual analysis)
Volatility Band Signals (Dark Green/Red lines) = When the Dark Green/Red lines are expanding, the market is strong and trending. When Dark Green/Red lines are constricting, the market is weak and in a range. When the Dark Green/Red lines are extremely tight in a narrow range, expect an economic announcement or other market condition to spike the market
Beyond these simple signal rules, there are various other signals or methods that can be used to derive long/short/exit signals from TDI included slope of the Green/Red line and bounces off the Yellow line.
Included
Loxx's Expanded Source Types
Loxx's Variety RSI
Loxx's Moving Averages
Signals
Alerts
Bar coloring
Variety-Filtered, Squeeze Moving Averages [Loxx]Variety-Filtered, Squeeze Moving Averages is a chop zone indicator that identifies when price is below a specific volatility threshold calculated as the difference between a fast and slow moving average and filtered using ATR- or Pips-based threshold. This indicator can be use as both an entry and exit indicator. It identifies both chop zones and breakouts/breakdowns
How to use
When the candles turn white and the threshold bands appear on the chart, this is indicative of low volatility
When price exits the threshold bands, price will usually explode up or down giving a long or short signal. This acts as a sort of squeeze momentum.
Included:
Bar coloring
Signals
Alerts, 4 types of alerts: Squeeze started, Squeeze ended, long, and short
Loxx's Expanded Source Types
35+ Loxx's Moving Averages

Variety Moving Averages w/ Dynamic Zones [Loxx]Variety Moving Averages w/ Dynamic Zones contains 33 source types and 35+ moving averages with double dynamic zones levels.
What are Dynamic Zones?
As explained in "Stocks & Commodities V15:7 (306-310): Dynamic Zones by Leo Zamansky, Ph .D., and David Stendahl"
Most indicators use a fixed zone for buy and sell signals. Here’ s a concept based on zones that are responsive to past levels of the indicator.
One approach to active investing employs the use of oscillators to exploit tradable market trends. This investing style follows a very simple form of logic: Enter the market only when an oscillator has moved far above or below traditional trading lev- els. However, these oscillator- driven systems lack the ability to evolve with the market because they use fixed buy and sell zones. Traders typically use one set of buy and sell zones for a bull market and substantially different zones for a bear market. And therein lies the problem.
Once traders begin introducing their market opinions into trading equations, by changing the zones, they negate the system’s mechanical nature. The objective is to have a system automatically define its own buy and sell zones and thereby profitably trade in any market — bull or bear. Dynamic zones offer a solution to the problem of fixed buy and sell zones for any oscillator-driven system.
An indicator’s extreme levels can be quantified using statistical methods. These extreme levels are calculated for a certain period and serve as the buy and sell zones for a trading system. The repetition of this statistical process for every value of the indicator creates values that become the dynamic zones. The zones are calculated in such a way that the probability of the indicator value rising above, or falling below, the dynamic zones is equal to a given probability input set by the trader.
To better understand dynamic zones, let's first describe them mathematically and then explain their use. The dynamic zones definition:
Find V such that:
For dynamic zone buy: P{X <= V}=P1
For dynamic zone sell: P{X >= V}=P2
where P1 and P2 are the probabilities set by the trader, X is the value of the indicator for the selected period and V represents the value of the dynamic zone.
The probability input P1 and P2 can be adjusted by the trader to encompass as much or as little data as the trader would like. The smaller the probability, the fewer data values above and below the dynamic zones. This translates into a wider range between the buy and sell zones. If a 10% probability is used for P1 and P2, only those data values that make up the top 10% and bottom 10% for an indicator are used in the construction of the zones. Of the values, 80% will fall between the two extreme levels. Because dynamic zone levels are penetrated so infrequently, when this happens, traders know that the market has truly moved into overbought or oversold territory.
Calculating the Dynamic Zones
The algorithm for the dynamic zones is a series of steps. First, decide the value of the lookback period t. Next, decide the value of the probability Pbuy for buy zone and value of the probability Psell for the sell zone.
For i=1, to the last lookback period, build the distribution f(x) of the price during the lookback period i. Then find the value Vi1 such that the probability of the price less than or equal to Vi1 during the lookback period i is equal to Pbuy. Find the value Vi2 such that the probability of the price greater or equal to Vi2 during the lookback period i is equal to Psell. The sequence of Vi1 for all periods gives the buy zone. The sequence of Vi2 for all periods gives the sell zone.
In the algorithm description, we have: Build the distribution f(x) of the price during the lookback period i. The distribution here is empirical namely, how many times a given value of x appeared during the lookback period. The problem is to find such x that the probability of a price being greater or equal to x will be equal to a probability selected by the user. Probability is the area under the distribution curve. The task is to find such value of x that the area under the distribution curve to the right of x will be equal to the probability selected by the user. That x is the dynamic zone.
Included
Bar coloring
Alerts
Channels fill
Loxx's Expanded Source Types
35+ moving average types

Moving Averages With Cross AlertsA simple way to add up to 5 moving averages with optional crossover/crossunder alerts.
Available options for Moving Average Type are:
SMA
EMA (default)
HMA
RMA
WMA
VWMA
VWAP
ALMA
By default, 5 moving averages are enabled and set to the following:
MA1 set to 5
MA2 set to 13
MA3 set to 50
MA4 set to 200
MA5 set to 800
Each moving average has the following options:
Enable/Disable
Source (default is close)
Length
Color
MTF 3 Moving Averages (EMA & SMA)Hi, for those of you that like trading with Moving averages, here's a script to view 3 of them at once on MTF scale.
I added the option to switch between EMA and SMA or to view all of them at the same time.
I use the 1D moving averages to look for support and resistance levels on smaller timeframes (1H,4H)
Enjoy!
MM :)
