Combo Backtest 123 Reversal & Chande Momentum Oscillator This is combo strategies for get a cumulative signal.
First strategy
This System was created from the Book "How I Tripled My Money In The
Futures Market" by Ulf Jensen, Page 183. This is reverse type of strategies.
The strategy buys at market, if close price is higher than the previous close
during 2 days and the meaning of 9-days Stochastic Slow Oscillator is lower than 50.
The strategy sells at market, if close price is lower than the previous close price
during 2 days and the meaning of 9-days Stochastic Fast Oscillator is higher than 50.
Second strategy
This indicator plots Chande Momentum Oscillator. This indicator was
developed by Tushar Chande. A scientist, an inventor, and a respected
trading system developer, Mr. Chande developed the CMO to capture what
he calls "pure momentum". For more definitive information on the CMO and
other indicators we recommend the book The New Technical Trader by Tushar
Chande and Stanley Kroll.
The CMO is closely related to, yet unique from, other momentum oriented
indicators such as Relative Strength Index, Stochastic, Rate-of-Change,
etc. It is most closely related to Welles Wilder`s RSI, yet it differs
in several ways:
- It uses data for both up days and down days in the numerator, thereby
directly measuring momentum;
- The calculations are applied on unsmoothed data. Therefore, short-term
extreme movements in price are not hidden. Once calculated, smoothing
can be applied to the CMO, if desired;
- The scale is bounded between +100 and -100, thereby allowing you to
clearly see changes in net momentum using the 0 level. The bounded scale
also allows you to conveniently compare values across different securities.
WARNING:
- For purpose educate only
- This script to change bars colors
Tìm kiếm tập lệnh với "backtesting"

Bollinger Band Strategy (Basic) Version 1 This strategy is for learning purposes only. Pay special attention to these strategies on longer aggregation periods (like 1 hr chart or more). Don't expect accurate results when you set a limit to 10 cents above your entry to be accurate. For example if you set the chart to 1 day, the price may move down and hit a stop 10 times then tag your limit. If this doesn't make sense, just don't use strategies here. Learn more first. That being said, I don't have specific recommendations for each aggregation period, backtesting isn't always perfect.
Now then, this strategy can be used as the traditional BB method by setting the "Stop" and "Limit Out" to like 10000, check "Reversal Entry" and uncheck "Limit Time of Day" This will keep the strategy running just reverse your position when price crosses outside each band.
INPUTS:
Length - length of WMA that I used for mean of Bollinger Band (this may suppose to be SMA, too bad)
Source - O-H-L-C basis for WMA
Deviation - normal Standard deviation that would be set when using Bollinger Band
Trailing stop check box - your stop value will be either a hard stop or trailing stop for an exit
Stop - the stop value - remember you can set this really high and it won't stop out
Limit Out - the limit value for exit
Reversal Entry check box - This changes each entry from a reversal (traditional idea of BB) to enter a trend trade - hopefully version 2 will have choice to trend one direction and reversal in the other.
Limit Time of Day - Especially when trading futures, you may want to only trade a specific time of day, when this box is checked, you can set the entry times below, exit will still only occur based on limit/stop or a flip entry order (the opposite entry condition is met)
Tips:
when I don't know a thing about a price range, like gold. I can set the limit out to 10000 and play with a trailing stop to get a better idea of what is even possible before tuning further.

Combo Backtest 123 Reversal & Chande Forecast Oscillator This is combo strategies for get a cumulative signal.
First strategy
This System was created from the Book "How I Tripled My Money In The
Futures Market" by Ulf Jensen, Page 183. This is reverse type of strategies.
The strategy buys at market, if close price is higher than the previous close
during 2 days and the meaning of 9-days Stochastic Slow Oscillator is lower than 50.
The strategy sells at market, if close price is lower than the previous close price
during 2 days and the meaning of 9-days Stochastic Fast Oscillator is higher than 50.
Second strategy
The Chande Forecast Oscillator developed by Tushar Chande The Forecast
Oscillator plots the percentage difference between the closing price and
the n-period linear regression forecasted price. The oscillator is above
zero when the forecast price is greater than the closing price and less
than zero if it is below.
WARNING:
- For purpose educate only
- This script to change bars colors.
Forward testing code block by CanundoThis is purely a code block useable for strategies you want to forward test. No backtest will happen.
It's especially important to figure out if a strategy will perform as well in live trading as it does in backtesting since the trades in backtests are calculated differently. It can be a great difference.
It's best to test it on 1 minute timeframe or lower. It would take 1-2 minutes to see the first trade happen while no trade before exists.

Robot WhiteBox MultiMAScript for backtesting of the trading strategy of the robot.
Strategy similar to the strategy of ShiftMA, but is used on 3 limit orders, instead of one.
Lime lines - for opening of a long position.
Red lines - for opening of a short position.
The blue line (always one) - for closing of any positions.

Parabolic SAR StrategyReally questioning how the trailing stop works in the backtesting framework of tradingview/pinescript, I am sure I would not get the same results with the same strategy in MT4.

Combo Backtest 123 Reversal & Chaikin Volatility This is combo strategies for get a cumulative signal.
First strategy
This System was created from the Book "How I Tripled My Money In The
Futures Market" by Ulf Jensen, Page 183. This is reverse type of strategies.
The strategy buys at market, if close price is higher than the previous close
during 2 days and the meaning of 9-days Stochastic Slow Oscillator is lower than 50.
The strategy sells at market, if close price is lower than the previous close price
during 2 days and the meaning of 9-days Stochastic Fast Oscillator is higher than 50.
Second strategy
Chaikin's Volatility indicator compares the spread between a security's
high and low prices. It quantifies volatility as a widening of the range
between the high and the low price.
You can use in the xPrice1 and xPrice2 any series: Open, High, Low, Close, HL2,
HLC3, OHLC4 and ect...
WARNING:
- For purpose educate only
- This script to change bars colors.


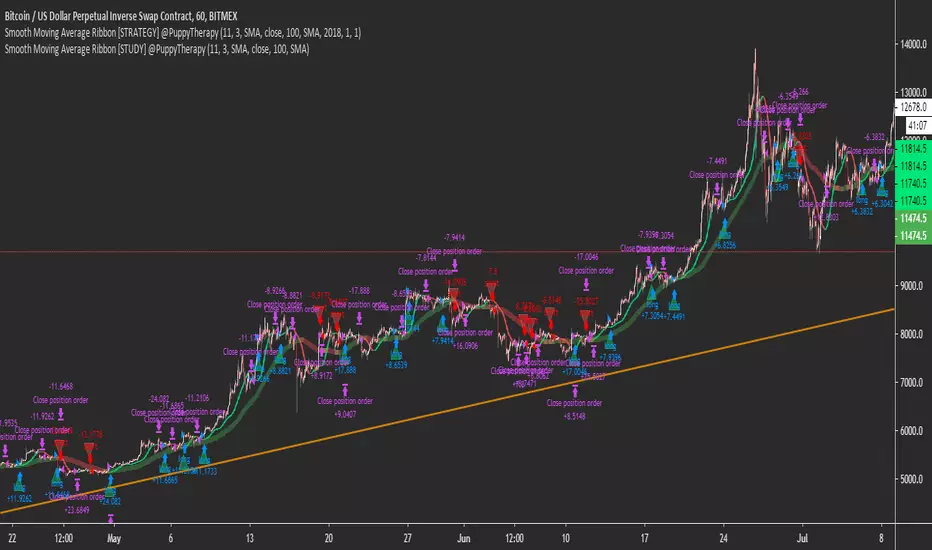
Smooth Moving Average Ribbon [STRATEGY] @PuppyTherapyThe Smooth moving average ribbon script is an enhancement of the script I posted yesterday. But will help you also create a very simple trend-following strategy or a simple trend-following filter.
You are able to select from a large variety of moving averages add Heikin Ashi Candles as a source and also add additional smoothing to every single of the moving averages.
The Strategy is using the basic backtesting engine.
It is a showcase that a simple strategy like buy when we going up and sell when we going down actually works especially on a bigger timeframe.
Thanks to all supporters and everget for some of the moving average scripts.
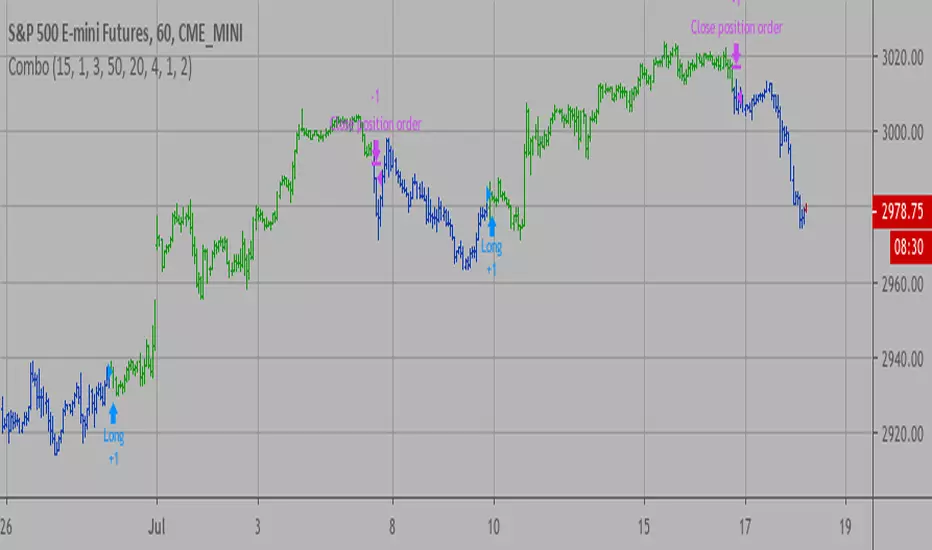
Smooth Moving Average [STRATEGY] @PuppyTherapyThe Smooth moving average script combo combines the ability to help you create a very simple trend-following strategy or a simple trend-following filter.
You are able to select from a large variety of moving averages add Heikin Ashi Candles as a source and also add additional smoothing to every single of the moving averages.
The Strategy is using the Tradingview backtesting framework.
It is a showcase that a simple strategy like buy when we going up and sell when we going down actually works especially on a bigger timeframe.
Thanks to all supporters and everget for some of the moving average scripts.

Combo Backtest 123 Reversal & Center Of Gravity This is combo strategies for get a cumulative signal.
First strategy
This System was created from the Book "How I Tripled My Money In The
Futures Market" by Ulf Jensen, Page 183. This is reverse type of strategies.
The strategy buys at market, if close price is higher than the previous close
during 2 days and the meaning of 9-days Stochastic Slow Oscillator is lower than 50.
The strategy sells at market, if close price is lower than the previous close price
during 2 days and the meaning of 9-days Stochastic Fast Oscillator is higher than 50.
Second strategy
The indicator is based on moving averages. On the basis of these, the
"center" of the price is calculated, and price channels are also constructed,
which act as corridors for the asset quotations.
WARNING:
- For purpose educate only
- This script to change bars colors.
Combo Strategy 123 Reversal & CCI This is combo strategies for get a cumulative signal.
First strategy
This System was created from the Book "How I Tripled My Money In The
Futures Market" by Ulf Jensen, Page 183. This is reverse type of strategies.
The strategy buys at market, if close price is higher than the previous close
during 2 days and the meaning of 9-days Stochastic Slow Oscillator is lower than 50.
The strategy sells at market, if close price is lower than the previous close price
during 2 days and the meaning of 9-days Stochastic Fast Oscillator is higher than 50.
Second strategy
The Commodity Channel Index (CCI) is best used with markets that display cyclical or
seasonal characteristics, and is formulated to detect the beginning and ending of these
cycles by incorporating a moving average together with a divisor that reflects both possible
and actual trading ranges. The final index measures the deviation from normal, which indicates
major changes in market trend.
To put it simply, the Commodity Channel Index (CCI) value shows how the instrument is trading
relative to its mean (average) price. When the CCI value is high, it means that the prices are
high compared to the average price; when the CCI value is down, it means that the prices are low
compared to the average price. The CCI value usually does not fall outside the -300 to 300 range
and, in fact, is usually in the -100 to 100 range.
WARNING:
- For purpose educate only
- This script to change bars colors.

Combo Backtest 123 Reversal & Bull Power This is combo strategies for get a cumulative signal.
First strategy
This System was created from the Book "How I Tripled My Money In The
Futures Market" by Ulf Jensen, Page 183. This is reverse type of strategies.
The strategy buys at market, if close price is higher than the previous close
during 2 days and the meaning of 9-days Stochastic Slow Oscillator is lower than 50.
The strategy sells at market, if close price is lower than the previous close price
during 2 days and the meaning of 9-days Stochastic Fast Oscillator is higher than 50.
Second strategy
Bull Power Indicator
To get more information please see "Bull And Bear Balance Indicator"
by Vadim Gimelfarb.
WARNING:
- For purpose educate only
- This script to change bars colors.

[M10] Quad MA Trend ScalperFour adjustable moving averages set in order to produce buy and sell signals, works best on smaller timeframes from my backtesting, 10M - 30M seems optimal for scalping.
The idea behind this script is to only enter positions that are following the trend in order to minimise drawdown and decrease risk when using leverage.
The script will only enter long positions when MA crossover occurs above the Long MA 2.
The script will exit a long position when MA Short crosses below Long MA 1.
The script will only enter short positions when MA cross under occurs below the Long MA 2.
The script will exit a short position when MA Short crosses below Long MA 1.
MACD/EMA/SMA/Ichimoku Confluence StrategyThis strategy uses a number of chart indicators to provide a Bullish/Bearish signal. Using a combination of the 200 SMA, the 20 EMA, the MACD and the Ichimoku cloud, the strategy logic will adjust the amount of confluence required between the indicators depending on how bullish or bearish the chart is looking. The logic looks for the following:
- Are we above or below the 200 SMA?
- Are we above or below the 20 EMA?
- Have we had a bullish MACD cross?
- Where are we in relation to the Ichimoku cloud?
If the coin is below the 200 SMA, then the strategy will only give a buy signal if the coin closes a candle above the 20 EMA AND the MACD is bullish and either the Ichimoku cloud is green, or the coin is above the Ichimoku cloud (regardless of colour).
If the coin is above the 200 SMA, Then the strategy will give a buy signal if the coin closes a candle above the 20 EMA AND the MACD is bullish and the coin is either IN the cloud (not necessarily above it) or the cloud is green.
The reverse is true for a sell signal, i.e. when the coin is above the 200 SMA it must close a candle below the Ichimoku cloud and be bearish in relation to the 20 EMA and MACD. If it is below the 200 SMA, then the strategy will give a sell signal if the the EMA/MACD conditions are true and the coin enters the cloud.
This strategy gives a fairly conservative signal for entry and exit points, but is fairly successful across a number of time frames, both short term and long term. As with all my strategies, I only include LONG entries and closes, not SHORT entries (as I find they make for inaccurate backtesting).
Please feel free to like, share, critique and suggest any improvements to this strategy. All feedback, positive and negative, is appreciated.

Combo Backtest 123 Reversal & Breakout Range Long This is combo strategies for get a cumulative signal.
First strategy
This System was created from the Book "How I Tripled My Money In The
Futures Market" by Ulf Jensen, Page 183. This is reverse type of strategies.
The strategy buys at market, if close price is higher than the previous close
during 2 days and the meaning of 9-days Stochastic Slow Oscillator is lower than 50.
The strategy sells at market, if close price is lower than the previous close price
during 2 days and the meaning of 9-days Stochastic Fast Oscillator is higher than 50.
Second strategy
Breakout Range Long Strategy
WARNING:
- For purpose educate only
- This script to change bars colors.

Ema BacktesterA simple, but useful script for backtesting purposes. Find the optimal Settings for your strategy.
tips are always welcome at: 38uGQJDDZDL6wX48x4gYTccPeQ3ZHVYmY4 (btc)
I hope you enjoy the script :)

Combo Backtest 123 Reversal & Bill Williams Averages. 3Lines This is combo strategies for get
a cumulative signal. Result signal will return 1 if two strategies
is long, -1 if all strategies is short and 0 if signals of strategies is not equal.
First strategy
This System was created from the Book "How I Tripled My Money In The
Futures Market" by Ulf Jensen, Page 183. This is reverse type of strategies.
The strategy buys at market, if close price is higher than the previous close
during 2 days and the meaning of 9-days Stochastic Slow Oscillator is lower than 50.
The strategy sells at market, if close price is lower than the previous close price
during 2 days and the meaning of 9-days Stochastic Fast Oscillator is higher than 50.
Second strategy
This indicator calculates 3 Moving Averages for default values of
13, 8 and 5 days, with displacement 8, 5 and 3 days: Median Price (High+Low/2).
The most popular method of interpreting a moving average is to compare
the relationship between a moving average of the security's price with
the security's price itself (or between several moving averages).
WARNING:
- For purpose educate only
- This script to change bars colors.

MACD Strategy With HistogramCombines MACD strategy for backtesting with a plotted histogram and orders

MACD Strategy with HistogramThis combines a strategy for backtesting with a plotted MACD graph and orders

QuantNomad - Pivot Reversal Strategy - XBTUSD - 1hPivot reversal strategy almost always works pretty good for crypto.
Here is setup with 4 left, 4 right bars for pivot points for XBTUSD 1h chart.
It shows a pretty nice performance of 350% with only 10% dd, Sharpe is 1.16.
If you're interested in using this strategy in my scripts you can find alerts for it and a version with added backtesting range.
And remember:
Past performance does not guarantee future results.

Three Line Break Backtest This is a modified version of the three line break price representation.
It is composed with 2 lines made of Close price values forming a “cloud”.
If the trend is bullish and the price breach the lower level of the green
cloud, a new bearish trend is taking place.
If the current trend is bearish and the price breakout the upper band of
the cloud, a new bullish trend is forming.
This is a “price action” indicator, signals may be filtered by long term trend
analysis with other indicators such as Supertrend for instance.
WARNING:
- For purpose educate only
- This script to change bars colors.

Combo Backtest 123 Reversal & Bear Power This is combo strategies for get
a cumulative signal. Result signal will return 1 if two strategies
is long, -1 if all strategies is short and 0 if signals of strategies is not equal.
First strategy
This System was created from the Book "How I Tripled My Money In The
Futures Market" by Ulf Jensen, Page 183. This is reverse type of strategies.
The strategy buys at market, if close price is higher than the previous close
during 2 days and the meaning of 9-days Stochastic Slow Oscillator is lower than 50.
The strategy sells at market, if close price is lower than the previous close price
during 2 days and the meaning of 9-days Stochastic Fast Oscillator is higher than 50.
Second strategy
Bear Power Indicator
To get more information please see "Bull And Bear Balance Indicator"
by Vadim Gimelfarb.
WARNING:
- For purpose educate only
- This script to change bars colors.
