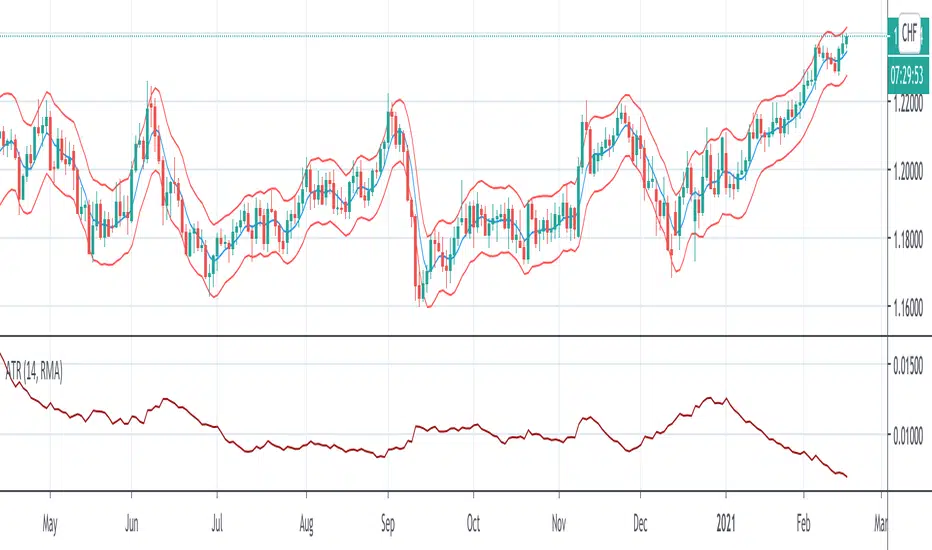
34 EMA BandsThis is quite a simple script, just plotting a 34EMA on high's and low's of candles. Appears to work wonders though, so here it is.
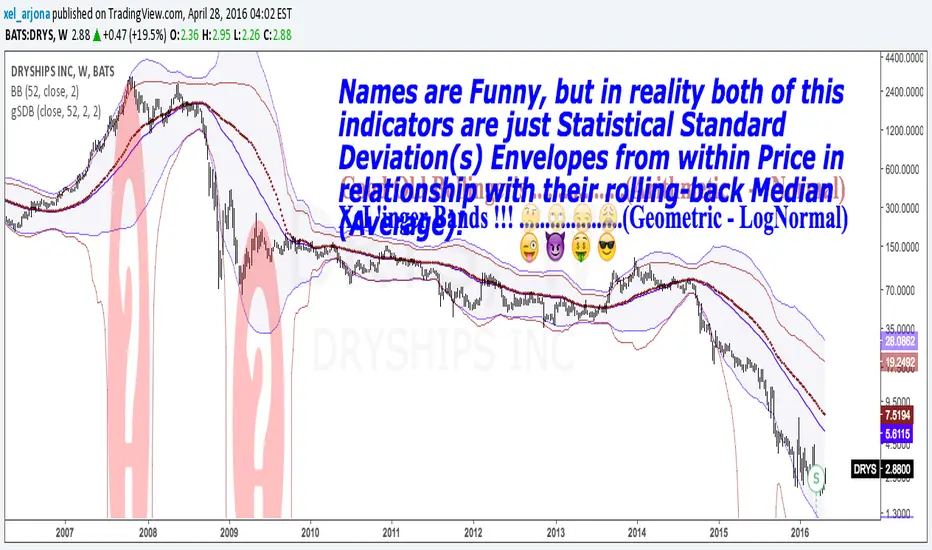
There is some //'d code which I haven't finished working on, but it looks to be quite similar to Bollinger Bands, just using different math rather than standard deviations from the mean.
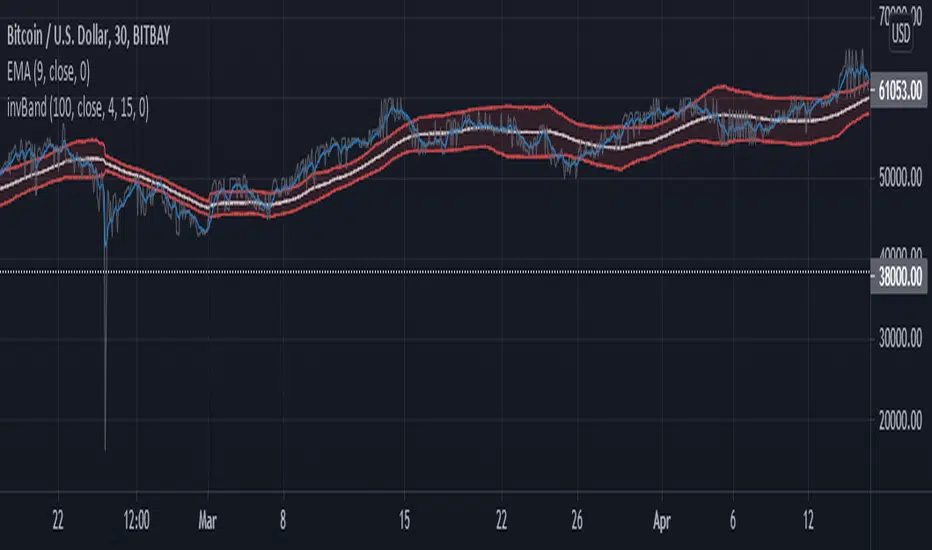
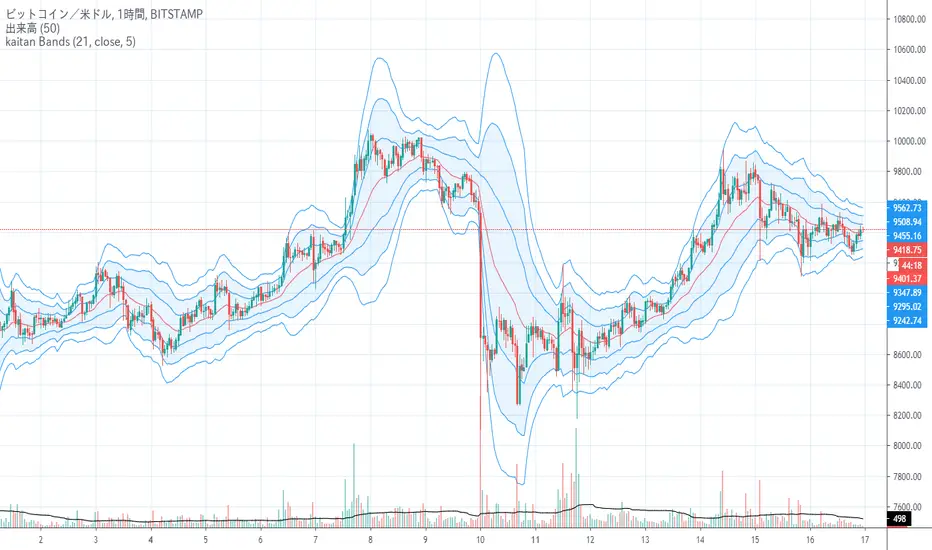
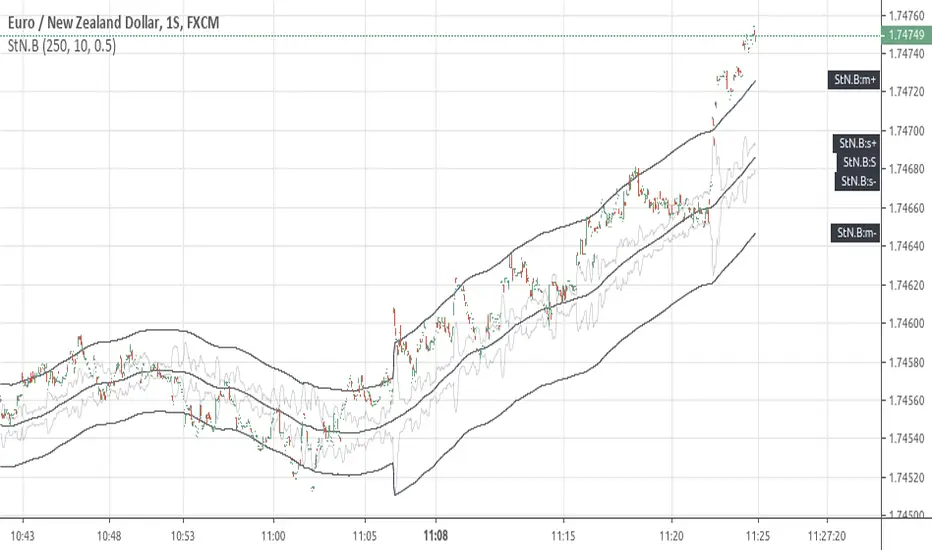
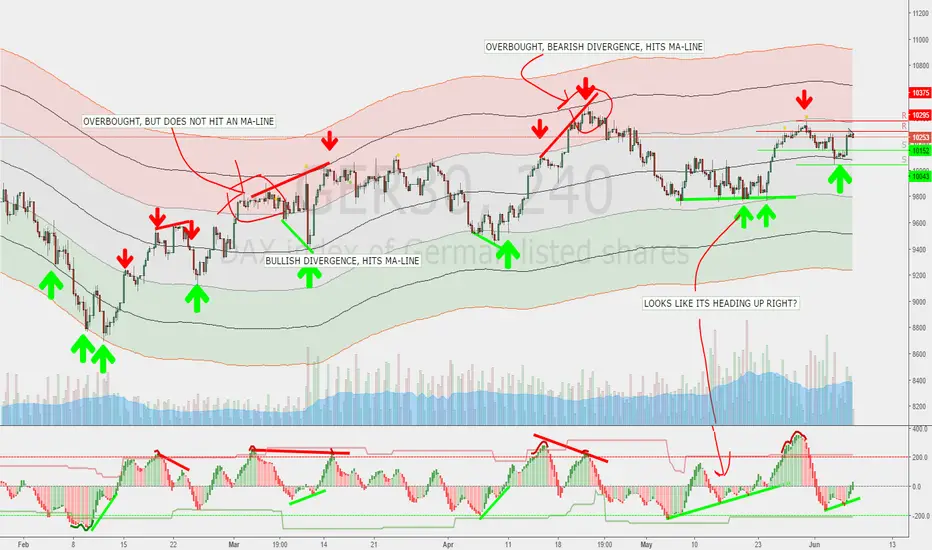
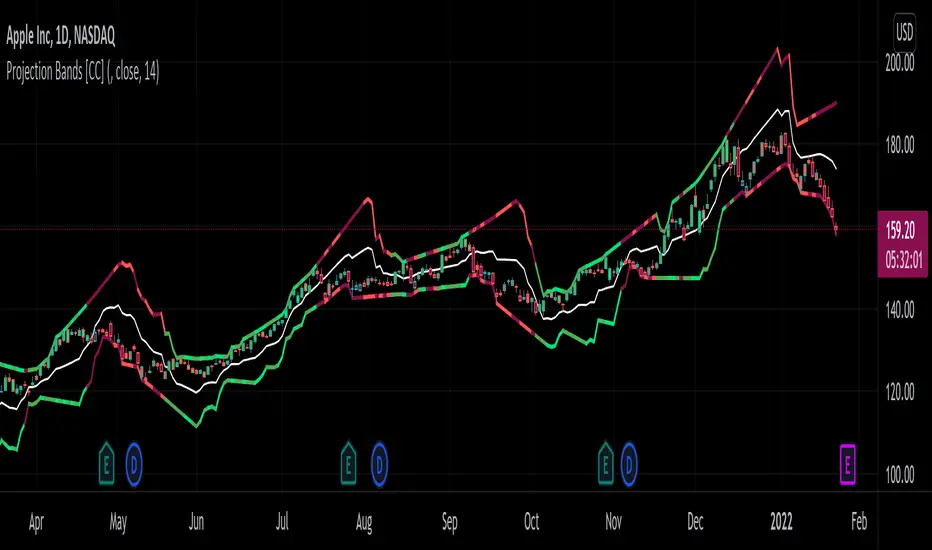
The bands itself is pretty self explanatory, price likes to use it as resistance when under it, it can trade inside it and it can use the upper EMA as support when in a strong upward trend.
Chỉ báo Pine Script®