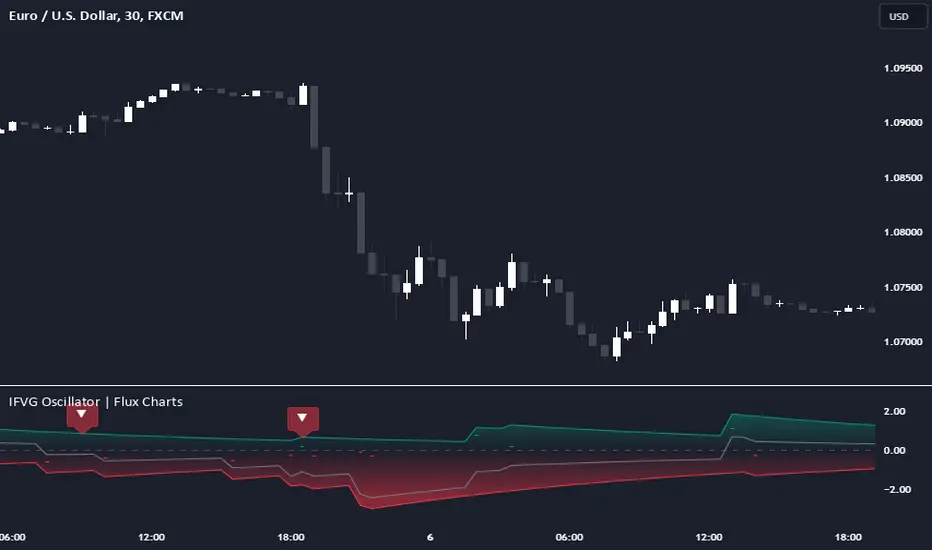
Inversion Fair Value Gap Oscillator | Flux Charts💎 GENERAL OVERVIEW
Introducing the new Inversion Fair Value Gap Oscillator (IFVG Oscillator) indicator! This unique indicator identifies and tracks Inversion Fair Value Gaps (IFVGs) in price action, presenting them in an oscillator format to reveal market momentum based on IFVG strength. It highlights bullish and bearish IFVGs while enabling traders to adjust detection sensitivity and apply volume and ATR-based filters for more precise setups. For more information about the process, check the "📌 HOW DOES IT WORK" section.
Features of the new IFVG Oscillator:
Fully Customizable FVG & IFVG Detection
An Oscillator Approach To IFVGs
Divergence Markers For Potential Reversals
Alerts For Divergence Labels
Customizable Styling
📌 HOW DOES IT WORK?
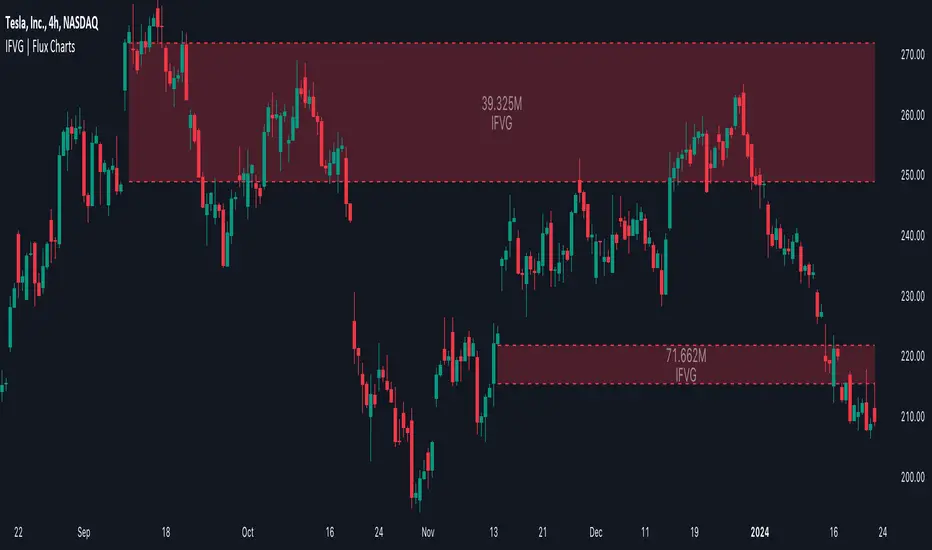
Fair Value Gaps are price gaps within bars that indicate inefficiencies, often filled as the market retraces. An Inversion Fair Value Gap is created in the opposite direction once a FVG gets invalidated. The IFVG Oscillator scans historical bars to identify these gaps, then filters them based on ATR or volume. Each IFVG is marked as bullish or bearish according to the opposite direction of the original FVG that got invalidated.
An oscillator is calculated using recent IFVGs with this formula :
1. The Oscillator starts as 0.
2. When a new IFVG Appears, it contributes (IFVG Width / ATR) to the oscillator of the corresponding type.
3. Each confirmed bar, the oscillator is recalculated as OSC = OSC * (1 - Decay Coefficient)
The oscillator aggregates and decays past IFVGs, allowing recent IFVG activity to dominate the signal. This approach emphasizes current market momentum, with oscillations moving bullish or bearish based on IFVG intensity. Divergences are marked where IFVG oscillations suggest potential reversals. Bullish Divergence conditions are as follows :
1. The current candlestick low must be the lowest of last 25 bars.
2. Net Oscillator (Shown in gray line by default) must be > 0.
3. The current Bullish IFVG Oscillator value should be no more than 0.1 below the highest value from the last 25 bars.
Traders can use divergence signals to get an idea of potential reversals, and use the Net IFVG Oscillator as a trend following marker.
🚩 UNIQUENESS
The Inversion Fair Value Gap Oscillator stands out by converting IFVG activity into an oscillator format, providing a momentum-based visualization of IFVGs that reveals market sentiment dynamically. Unlike traditional indicators that statically mark IFVG zones, the oscillator decays older IFVGs over time, showing only the most recent, relevant activity. This approach allows for real-time insight into market conditions and potential reversals based on oscillating IFVG strength, making it both intuitive and powerful for momentum trading.
Another unique feature is the combination of customizable ATR and volume filters, letting traders adapt the indicator to match their strategy and market type. You can also set-up alerts for bullish & bearish divergences.
⚙️ SETTINGS
1. General Configuration
Decay Coefficient -> The decay coefficient for oscillators. Increasing this setting will result in oscillators giving the weight to recent IFVGs, while decreasing it will distribute the weight equally to the past and recent IFVGs.
2. Fair Value Gaps
Zone Invalidation -> Select between Wick & Close price for FVG Zone Invalidation.
Zone Filtering -> With "Average Range" selected, algorithm will find FVG zones in comparison with average range of last bars in the chart. With the "Volume Threshold" option, you may select a Volume Threshold % to spot FVGs with a larger total volume than average.
FVG Detection -> With the "Same Type" option, all 3 bars that formed the FVG should be the same type. (Bullish / Bearish). If the "All" option is selected, bar types may vary between Bullish / Bearish.
Detection Sensitivity -> You may select between Low, Normal or High FVG detection sensitivity. This will essentially determine the size of the spotted FVGs, with lower sensitivies resulting in spotting bigger FVGs, and higher sensitivies resulting in spotting all sizes of FVGs.
3. Inversion Fair Value Gaps
Zone Invalidation -> Select between Wick & Close price for IFVG Zone Invalidation.
4. Style
Divergence Labels On -> You can switch divergence labels to show up on the chart or the oscillator plot.
Chỉ báo Pine Script®