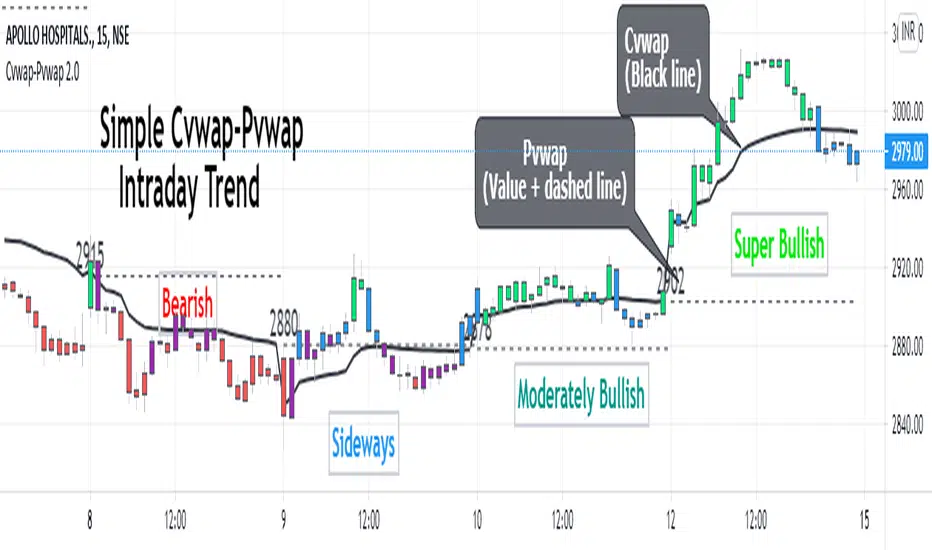
Cvwap-Pvwap 2.0A simple vwap based Intraday trend indicator.
Volume-Weighted Average Price (VWAP) - the average price weighted by volume, starts when trading opens and ends when it closes. This can help institutions buy or sell in large orders, without disturbing the market.
After buying or selling, institutions compare instrument price to closing VWAP values at end of the day.
For big financial institutions;
A buy order executed below the VWAP value, considered a good fill because the security was bought at a below average price.
A sell order executed above the VWAP would be deemed a good fill because it was sold at an above average price.
Simple price based moving average is not helpful for them; = as it doesn't incorporates volume traded. Hence - VWAP :)
So how it helps us in decoding the IntraDay-trend? - Through a 2 day vwap co-relation.
So, Closing value of previous day vwap = Pvwap
Today's running vwap = Cvwap
Defining the IntraDay Trend:
Moderately Bullish = candle closing price above Pvwap but below Cvwap
Super Bullish = Closing price is above both (Cvwap and Pvwap)
Moderately Bearish = Closing price is above Cvwap but below Pvwap
Super Bearish = Closing Price is below both (Cvwap and Pvwap)
A big gap between the Cvwap and the candle closing price defines the strong participation from institutions in that direction. (Strong Trend)
Moving with the smart money, in the overall trend is a wise decision for any intraday trader and this helps at its best.
Tìm kiếm tập lệnh với "order"
Arbitrage Sniper (POC)Good Morning Traders!
Today I want to share with you the proof-of-concept of how you would be able to do arbitrage with crypto pairs.
THE INDICATOR MUST BE PLACED ON THE TRADING PAIR OF THE TWO CURRENCIES (i.e. ETH/BTC, EOS/ETH etc.)
This arbitrage method is based on the transitional decorrelation between the crypto treding pair and the price ratio of the involved currencies, of course computing commissions as well.
Whenever the non-arbitrage condition is not respected, there is an arbitrage oportunity.
This indicator won't consider the chance of shorting, so if the arbitrage oportunity occurs the indicator will suggest you just the chance of buying the relative-undervalued currency (but inside the code you will know how to do the alternative method as well, by shorting the relative-overvalued currency)
Let's take the trading pair ETH/BTC (as in the graph) → if we assume commissions for the 0.075% of the order, the non-arbitrage condition will be presented like this
This arbitrage method will need three orders, so n=3
So let's assume that P(ETH)/(P(BTC)*P(ETH/BTC))>(1-0.075)^(-3) → it means that the price of Ethereum is currently overreated enough (relatively to the trading pair) for doing arbitrage.
We have two alternatives:
• Buy BTC, change it into ETH (by "buying" ETH in the trading pair ETH/BTC) and then sell ETH
• Sell ETH, buy BTC, change it into ETH (by "buying" ETH in the trading pair ETH/BTC)
On the other hand, if P(ETH)/(P(BTC)*P(ETH/BTC))<(1-0.075)^(-3) → it means that the price of Ethereum is currently underrared enough (relatively to the trading pair) for doing arbitrage.
We have two alternatives:
• Buy ETH, change it into BTC (by "selling" ETH in the trading pair ETH/BTC) and then sell BTC
• Sell BTC, buy ETH, change it into BTC (by "selling" ETH in the trading pair ETH/BTC)
I'm saying that is nothing more than a proof-of-concept since:
- Arbitrage Oportunities will emerge frequently just nearly zero commissions
- Data of prices are retrieved using security() function and there can be some delay (so the arbitrage oportunity will be already extinguished by the time the signal is retrieved)
- In order to have the freshest data, repiainting will occurr

KD compare strategy (交易策略對照組)This is a base and easy trading strategy for comparing my other strategy.
The strategy consider K >= 80 is strong target in the last high period,
and consider K <=20 is the weak target in the last low period.
In the strong target, the strategy may increase long at the first day when K < 50, until 2/3 max order limitation or strong target become to weak.
In the weak target, the strategy may increase short at the first day when K > 50, until 2/3 max order limitation or strong target become to strong.
there are three orders for this strategy.
when the strong become to weak, it may use the remain 1/3 to save itself, and change the direction at the next k > 50
when the weak become to weak, it may use the remain 1/3 to save itself, and change the direction at the next k < 50
這是一個簡單的雙向交易策略,用來對照我其他的策略。
當 K>=80 它會認為目前是強勢股,偏多操作
當 K<=20 它會認為目前是強勢股,偏空操作
當標的為強勢股時,當第一次 K<50 會加碼多單,最多買進2/3的持股,直到轉弱
當標的為弱勢股時,當第一次 K>50 會加碼空單,最多買進2/3的持股,直到轉強
當強勢轉弱勢時,會使用剩下的1/3來拯救持股,在下次 k > 50 出清持股
當弱勢轉強勢時,會使用剩下的1/3來拯救持股,在下次 k < 50 出清持股
Robot WhiteBox ChannelPrice Channel
The strategy uses the price channel indicator. In the chart, the price channel is displayed in black lines. Offset 1 candle to the right for clarity. The red line is the middle of the price channel.
Trading
You must use market stop orders.
If the price is higher than the top black line, open the long position (and close the short position)
If the price is lower than the lower black line, open the short position (and close the long position)
If the price has returned to the middle of the price channel (red line) - it is necessary to close any position.
You can disable the stop-loss orders. It will be a reverse-trading system.
For
- BTC/USD, XBT/USD, ETH/USD, etc (Do not use ANY/BTC symbols!)
- Timeframes: 1h, 4h, 1d

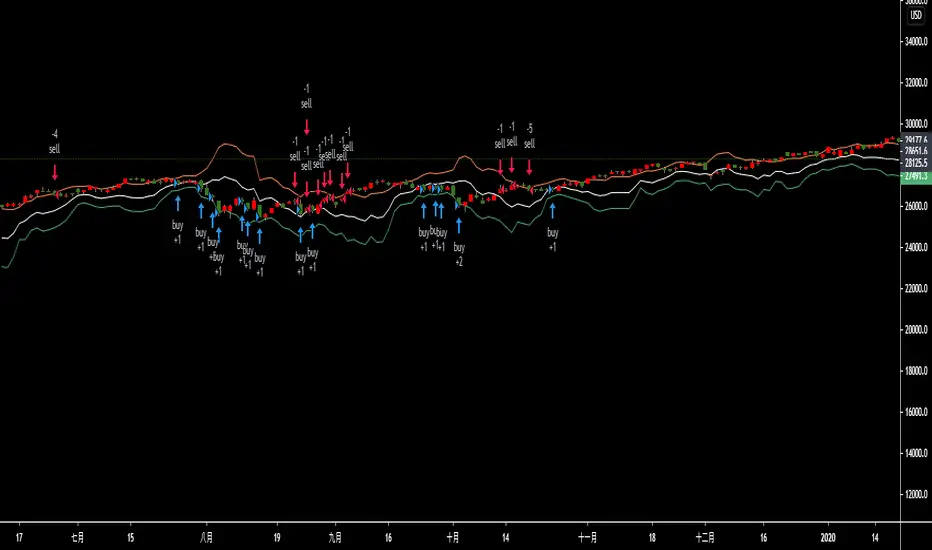
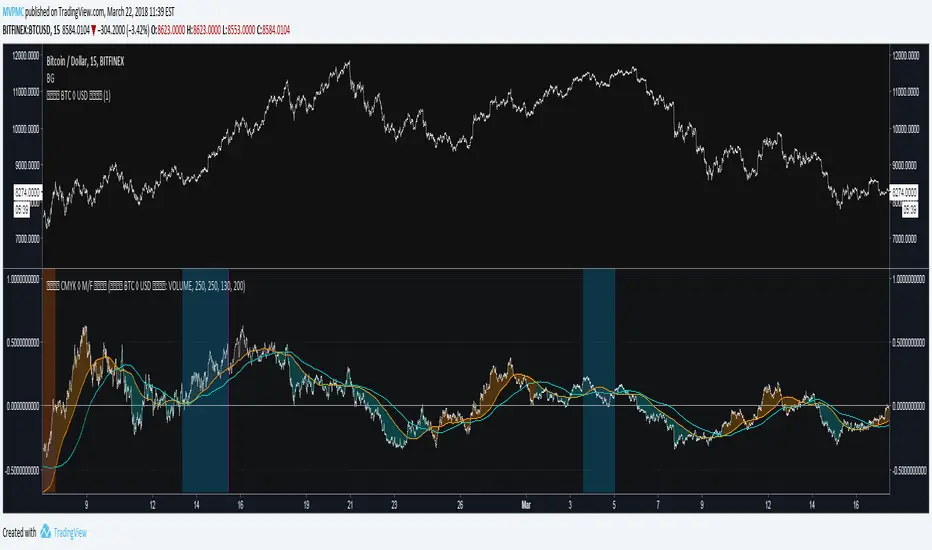
CMYK MOVEMENT / FORCE ◊ Introduction
Price Movement / Force
A script that uses Volume and price movement to indicate Bullish/Bearish momentum, like a hindsight MACD.
◊ Origin
This is a part of Project XIAM.
◊ Theoretical Approach
Philosophy γ :: consequential
◊ Usage
Early Indication of Bullish/Bearish momentum, before price reversal.
CLEANSIGNAL can be used as input source, for more reliable results.
Currently BTC◊USD ETH◊USD XRP◊USD Are available in my scripts.
Otherwise the ticker's volume is used as input.
My own indicators will be updated soon, to include source selection in their settings.
◊ Features
BULL / BEAR Phase to open orders. ( HINT : combine with RSI ? )
EXIT sweep : to find appropriate exit moments, to close opened orders.
Sweep is muffled if Phase continues.
Sweep Finalize send final EXIT signal.
◊ Community
Wanna share your findings ? or need help resolving a problem ?
CMYK :: discord.gg
AUTOVIEW :: discordapp.com
TRADINGVIEW UNOFFICIAL :: discord.gg
Gold/Silver 30m Only Strategy Buy/Sell SignalsIn my free time I felt like coding this strategy, and after backtesting it, it appears that the 30m time frame is the most profitable.
I only have been working on it for gold, but it should work similarly for silver as well.
This includes no pyramiding, and with pyramiding orders of 5, this strategy is upwards of 100% profitable.
Buy order - when price is above the 162 day EMA and RSI is less than 35
Sell order - when price is below the 162 day EMA and RSI is greater than 65
I will probably be adjusting it to increase the profitability and %success rate.

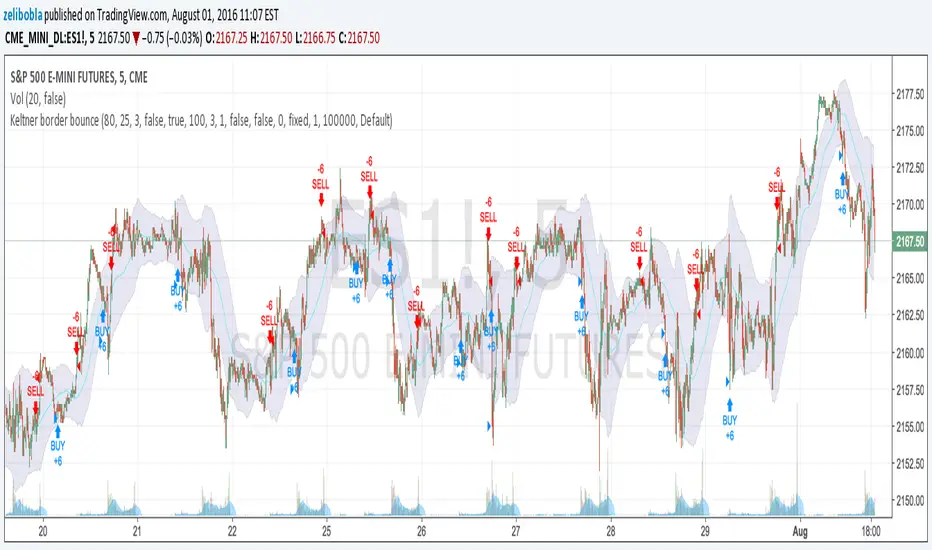
Keltner bounce from border. No repaint. V2 (by Zelibobla)WARNING: despite of strategy doesn't use future data (not repaints) it doesn't consider broker`s commissions, which can be harmful for real life high frequency trading. Strategy will definitely fail on non-ordinary security behavior. But if new behavior will get stable, tuned params should make strategy profitable again.
This is the second version of this strategy
I've added emergency stop-loss ordering, parametrized trade size and enabled to switch strategy entry mode. Now it looks good on bigger timeframes such as 5min (ES1!) on screenshot. You are welcome to bring new ideas to enhance performance.
How to automate this strategy for free using a chrome extension.Hey everyone,
Recently we developed a chrome extension for automating TradingView strategies using the alerts they provide. Initially we were charging a monthly fee for the extension, but we have now decided to make it FREE for everyone. So to display the power of automating strategies via TradingView, we figured we would also provide a profitable strategy along with the custom alert script and commands for the alerts so you can easily cut and paste to begin trading for profit while you sleep.
Step 1:
You are going to need to download the Chrome Extension called AutoView. You can get the extension for free by following this link: bit.ly ( I had to shorten the link as it contains Google and TV automatically converts it to a symbol)
Step 2: Go to your chrome extension page, and under the new extension you'll see a "settings" button. In the setting you will have to connect and give permission to the exchange 1broker allowing the extension to place your orders automatically when triggered by an alert.
Step 3: Setup the strategy and custom script for the alerts in TradingView. The attached script is the strategy, you can play with the settings yourself to try and get better numbers/performance if you please.
This following script is for the custom alerts:
//@version=2
study("4All-Alert", shorttitle="Alerts")
src = close
len = input(4, minval=1, title="Length")
up = rma(max(change(src), 0), len)
down = rma(-min(change(src), 0), len)
rsi = down == 0 ? 100 : up == 0 ? 0 : 100 - (100 / (1 + up / down))
rsin = input(5)
sn = 100 - rsin
ln = 0 + rsin
short = crossover(rsi, sn) ? 1 : 0
long = crossunder(rsi, ln) ? 1 : 0
plot(long, "Long", color=green)
plot(short, "Short", color=red)
Now that you have the extension installed, the custom strategy and alert scripts in place, you simply need to create the alerts.
To get the alerts to communicate with the extension properly, there is a specific syntax that you will need to put in the message of the alert. You can find more details about the syntax here : gist.github.com
For this specific strategy, I use the Alerts script, long/short greater than 0.9 on close.
In the message for a long place this as your message:
Long
c=order b=short
c=position b=short l=200 t=market
b=long q=0.01 l=200 t=market tp=13 sl=25
and for the short...
Short
c=order b=long
c=position b=long l=200 t=market
b=short q=0.01 l=200 t=market tp=13 sl=25
If you'll notice in my above messages, compared to the strategy my tp and sl (take profit and stop loss) vary by a few pips. This is to cover the market opens and spread on 1broker. You can change the tp and sl in the strategy to the above and see that the overall profit will not vary much at all.
I hope this all makes sense and it is enough to not only make some people money, but to show the power of coming up with your own strategy and automating it using TradingView alerts and the free Chrome Extension AutoView.
ps. I highly recommend upgrading your TradingView account so you have access to back testing and multiple alerts.
There is really no reason you won't cover the cost and then some on a monthly basis using the tools provided.
Best of luck and happy trading.
Note: The extension currently allows for automation on 2 exchanges; 1broker and Okcoin. If you do not have accounts there, we'd appreciate you signing up using our referral links.
www.okcoin.com
1broker.com

Moving Average Trend Strategy V2.1 — With Stop Loss and Add Posi**Strategy Feature Description:**
---
### **Entry Logic:**
* When **MA7** crosses **MA15**, and the distance between **MA15** and **MA99** is less than **0.5%**
* When **MA15** crosses **MA99**, and the distance between **MA7** and **MA15** is less than **0.5%**
* When the distance among all three MAs (**MA7**, **MA15**, **MA99**) is less than **0.5%** (adjustable via parameters)
---
### **Capital Management:**
* Initial capital: **$100**
* Each position uses **15%** of total capital
* Opens **both long and short positions simultaneously** (dual-direction mode)
---
### **Risk Control:**
* **Long position stop-loss:** Entry price − 2%
* **Short position stop-loss:** Entry price + 2%
* Uses a **five-level take-profit grid**:
* Every 5% profit → close 20% of position
* Any pending take-profit orders are automatically canceled when stop-loss triggers
---
### **Visualization Features:**
* Real-time display of the three moving averages
* Chart annotations for entry signal points
* All trade signals and performance can be viewed through **TradingView backtest reports**
---
### **Notes:**
* Parameters can be adjusted based on the volatility of the instrument (historical backtesting is recommended first)
* Dual-direction positions may generate **hedging costs** — recommended for low-fee markets
* Real trading must consider **exchange minimum order size limits**
* Suggest enabling a **volume filter mechanism** (extension interface already reserved)
* Always perform **historical backtesting and parameter optimization** in TradingView before connecting to live trading systems

Previous Day & Week High/Low LevelsPrevious Day & Week High/Low Levels is a precision tool designed to help traders easily identify the most relevant price levels that often act as strong support or resistance areas in the market. It automatically plots the previous day’s and week’s highs and lows, as well as the current day’s developing internal high and low. These levels are crucial reference points for intraday, swing, and even position traders who rely on price action and liquidity behavior.
Key Features
Previous Day High/Low:
The indicator automatically draws horizontal lines marking the highest and lowest prices from the previous trading day.
These levels are widely recognized as potential zones where the market may react again — either rejecting or breaking through them.
Previous Week High/Low:
The script also tracks and displays the high and low from the last completed trading week.
Weekly levels tend to represent stronger liquidity pools and broader institutional zones, which makes them especially important when aligning higher timeframe context with lower timeframe entries.
Internal Daily High/Low (Real-Time Tracking):
While the day progresses, the indicator dynamically updates the current day’s internal high and low.
This allows traders to visualize developing market structure, identify intraday ranges, and anticipate potential breakouts or liquidity sweeps.
Multi-Timeframe Consistency:
All levels — daily and weekly — remain visible across any chart timeframe, from 1 minute to 1 day or higher.
This ensures traders can maintain perspective and avoid losing track of key zones when switching views.
Customizable Visuals:
The colors, line thickness, and label visibility can be easily adjusted to match personal charting preferences.
This makes the indicator adaptable to any trading style or layout, whether minimalistic or detailed.
How to Use
Identify Key Reaction Zones:
Observe how price interacts with the previous day and week levels. Rejections, consolidations, or clean breakouts around these lines often signal strong liquidity areas or potential directional moves.
Combine with Market Structure or Liquidity Concepts:
The indicator works perfectly with supply and demand analysis, liquidity sweeps, order block strategies, or simply classic support/resistance techniques.
Scalping and Intraday Trading:
On lower timeframes (1m–15m), the daily levels help identify intraday turning points.
On higher timeframes (1h–4h or daily), the weekly levels provide broader context and directional bias.
Risk Management and Planning:
Using these levels as reference points allows for more precise stop placement, target setting, and overall trade management.
Why This Indicator Helps
Markets often react strongly around previous highs and lows because these zones contain trapped liquidity, pending orders, or institutional decision points.
By having these areas automatically mapped out, traders gain a clear and objective view of where price is likely to respond — without needing to manually draw lines every day or week.
Whether you’re a beginner still learning about price structure, or an advanced trader refining entries within liquidity zones, this tool simplifies the process and keeps your charts clean, consistent, and data-driven.

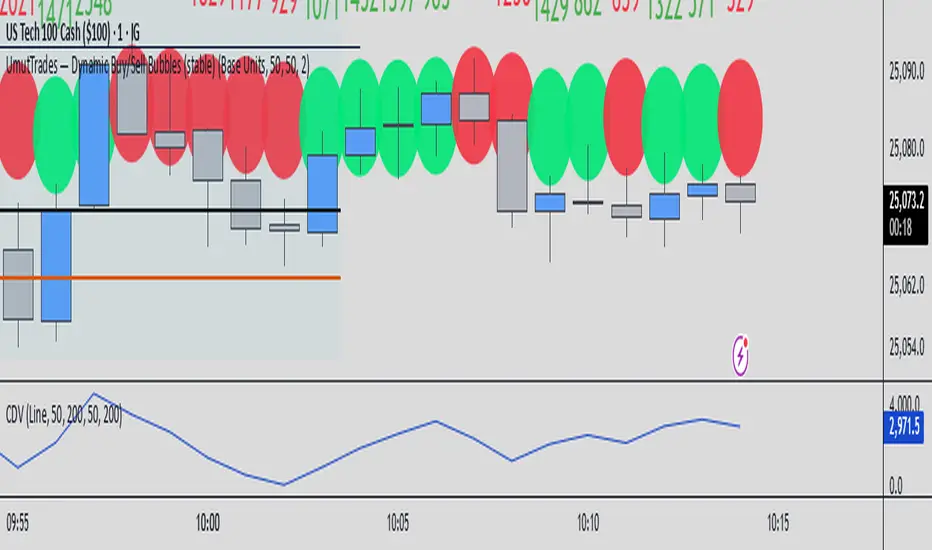
UmutTrades — Dynamic Buy/Sell Bubbles (stable)This indicator detects large buy and sell transactions based on user-defined thresholds (either in base units or quote value).
It places colored bubbles on the chart where those big orders occur green for buys and red for sells with the bubble’s color intensity and size reflecting how large the order is relative to your threshold.
50% Fib Trend Cloud + ATR BandsThis indicator plots two structural 50% fibonacci midpoints from recent confirmed 'left/right' swings that form a *cloud* of equilibrium, then adds a rolling 50% fibonacci range midpoint based on a lookback window that's wrapped in ATR bands. Importantly, it solves a specific trading problem:
Structural midpoints (macro context) are powerful but can lag when price escapes prior ranges. Enter rolling 50% fib + ATR ➡️ which restores real-time balance & tolerance (micro context). Together they show where price is balanced structurally, where it’s balanced right now, and how much volatility to tolerate before acting.
➖➖➖
🔑 Why this is different
Most tools either draw a single midpoint (ex., daily 50%) or ATR bands around a moving average. This script fuses dual swing-based 50% midpoints (structure) + a rolling 50% with ATR (flow), so you don’t lose context when price escapes prior ranges. The cloud tells you who’s in control (fast vs. slow structure). The rolling 50% + ATR tells you how far is “too far” now.
➖➖➖
🧠 What it does (at a glance)
🔸Structural Equilibrium × 2 (Fib1/Fib2)
Two independent 50% midpoints formed from swing pivots (configurable Left/Right bars + optional smoothing). Their gap is the Midpoint Cloud = structural “fair value” zone.
🔸Rolling 50% + ATR Bands
A rolling highest/lowest window computes an always-current 50% rolling midpoint plot; ±ATR × length envelopes define a soft value area and over-stretch boundaries.
🔸Actionable Visuals
Optional fill between Fib1/Fib2, labels, and candle-overlay modes to instantly read regime (above both / below both / between).
🔸Smart Defaults
Timeframe-aware presets for L/R pivots & smoothing; full manual overrides available.
➖➖➖
⚙️ Calculations (plain-English)
🔸Pivot midpoints (Fib1 & Fib2):
1) Detect a swing using `Left/Right` bars
2) Take the swing’s high/low → compute 50%
3) (Optional) Smooth the line (SMA) to stabilize on noisy TFs
4) Repeat with a different sensitivity to get two distinct midpoints
🔸Rolling midpoint:
Highest High / Lowest Low over the last *N* bars → (HH + LL) / 2
🔸ATR levels:
`Upper = Rolling50 + ATR × Mult`, `Lower = Rolling50 − ATR × Mult`
(Typical: ATR length 14–21; Multipliers 2.236 for L1, 5.382 for L2)
➖➖➖
🤖 Auto-Configured Presets (with Manual Override)
💡Goal: make the midpoints “just work” on common timeframes while still letting you dial them in.
💡How Auto Presets work
When Auto Presets = ON, the script picks sensible L/R/S (Left bars / Right bars / Smoothing) for Fib Trend 1 and Fib Trend 2 based on chart timeframe.
🔸Fib 1 (fast) emphasizes *micro-structure* for quicker bias shifts.
🔸Fib 2 (slow) emphasizes *macro-structure* for anchor/bias context.
These defaults keep Fib 1 responsive without jitter and Fib 2 stable without lag.
➡️ Turn Auto Presets = OFF to take full control with the manual inputs described below.
➖➖➖
🛠 Manual Fib Midpoint Settings (when Auto = OFF)
💡Each midpoint uses three knobs:
🔸Pivot Left (L): bars to the left that must be lower/higher to qualify a swing
🔸Pivot Right (R): bars to the right that must be lower/higher to confirm the swing
🔸Smoothing (S): SMA period applied to the raw 50% midpoint (stabilizes noise)
5-Minute optimized defaults
🔸Fib Trend 1: `L21 / R5 / S55` → responsive local structure (entries/exits, re-balancing zones)
🔸Fib Trend 2: `L55 / R13 / S89` → broader structure (trend context, anchors/stops)
Timeframe guidance
🔸1m–3m: may feel a touch laggy → consider ~`L13 / R3 / S34`
🔸15m–1h: defaults remain strong → optionally ~`L34 / R8 / S89`
🔸4h+ : increase span for stability → `L89–144 / R13–21 / S144–233`
➡️ Rule of thumb: shorter L/R = faster detection, longer S = smoother line. Tune until Fib 1 captures the “active swing” and Fib 2 captures the “dominant swing” without whipsaw.
➖➖➖
🎛 Inputs (quick reference)
🔸Fib Trend 1/2: Source (High/Low/Close), Left/Right bars, Smoothing length, Show/Hide, Cloud fill toggle
🔸Rolling 50%: Lookback length, Price basis (Wicks/Close/HLC3/OHLC4), Plot scope (Full / Last N / None)
🔸ATR Bands: ATR length, Multipliers (L1/L2), Plot scope, Line width/colors
🔸Overlay & Labels: Candle overlay mode, Label padding/size, 50% centerline toggle, Plot widths
➖➖➖
🖍️ Candle Coloring & Overlay Modes
💡Purpose: make trend instantly visible on the candles and ATR levels.
1) Color Logic (dropdown)
🔸 Fib Midpoints — Colors by position of price vs. Fib 1 & Fib 2
🔸ATR Zones — Colors by which ATR zone price is in relative to the Rolling 50%
➡️ Price Reference: Choose the input used for the decision (Close, HL2, OHLC3, OHLC4).
➡️Tip: Close is crisp; HL2/OHLC variants are smoother.
2) Overlay Style (dropdown)
🔸 None — No visual change to candles
🔸 Bar Color — Uses `barcolor()` to tint built-in candles (this takes into account your Trading View settings, for instance if you have wicks set to white, they will show up as white with this setting)
🔸 PlotCandles — Draws unified custom candles (body, wick, border) with the same color for maximum clarity
💡Practical use
🔸 Pick Fib Midpoints to read structural bias at a glance (above/below/between the cloud).
🔸 Pick ATR Zones to read value vs. stretch around the Rolling 50% (mean-reversion vs. trend extension).
➖➖➖
📘 How to use
A) Trend confirmation
- Strong bullish bias when price holds above both structural mids; strong bearish when below both.
- Use the Rolling 50% + ATR as a dynamic re-entry zone: pullbacks that respect ATR(L1) often continue the prevailing trend.
B) Transition / mean reversion
- Inside the Cloud (between Fib1 & Fib2) treat behavior as neutralization/re-balancing; range tactics tend to outperform momentum plays.
- In ranges, fades near ±ATR around the rolling 50% can mark short-term edges.
C) Breakout context
- When price leaves the Cloud, the Rolling 50% keeps you anchored so price never feels “floating.” A clean hold outside ATR(L1/L2) suggests regime strength; quick re-entries hint at traps.
➖➖➖
🖼 Chart examples
➡️ Each snapshot shows how the Cloud (structure) and the Rolling 50% + ATR (flow) work together.
1) 1-Minute Downtrend – Cloud as Dynamic Ceiling
- The Cloud slopes down; pullbacks repeatedly fail under the Cloud’s underside.
- Rolling 50% (dashed mid) + ATR(L1) act as a reversion band: rallies stall near upper ATR and rotate lower.
2) 15-Minute Persistent Drift – Structure Guides, Flow Times Entries
- Long drift lower with Cloud overhead.
- Consolidations near the rolling mid resolve in the trend direction; ATR bands frame risk on each attempt.
3) 15-Minute Uptrend (BTC) – From Cloud Escape to Value Stair-Step
- After escaping the prior Cloud, rolling 50% + ATR establish a new higher value area.
- Pullbacks into ATR(L1) produce orderly stair-steps; Cloud remains supportive on deeper dips
4) 5-Minute BTC – Pullback to Value then Rotate
- Strong leg up; retrace tags lower ATR band and rotates back toward the rolling mid.
- Labels (Fib1/Fib2) make the structural context explicit for decision-making.
➖➖➖
🧪 Starter presets
- Intraday (5–15m): Fib1 ~ L21/R5 (smooth 5), Fib2 ~ L55/R13 (smooth 9) • Rolling = 55 • ATR = 14 • L1 = 2.5x, L2 = 5.0x
- Scalping: Shorten lookbacks & smoothing; keep ATR multipliers similar, or tighten L1.
- Swing: Lengthen all lookbacks; consider ATR length 21–28.
➖➖➖
🏁Final Word
This script is not just a visual tool, it’s a complete trend and structure framework. Whether you're looking for clean trend alignment, dynamic support/resistance, or early warning signs of a reversal, this system is tuned to help you react with confidence — not hindsight.
Rembember, no single indicator should be used in isolation. For best results, combine it with price action analysis, higher-timeframe context, and complementary tools like trendlines, moving averages etc Use it as part of a well-rounded trading approach to confirm setups — not to define them alone.
---
💡Turn logic into clarity. Structure into trades. And uncertainty into confidence.

Twisted Forex's Doji + Area StrategyTitle
Twisted Forex’s Doji + Area Strategy
Description
What this strategy does
This strategy looks for doji candles forming inside or near supply/demand areas . Areas are built from swing pivots and sized with ATR, then tracked for retests (“confirmations”). When a doji prints close to an area and quality checks pass, the strategy places a trade with the stop beyond the doji and a configurable R:R target.
How areas (zones) are built
• Swings are detected with a user-set pivot length.
• Each swing spawns a horizontal area centered at the pivot price with half-height = zoneHalfATR × ATR .
• Duplicates are de-duplicated by center distance (ATR-scaled).
• Areas fade when broken beyond a buffer or after an optional age (expiry).
• Retests are recorded when price touches and then bounces away from the area; repeated reactions increase the zone’s “strength”.
Signal logic (summary)
Doji detection: strict or loose body criteria with optional minimum wick fractions and ATR-scaled minimum range.
Proximity: price must be inside/near a supply or demand area (proxATR × ATR).
Side resolution: overlap is resolved by (a) which side price penetrates more, (b) fast/slow EMA trend, or (c) nearest distance. Optional “previous candle flip” can bias long after a bearish candle and short after a bullish one.
Optional 1-bar confirmation: the bar after the doji must close away from the area by confirmATR × ATR .
Quality filter (Off/Soft/Strict): four checks—(i) wick rejection past the edge, (ii) doji closes in an edge “band” of the area, (iii) fresh touch (cooldown), (iv) approach impulse over a short lookback. In Strict , thresholds auto-tighten.
Orders & exits
• Long: stop below doji low minus buffer; Short: above doji high plus buffer.
• Target = rrMultiple × risk distance .
• Pyramiding is off by default.
Position sizing
You can size from the script or from Strategy Properties:
• Script-driven (default): set Position sizing = “Risk % of equity” and choose riskPercent (e.g., 1.0%). The script applies safe floors/rounding (FX micro-lots by default) so quantity never rounds to zero.
• Properties-driven : toggle Use TV Properties → Order size ON, then pick “Percent of equity” in Properties (e.g., 1%). The header includes safe defaults so trades still place.
Key inputs to explore
• Zone building : pivotLen, zoneHalfATR, minDepartureATR, expiryBars, breakATR, leftBars, dedupeATR.
• Doji & proximity : strictDoji, dojiBodyFrac, minWickFrac, minRangeATR, proxATR, minBarsBetween.
• Overlap resolution : usePenetration, useTrend (EMA 21/55), “previous candle flip”, needNextBarConf & confirmATR.
• Quality : qualityMode (Off/Soft/Strict), minQualPass/kStrict, wickPenATR, edgeBandFrac, approachLookback, approachMinATR, freshTouchBars.
• Zone strength gating : minStrengthSoft / minStrengthStrict.
• HTF confluence (optional) : useHTFTrend (HTF EMA 34/89) and/or useHTFZoneProx (HTF swing bands).
Tips to make it cleaner / higher quality
• Turn needNextBarConf ON and use confirmATR = 0.10–0.15 .
• Increase approachMinATR (e.g., 0.35–0.45) to require a stronger pre-touch impulse.
• Raise minStrengthSoft/Strict (e.g., 4–6) so only well-reacted zones can signal.
• Use signalsOnlyConfirmed ON if you prefer trades only from zones with retests (the script falls back gracefully when none exist yet).
• Nudge proxATR to 0.5–0.6 to demand tighter proximity to the level.
• Optional: enable useHTFTrend to filter counter-trend setups.
Default settings used in this publication
• Initial capital: 100,000 (illustrative).
• Slippage: 1 tick; Commission: 0% (you can raise commission if you prefer—spread is partly modeled by slippage).
• Sizing: Risk % of equity via inputs; riskPercent = 1.0% ; FX uses micro-lot floors by default.
• Quality: Off by default (Soft/Strict available).
• HTF trend gate: Off by default.
Backtesting notes
For a meaningful sample size, test on liquid symbols/timeframes that yield 100+ trades (e.g., majors on 5–15m over 1–2 years). Backtests are modelled and broker costs/spread vary—validate on your feed and forward-test.
How to read the chart
Shaded bands are supply (above) and demand (below). Brighter bands are the nearest K per side (visual aid). BUY/SELL labels mark entries; colored dots show entry/SL/TP levels. You can hide zones or unconfirmed zones for a cleaner view.
Disclaimer
This is educational material, not financial advice. Trading involves risk. Always test and size responsibly.

AMD [TakingProphets]Overview
The AMD indicator is a real-time, high-resolution tool designed for traders following ICT methodology who want a clear visualization of higher timeframe (HTF) candles directly on their lower timeframe charts.
It overlays current HTF structure, including open, high, low, and close projections, allowing traders to align intraday decisions with institutional price delivery — all without switching timeframes.
Concept & Background
In ICT concepts, market behavior often follows a pattern of accumulation, manipulation, and distribution. Understanding these phases is essential for anticipating when price is likely to expand or reverse.
AMD automates this process by:
-Overlaying HTF candles directly on your lower timeframe chart.
-Projecting live levels like the current open, high, low, and close to map out evolving bias.
-Helping traders see whether price is accumulating orders, engineering liquidity sweeps, or distributing aggressively.
Key Features
Live HTF Candle Overlay
-Displays the full HTF candle — body, wicks, and directional bias — on your active chart in real time.
-Perfect for traders aligning intraday setups with broader HTF context.
Dynamic HTF Price Projections
-Plots the evolving open, high, low, and close for the current HTF candle.
-Each projection can be customized by color, style, labels, and visibility to fit your workflow.
Full Customization Control
-Adjust candle body widths, wick styles, and transparency.
-Configure projection lines and time labels in both 12h and 24h formats.
-Includes an optional Info Box showing instrument, timeframe, and session context.
Session Timing & Labeling
-Smart timestamping marks the start and close of each HTF candle.
-Helps traders anticipate potential expansions or reversals during killzones or liquidity events.
How to Use It
Select Your HTF Context
-Choose any timeframe overlay (e.g., 1H, 4H, 1D) to match your trading model.
-Monitor Live HTF Levels
-Watch how price interacts with current HTF highs, lows, and equilibrium levels in real time.
-Integrate With ICT Concepts
-Use alongside tools like SMT divergence, Order Blocks, or Liquidity Levels for confirmation and context.
-Refine Intraday Entries
-Check whether price is expanding in your favor before entering positions.
Best Practices
Combine AMD with ICT killzone sessions to monitor HTF behavior during high-liquidity periods.
Use it alongside correlated SMT divergence tools for stronger directional bias confirmation.
Who It’s For
Scalpers anchoring quick entries to HTF sentiment.
Intraday traders syncing 5m/15m setups with 1H/4H context.
Swing traders monitoring HTF ranges without switching charts.
Educators & analysts needing clean visual overlays for teaching and content creation.
Why It’s Useful
AMD doesn’t provide trading signals or predictive guarantees. Instead, it offers a clean, structured view of HTF price delivery — enabling traders to understand institutional intent as it unfolds and manage their execution with greater confidence.

[Pandora][Swarm] Rapid Exponential Moving AverageENVISIONING POSSIBILITY
What is the theoretical pinnacle of possibility? The current state of algorithmic affairs falls far short of my aspirations for achievable feasibility. I'm lifting the lid off of Pandora's box once again, very publicly this time, as a brute force challenge to conventional 'wisdom'. The unfolding series of time mandates a transcendental systemic alteration...
THE MOVING AVERAGE ZOO:
The realm of digital signal processing for trading is filled with familiar antiquated filtering tools. Two families of filtration, being 'infinite impulse response' (EMA, RMA, etc.) and 'finite impulse response' (WMA, SMA, etc.), are prevalently employed without question. These filter types are the mules and donkeys of data analysis, broadly accepted for use in finance.
At first glance, they appear sufficient for most tasks, offering a basic straightforward way to reduce noise and highlight trends. Yet, beneath their simplistic facade lies a constellation of limitations and impediments, each having its own finicky quirks. Upon closer inspection, identifiable drawbacks render them far from ideal for many real-world applications in today's volatile markets.
KNOWN FUNDAMENTAL FLAWS:
Despite commonplace moving average (MA) popularity, these conventional filters suffer from an assortment of fundamental flaws. Most of them don't genuinely address core challenges of how to preserve the true dynamics of a signal while suppressing noise and retaining cutoff frequency compliance. Their simple cookie cutter structures make them ill-suited in actuality for dynamic market environments. In reality, they often trade one problem for another dilemma, forsaking analytics to choose between distortion and delay.
A deeper seeded issue remains within frequency compliance, how adequately a filter respects (or disrespects) the underlying signal’s spectral properties according to it's assigned periodic parameter. Traditional MAs habitually distort phase relationships, causing delayed reactions with surplus lag or exaggerations with excessive undershoot/overshoot. For applications requiring timely resilience, such as algorithmic trading, these shortcomings are often functionally unacceptable. What’s needed is vigorous filters that can more accurately retain signal behaviors while minimizing lag without sacrificing smoothness and uniformity. Until then, the public MA zoo remains as a collection of corny compromises, rather than a favorable toolbelt of solutions.
P.S.: In PSv7+, in my opinion, many of these geriatric MAs deserve no future with ease of access for the naive, simply not knowing these filters are most likely creating bigger problems than solving any.
R.E.M.A.
What is this? I prefer to think of it as the "radical EMA", definitely along my lines of a retire everything morte algorithm. This isn't your run of the mill average from the petting zoo. I would categorize it as a paradigm shifting rampant economic masochistic annihilator, sufficiently good enough to begin ruthlessly executing moving averages left and right. Um, yeah... that kind of moving average destructor as you may soon recognize with a few 'Filters+' settings adjustments, realizing ordinary EMA has been doing us an injustice all this time.
Does it possess the capability to relentlessly exterminate most averaging filters in existence? Well, it's about time we find out, by uncaging it on the loose into the greater economic wilderness. Only then can we truly find out if it is indeed a radical exponential market accelerant whose time has come. If it is, then it may eventually become a reality erasing monolithic anomaly destined for greatness, ultimately changing the entire landscape of trading in perpetuity.
UNLEASHING NEXT-GEN:
This lone next generation exoweapon algorithm is intended to initiate the transformative beginning stages of mass filtration deprecation. However, it won't be the only one, just the first arrival of it's alien kind from me. Welcome to notion #1 of my future filtration frontier, on this episode of the algorithmic twilight zone. Where reality takes a twisting turn one dimension beyond practical logic, after persistent models of mindset disintegrate into insignificance, followed by illusory perception confronted into cognitive dissonance.
An evolutionary path to genuine advancement resides outside the prison of preconceptions, manifesting only after divergence from persistent binding restrictions of dogmatic doctrines. Such a genesis in transformative thinking will catalyze unbounded cognitive potential, plowing the way for the cultivation of total redesigns of thought. Futuristic innovative breakthroughs demand the surrender of legacy and outmoded understandings.
Now that the world's largest assembly of investors has been ensembled, there are additional tasks left to perform. I'm compelled to deploy this mathematical-weapon of mass financial creation into it's rightful destined hands, to "WE THE PEOPLE" of TV.
SCRIPT INTENTION:
Deprecate anything and everything as any non-commercial member sees desirably fit. This includes your existing code formulations already in working functional modes of operation AND/OR future projects in the works. Swapping is nearly as simple as copying and pasting with meager modifications, after you have identified comparable likeness in this indicators settings with a visual assessment. Results may become eye opening, but only if you dare to look and test.
Where you may suspect a ta.filter() is lacking sufficient luster or may be flat out majorly deficient, employing rema, drema, trema, or qrema configurations may be a more suitable replacement. That's up to you to discern. My code satire already identifies likely bottom of the barrel suspects that either belong in the extinction record or have already been marked for deprecation. They are ordered more towards the bottom by rank where they belong. SuperSmoother is a masterpiece here to stay, being my original go-to reference filter. Everything you see here is already deprecated, including REMA...
REMA CHARACTERISTICS
- VERY low lag
- No overshoot
- Frequency compliant
- Proper initialization at bar_index==0
- Period parameter accepts poitive floating point numerics (AND integers!)
- Infinite impulse response (IIR) filter
- Compact code footprint
- Minimized computational overhead

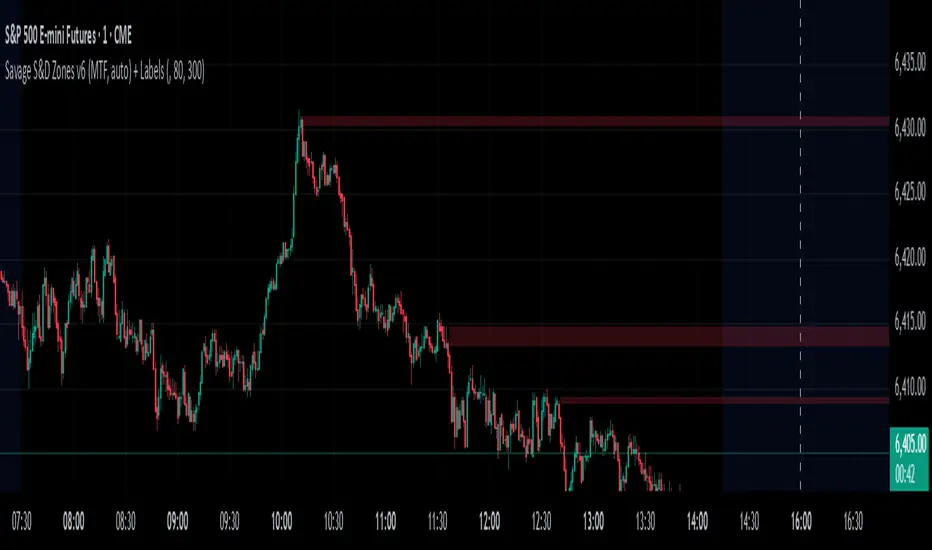
Savages Supply and Demand LevelsThis supply and demand indicator in my opinion is one of the best S&D indicators on trading view. It is clean, organized and just simple. I have spent thousands of hours determining the best and most reliable ways to identify supply and demand, on every time frame! I am going to explain exactly what I look for.
When looking for a supply level meaning, there is potential for more supply of the following stock to hit the marker, what does that mean? People are going to sell. SO, it represents possible sell ordered at that supply level. So lets get into the grit of this, there are two candles that form when a supply level is formed. The first candle needs to be green, it will have a high, a low , an open and a close. The specifics come into play with the next candle which needs to be red, that candle can NOT break the previous green candles high, and needs to close below the previous candles low. THATS IT! That is a supply level. Now, for a demand level, its the same thing just switched, we need a red candle, that will have a high,low, open and a close. Same thing now, the next candle is going to be green, that green candle can NOT break that previous red candles low and needs to close above that previous red candles high. THATS A DEMAND!
I have spent countless hours back testing and studying this, I am extremely confident that this will be a game changer for whoever uses this. I have marked different types of opening and closes and highs and lows and this specific type of setup has worked countless times for me, the only time it will not work is when there is a liquidity sweep or some sort of news where it causes the price action to swing several points. Also do not use only one time frame and only this indicator, try to use some fair value gap levels and break of structure indicators, there are really good ones on here. I have also built the indicator to get rid of supply and demand levels that have already been hit so you always have a clean and fresh supply and demand level that has not been eaten into yet. I also threw some clean labels on there so it is easy to identify. So once price action hits that supply or demand level, it goes away, it either worked or it gets invalidated.
I hope you enjoy!
Not financial advice
-Savage
Keltner Channel Based Grid Strategy # KC Grid Strategy - Keltner Channel Based Grid Trading System
## Strategy Overview
KC Grid Strategy is an innovative grid trading system that combines the power of Keltner Channels with dynamic position sizing to create a mean-reversion trading approach. This strategy automatically adjusts position sizes based on price deviation from the Keltner Channel center line, implementing a systematic grid-based approach that capitalizes on market volatility and price oscillations.
## Core Principles
### Keltner Channel Foundation
The strategy builds upon the Keltner Channel indicator, which consists of:
- **Center Line**: Moving average (EMA or SMA) of the price
- **Upper Band**: Center line + (ATR/TR/Range × Multiplier)
- **Lower Band**: Center line - (ATR/TR/Range × Multiplier)
### Grid Trading Logic
The strategy implements a sophisticated grid system where:
1. **Position Direction**: Inversely correlated to price position within the channel
- When price is above center line → Short positions
- When price is below center line → Long positions
2. **Position Size**: Proportional to distance from center line
- Greater deviation = Larger position size
3. **Grid Activation**: Positions are adjusted only when the difference exceeds a predefined grid threshold
### Mathematical Foundation
The core calculation uses the KC Rate formula:
```
kcRate = (close - ma) / bandWidth
targetPosition = kcRate × maxAmount × (-1)
```
This creates a mean-reversion system where positions increase as price moves further from the mean, expecting eventual return to equilibrium.
## Parameter Guide
### Time Range Settings
- **Start Date**: Beginning of strategy execution period
- **End Date**: End of strategy execution period
### Core Parameters
1. **Number of Grids (NumGrid)**: Default 12
- Controls grid sensitivity and position adjustment frequency
- Higher values = More frequent but smaller adjustments
- Lower values = Less frequent but larger adjustments
2. **Length**: Default 10
- Period for moving average and volatility calculations
- Shorter periods = More responsive to recent price action
- Longer periods = Smoother, less noisy signals
3. **Grid Coefficient (kcRateMult)**: Default 1.33
- Multiplier for channel width calculation
- Higher values = Wider channels, less frequent trades
- Lower values = Narrower channels, more frequent trades
4. **Source**: Default Close
- Price source for calculations (Close, Open, High, Low, etc.)
- Close price typically provides most reliable signals
5. **Use Exponential MA**: Default True
- True = Uses EMA (more responsive to recent prices)
- False = Uses SMA (equal weight to all periods)
6. **Bands Style**: Default "Average True Range"
- **Average True Range**: Smoothed volatility measure (recommended)
- **True Range**: Current bar's volatility only
- **Range**: Simple high-low difference
## How to Use
### Setup Instructions
1. **Apply to Chart**: Add the strategy to your desired timeframe and instrument
2. **Configure Parameters**: Adjust settings based on market characteristics:
- Volatile markets: Increase Grid Coefficient, reduce Number of Grids
- Stable markets: Decrease Grid Coefficient, increase Number of Grids
3. **Set Time Range**: Define your backtesting or live trading period
4. **Monitor Performance**: Watch strategy performance metrics and adjust as needed
### Optimal Market Conditions
- **Range-bound markets**: Strategy performs best in sideways trending markets
- **High volatility**: Benefits from frequent price oscillations around the mean
- **Liquid instruments**: Ensures efficient order execution and minimal slippage
### Position Management
The strategy automatically:
- Calculates optimal position sizes based on account equity
- Adjusts positions incrementally as price moves through grid levels
- Maintains risk control through maximum position limits
- Executes trades only during specified time periods
## Risk Warnings
### ⚠️ Important Risk Considerations
1. **Trending Market Risk**:
- Strategy may underperform or generate losses in strong trending markets
- Mean-reversion assumption may fail during sustained directional moves
- Consider market regime analysis before deployment
2. **Leverage and Position Size Risk**:
- Strategy uses pyramiding (up to 20 positions)
- Large positions may accumulate during extended moves
- Monitor account equity and margin requirements closely
3. **Volatility Risk**:
- Sudden volatility spikes may trigger multiple rapid position adjustments
- Consider volatility filters during high-impact news events
- Backtest across different volatility regimes
4. **Execution Risk**:
- Strategy calculates on every tick (calc_on_every_tick = true)
- May generate frequent orders in volatile conditions
- Ensure adequate execution infrastructure and consider transaction costs
5. **Parameter Sensitivity**:
- Performance highly dependent on parameter optimization
- Over-optimization may lead to curve-fitting
- Regular parameter review and adjustment may be necessary
## Suitable Scenarios
### Ideal Market Conditions
- **Sideways/Range-bound markets**: Primary use case
- **Mean-reverting instruments**: Forex pairs, some commodities
- **Stable volatility environments**: Consistent ATR patterns
- **Liquid markets**: Major currency pairs, popular stocks/indices
## Important Notes
### Strategy Limitations
1. **No Stop Loss**: Strategy relies on mean reversion without traditional stop losses
2. **Capital Requirements**: Requires sufficient capital for grid-based position sizing
3. **Market Regime Dependency**: Performance varies significantly across different market conditions
## Disclaimer
This strategy is provided for educational and research purposes only. Past performance does not guarantee future results. Trading involves substantial risk of loss and is not suitable for all investors. Users should thoroughly test the strategy and understand its mechanics before risking real capital. The author assumes no responsibility for trading losses incurred through the use of this strategy.
---
# KC网格策略 - 基于肯特纳通道的网格交易系统
## 策略概述
KC网格策略是一个创新的网格交易系统,它将肯特纳通道的力量与动态仓位调整相结合,创建了一个均值回归交易方法。该策略根据价格偏离肯特纳通道中心线的程度自动调整仓位大小,实施系统化的网格方法,利用市场波动和价格振荡获利。
## 核心原理
### 肯特纳通道基础
该策略建立在肯特纳通道指标之上,包含:
- **中心线**: 价格的移动平均线(EMA或SMA)
- **上轨**: 中心线 + (ATR/TR/Range × 乘数)
- **下轨**: 中心线 - (ATR/TR/Range × 乘数)
### 网格交易逻辑
该策略实施复杂的网格系统:
1. **仓位方向**: 与价格在通道中的位置呈反向关系
- 当价格高于中心线时 → 空头仓位
- 当价格低于中心线时 → 多头仓位
2. **仓位大小**: 与距离中心线的距离成正比
- 偏离越大 = 仓位越大
3. **网格激活**: 只有当差异超过预定义的网格阈值时才调整仓位
### 数学基础
核心计算使用KC比率公式:
```
kcRate = (close - ma) / bandWidth
targetPosition = kcRate × maxAmount × (-1)
```
这创建了一个均值回归系统,当价格偏离均值越远时仓位越大,期望最终回归均衡。
## 参数说明
### 时间范围设置
- **开始日期**: 策略执行期间的开始时间
- **结束日期**: 策略执行期间的结束时间
### 核心参数
1. **网格数量 (NumGrid)**: 默认12
- 控制网格敏感度和仓位调整频率
- 较高值 = 更频繁但较小的调整
- 较低值 = 较少频繁但较大的调整
2. **长度**: 默认10
- 移动平均线和波动率计算的周期
- 较短周期 = 对近期价格行为更敏感
- 较长周期 = 更平滑,噪音更少的信号
3. **网格系数 (kcRateMult)**: 默认1.33
- 通道宽度计算的乘数
- 较高值 = 更宽的通道,较少频繁的交易
- 较低值 = 更窄的通道,更频繁的交易
4. **数据源**: 默认收盘价
- 计算的价格来源(收盘价、开盘价、最高价、最低价等)
- 收盘价通常提供最可靠的信号
5. **使用指数移动平均**: 默认True
- True = 使用EMA(对近期价格更敏感)
- False = 使用SMA(对所有周期等权重)
6. **通道样式**: 默认"平均真实范围"
- **平均真实范围**: 平滑的波动率测量(推荐)
- **真实范围**: 仅当前K线的波动率
- **范围**: 简单的高低价差
## 使用方法
### 设置说明
1. **应用到图表**: 将策略添加到您所需的时间框架和交易品种
2. **配置参数**: 根据市场特征调整设置:
- 波动市场:增加网格系数,减少网格数量
- 稳定市场:减少网格系数,增加网格数量
3. **设置时间范围**: 定义您的回测或实盘交易期间
4. **监控表现**: 观察策略表现指标并根据需要调整
### 最佳市场条件
- **区间震荡市场**: 策略在横盘趋势市场中表现最佳
- **高波动性**: 受益于围绕均值的频繁价格振荡
- **流动性强的品种**: 确保高效的订单执行和最小滑点
### 仓位管理
策略自动:
- 根据账户权益计算最优仓位大小
- 随着价格在网格水平移动逐步调整仓位
- 通过最大仓位限制维持风险控制
- 仅在指定时间段内执行交易
## 风险警示
### ⚠️ 重要风险考虑
1. **趋势市场风险**:
- 策略在强趋势市场中可能表现不佳或产生损失
- 在持续方向性移动期间均值回归假设可能失效
- 部署前考虑市场制度分析
2. **杠杆和仓位大小风险**:
- 策略使用金字塔加仓(最多20个仓位)
- 在延长移动期间可能积累大仓位
- 密切监控账户权益和保证金要求
3. **波动性风险**:
- 突然的波动性激增可能触发多次快速仓位调整
- 在高影响新闻事件期间考虑波动性过滤器
- 在不同波动性制度下进行回测
4. **执行风险**:
- 策略在每个tick上计算(calc_on_every_tick = true)
- 在波动条件下可能产生频繁订单
- 确保充足的执行基础设施并考虑交易成本
5. **参数敏感性**:
- 表现高度依赖于参数优化
- 过度优化可能导致曲线拟合
- 可能需要定期参数审查和调整
## 适用场景
### 理想市场条件
- **横盘/区间震荡市场**: 主要用例
- **均值回归品种**: 外汇对,某些商品
- **稳定波动性环境**: 一致的ATR模式
- **流动性市场**: 主要货币对,热门股票/指数
## 注意事项
### 策略限制
1. **无止损**: 策略依赖均值回归而无传统止损
2. **资金要求**: 需要充足资金进行基于网格的仓位调整
3. **市场制度依赖性**: 在不同市场条件下表现差异显著
## 免责声明
该策略仅供教育和研究目的。过往表现不保证未来结果。交易涉及重大损失风险,并非适合所有投资者。用户应在投入真实资金前彻底测试策略并理解其机制。作者对使用此策略产生的交易损失不承担任何责任。
---
**Strategy Version**: Pine Script v6
**Author**: Signal2Trade
**Last Updated**: 2025-8-9
**License**: Open Source (Mozilla Public License 2.0)

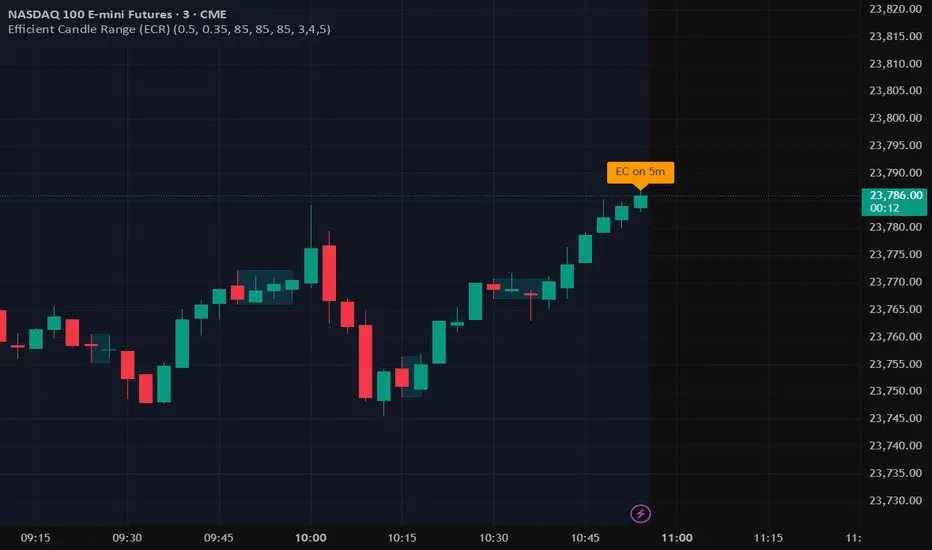
Efficient Candle Range (ECR)Efficient Candle Range (ECR)
A custom-built concept designed to detect zones of efficient price movement, often signaling the start, pause, or end of an implied move.
What is the Efficient Candle Range?
The Efficient Candle Range (ECR) is a unique tool that identifies price zones based on efficient candles—candles with relatively small bodies and balanced wicks. These candles reflect balanced or orderly price action, and when grouped into a range, they can reveal areas of temporary equilibrium in the market.
Rather than focusing on single candles, ECR builds a range that dynamically adjusts as new efficient candles form. This gives traders an objective way to track potential areas of absorption, distribution, or transition.
Why use ECR?
Efficient candles often occur:
At the beginning of a new move, after a liquidity sweep or shift in sentiment
At the end of a strong move, as momentum fades
Within consolidation zones, where price trades in a balanced, indecisive state
While ECRs can appear in any market condition, their interpretation depends on context:
In a range, an ECR might just reflect sideways balance.
But after a sweep or breakout, it could signal a potential shift in direction or continuation.
A close outside the ECR often marks the end of that balance and the start of a new impulse.
How it works
The script detects efficient candles based on body-to-range ratio and wick symmetry.
Consecutive ECs are grouped into a live ECR box.
The box dynamically extends as long as price stays inside the high-low range.
Once a candle closes outside, the ECR is considered invalid (fades visually, but remains visible for reference).
Each active range is labeled "ECR" within the box for easy tracking.
Customizable in settings
Max body percentage of range
Max wick imbalance
Box and label color/transparency
Suggested usage
Let the ECR define your observation zone.
Instead of reacting immediately to an efficient candle, wait for a confirmed breakout from the ECR to validate the next move.
Whether you trade breakouts, reversals, or continuation setups, ECR provides an objective way to visualize price balance and understand when the market is likely to expand.
Designed for individual traders looking to build structure around efficient price movement — no specific methodology required.
Momentum Commitment Delta (MCD)What it is
M C D fuses five micro-structure clues into one 0-to-1 score that says, “how hard are traders actually leaning on this move?”
1. Body-Delta Momentum – average net candle body direction.
2. Volume Commitment – up-volume ÷ down-volume over the same window.
3. Wick Compression – shrinking upper/lower wicks = clean conviction.
4. Candle Sequencing – rewards orderly, staircase-style body growth.
5. Pin Ratio – where the close pins inside each candle’s range.
The five factors are multiplied, then auto-normalized so extremes always land near 0 / 1 on any symbol or timeframe.
I recommend tweaking the settings to fit your edge, the pre-loaded settings may not be suitable for most traders. The MCD works on all timeframes as well :)
⸻
How to read basic signals
• Fresh cross above 0.70 → often the birth of a real breakout.
• Cluster of > 0.70 bars → “commitment lock,” pull-backs usually shallow.
• Price makes new high while M C D doesn’t → beware...
• Cross back below 0.30 after a run → momentum is out of fuel.
⸻
Because M C D is multiplicative, it’s hard to hit the extremes—so when the bars light lime green, the print is usually telling the truth.
I personally use the MCD to identify the peak of a high-conviction range, NOT a breakout. If a bar prints over 0.70 (green) and then a range forms off of the bar which exceeded 0.70, the breakout has a high chance to be explosive, regardless of what MCD reads at the breakout inflection point.
Play around with it, im sure there are plenty of other patterns.
Disclaimer: The Momentum Commitment Delta (MCD) indicator is provided strictly for educational and informational purposes. It does not constitute financial or investment advice, nor is it a recommendation to buy or sell any security. Trading involves substantial risk, and you should always perform your own due diligence and consult a qualified financial professional before making any trading decisions. Past performance is not indicative of future results.
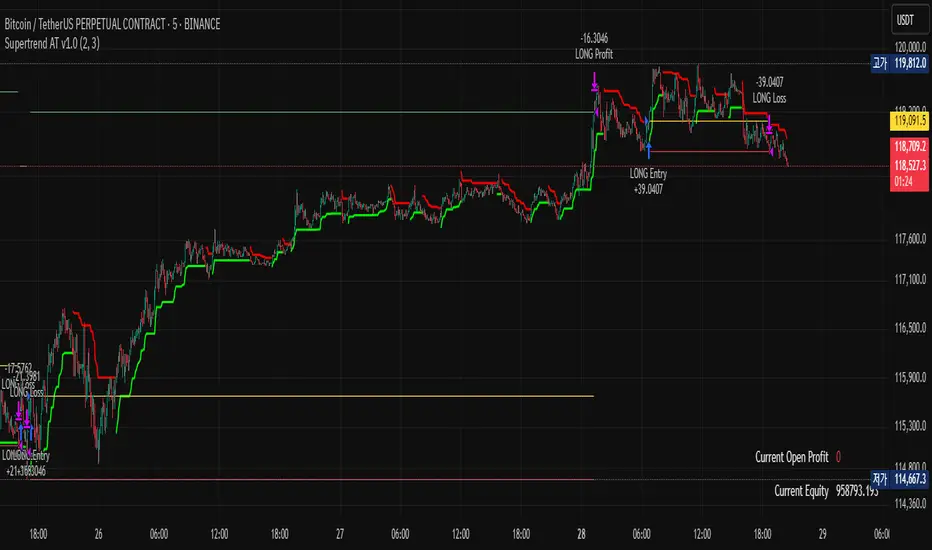
Supertrend AT v1.0### Overview
"Supertrend AT v1.0" is an automated trading strategy based on the Supertrend indicator, designed to detect trend reversals and execute entries accordingly. This script supports both **long and short** positions and includes customizable risk management features such as **RPT (Risk Per Trade)** and **RR (Risk/Reward ratio)**.
### Key Features
- 📈 **Supertrend-based Entry Logic**:
- Enters a **long position** when the Supertrend flips from red to green (downtrend → uptrend).
- Enters a **short position** when the Supertrend flips from green to red (uptrend → downtrend).
- 💰 **Auto-Calculated Position Sizing**:
- Quantity is automatically calculated to ensure that loss per trade (including commission) matches the specified risk percentage (RPT).
- 🎯 **Take-Profit and Stop-Loss**:
- Both targets are dynamically computed using the RR ratio and account for commission fees.
- 📊 **Visual Elements**:
- Entry, stop, and target prices are plotted on the chart.
- Real-time PnL and account equity are shown in a dashboard.
- Optional on-screen README guide explains the strategy and key terms.
### Inputs
- **RPT (%)**: Risk per transaction (based on account equity).
- **RR**: Reward-to-risk ratio.
- **Commission (%)**: Used in all calculations (must match the Properties tab).
- **Supertrend Settings**: Adjustable factor and length.
- **Market Decimal Places**: For accurate quantity rounding according to exchange rules.
- **Time Filter**: Set start and end time for trading logic activation.
### Risk Management Logic
This strategy calculates trade size and targets using a formula that considers both the price distance between entry and stop-loss and the effect of commission fees. This ensures:
- Consistent risk across trades
- Realistic take-profit levels
- Exchange-compliant order quantities
### Notes
- ⚠️ Be sure to set the **correct commission rate** and **decimal precision** for your exchange.
- ⚠️ If trade quantity is smaller than your exchange’s minimum unit, orders may be rejected.
- 🔧 For strategy to behave as intended in automation, double-check both **input tab** and **Properties tab** settings.
### Disclaimer
This strategy is for educational and research purposes only. It does not constitute financial advice. Always test on paper before using in a live environment.
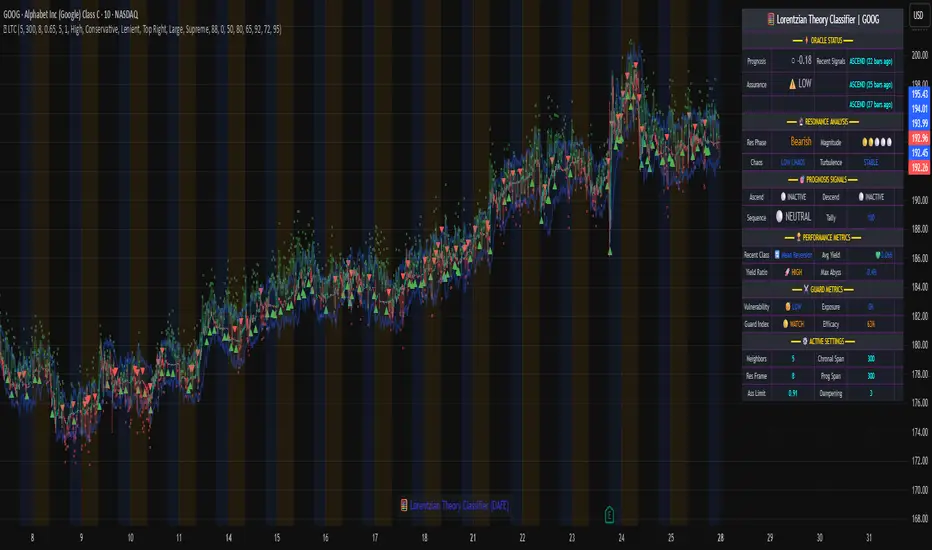
Lorentzian Theory Classifier🧮 Lorentzian Theory Classifier: An Observatory for Market Spacetime
Transcend the flat plane of traditional charting. Enter the curved, dynamic reality of market spacetime. The Lorentzian Theory Classifier (LTC) is not an indicator; it is a computational observatory. It is an instrument engineered to decode the geometry of market behavior, revealing the hidden curvatures and resonant frequencies that precede significant turning points.
We discard the outdated tools of Euclidean simplicity and embrace a more profound truth: financial markets, much like the cosmos described by general relativity, are governed by a fabric that is warped by the mass of participation and the energy of volatility. The LTC is your lens to perceive this fabric, to move beyond predicting lines on a chart and begin reading the very architecture of probability.
The Resonance Manifold: Standard Euclidean models search for historical analogues within a rigid sphere, missing the crucial outliers that define market extremes. The LTC's Lorentzian Resonance engine operates in a curved, non-Euclidean space, allowing it to connect with these "fat-tail" events—the true genesis points of major reversals.
🌌 THE THEORETICAL FRAMEWORK: A new Grand Unified Theory of Market Analysis
The LTC is built upon a revolutionary synthesis of concepts from special relativity, quantum mechanics, and information theory. It reframes market analysis not as a problem of forecasting, but as a problem of state recognition in a non-Euclidean manifold.
1. The Lorentzian Kernel: The Mathematics of Reality
Financial markets are not Gaussian. Their reality is one of "fat tails"—sudden, high-impact events that standard models dismiss as anomalies. The LTC acknowledges this reality by using the mathematically pure and robust Lorentzian kernel as its core engine:
Similarity(x, y) = 1 / (1 + (||x − y||² / γ²))
||x − y||²: The squared distance between the current market state (x) and a historical state (y) in our 8-dimensional feature space.
γ (Gamma): A dynamic bandwidth parameter, our "Lorentz factor," which adapts to market entropy (chaos). In calm markets, gamma is small, demanding precise resonance. In chaotic markets, gamma expands, intelligently seeking broader patterns.
This heavy-tailed function is revolutionary. It correctly assigns profound significance to the rare, extreme events that truly define market structure, while gracefully tuning out the noise of mundane price action. It doesn't just calculate; it understands context.
2. The 8-Dimensional State Vector: The Market's Quantum Fingerprint
To achieve a holistic view, the LTC projects the market onto an 8-dimensional Hilbert space, where each dimension represents a critical "observable":
Momentum & Acceleration (f_rsi, f_roc): The market's velocity and its rate of change.
Cyclical Position (f_stoch, f_cci): The market's location within its recent oscillation cycles.
Energy & Participation (f_vol, f_cor): The force of capital flow and its harmony with price.
Chaos & Uncertainty (f_ent, f_mom): The degree of randomness and the standardized force of price changes.
These are not eight separate indicators. They are entangled properties of a single "market wavefunction." The LTC's genius lies in measuring the geometric distance between these complete quantum states.
3. The k-NN Oracle: A Council of Past Universes
The LTC employs a k-Nearest Neighbors algorithm, but in our curved Lorentzian spacetime. It poses a constant, profound question: " Which moments in history are most geometrically congruent to the present moment across all eight dimensions? "
It then summons a "council" of these historical neighbors. Each neighbor's future outcome (did price ascend or descend?) casts a vote, weighted by its resonant similarity. The result is a probabilistic forecast of stunning clarity:
Prognosis: The final weighted consensus on future direction.
Assurance: The degree of unanimity within the council—a direct measure of the prediction's confidence.
The Funnel of Conviction: The LTC's process is a rigorous distillation of information. Raw, chaotic market data is resolved into a clean 8-dimensional state vector. The Lorentzian Kernel filters these states for resonance, which are then passed to the k-NN Oracle for a vote. Noise is eliminated at each stage, resulting in a single, validated, high-conviction signal.
⚙️ THE COMMAND CONSOLE: A Guide to Calibrating Your Observatory
Mastering the LTC's inputs is to become an architect of your own analytical universe. Each parameter is a dial that tunes the observatory's focus, from galactic structures to subatomic fluctuations. The tooltips in-script—over 6,000 words of documentation—provide immediate reference; this guide provides the philosophy.
A summarized guide to the Core, Signal, Supreme, and Visual controls is included directly in the indicator's code and tooltips. We encourage all users to explore these settings to tune the LTC to their unique analytical style.
🏆 THE SUPREME DASHBOARD: Your Mission Control
The dashboard is not a data table; it is your command interface with market reality. It translates the intricate dance of probabilities and vectors into clear, actionable intelligence.
⚡ ORACLE STATUS
Prognosis: The primary directional vector. Its color, magnitude, and emoji (⚡) reveal the strength and conviction of the Oracle's forward guidance.
Assurance: A real-time gauge of prediction quality, from "LOW" (high uncertainty) to "ELITE" (overwhelming statistical consensus). Interpret this as your core risk metric: trade with conviction when Assurance is ELITE; trade with caution when it is LOW.
🔮 RESONANCE ANALYSIS
Chaos: A direct measurement of market entropy. "LOW CHAOS" signifies a predictable, orderly regime. "HIGH CHAOS" is a warning of randomness and unpredictability, where trend-following logic may fail.
Turbulence: A measure of raw volatility. When the market is "TURBULENT," expect wider price swings and increased risk. Use this metric to adjust stop-loss distances and profit targets dynamically.
🏆 PERFORMANCE & ⚔️ GUARD METRICS
These sections provide illustrative statistics on the script's recent historical behavior. Metrics like Yield Ratio and Guard Index offer a quick heuristic on the prevailing risk-reward environment. Crucially, these are for observational context only and are not a substitute for your own rigorous testing and analysis.
🎨 THE VISUAL MANIFESTATION: Charting the Unseen
The LTC's visuals are designed to transform your chart from a 2D price graph into a 4D informational battlespace.
The Dynamic Aura (Background Color): This is the ambient energy field of the market. A luminous green (Ascend) signifies a bullish resonance field; a deep red (Descend) indicates bearish pressure.
The Assurance Shroud (Blue Bands): A visualization of confidence. When the shroud is wide and expansive , the Oracle's vision is clear and its predictions are robust.
The Prognosis Arc (Curved Line): A geodesic projection of the market's most likely path, based on the current Prognosis.
The Turbulence Cloud (Orange Mist): A visual warning system for market chaos. When this entropic mist expands , it is a clear sign that you are navigating a nebula of high unpredictability.
Oracle Markers (▲▼): The final, validated signals. These are not merely pivot points. They are moments in spacetime where a structural pivot has been confirmed and then ratified by a high-conviction vote from the Lorentzian Oracle. They are the pinnacles of confluence.
The Analyst's Observatory: The LTC transforms your chart into a command center for market analysis, providing a complete, at-a-glance view of market state, risk, and probabilistic trajectory.
🔧 THE ARCHITECT'S VISION: From a Blank Slate to a New Cosmos
The LTC was not assembled; it was derived. It began not with code, but with first principles, asking: "If we were to build an instrument to measure the market today, unbound by the technical dogmas of the 20th century, what would it look like?" The answer was clear: it must be multi-dimensional, it must be adaptive, and it must be built on a mathematical framework that respects the "fat-tailed" nature of reality.
The decision to use a pure Lorentzian kernel was non-negotiable. It represented a commitment to intellectual honesty over computational ease. The development of the Supreme Dashboard was driven by the philosophy of the "glass cockpit"—a belief that a trader's greatest asset is not a black box signal, but a transparent and intuitive flow of high-quality information. This script is the result of that unwavering vision: to create not just another indicator, but a new lens through which to perceive the market.
⚠️ RISK DISCLOSURE & PHILOSOPHY OF USE
The Lorentzian Theory Classifier is an instrument of profound analytical power, intended for the serious, discerning trader. It does not generate infallible signals. It generates high-probability, data-driven hypotheses based on a rigorous and transparent methodology. All trading involves substantial risk, and the future is fundamentally unknowable. Past performance, whether real or simulated, is no guarantee of future results. Use this tool to augment your own skill, to confirm your own analysis, and to manage your own risk within a well-defined trading plan.
"The effort to understand the universe is one of the very few things that lifts human life a little above the level of farce, and gives it some of the grace of tragedy."
— Steven Weinberg, Nobel Laureate in Physics
Trade with rigor. Trade with perspective. Trade with enlightenment. Trade with insight. Trade with anticipation.
— Dskyz, for DAFE Trading Systems
Inflection PointInflection Point - The Adaptive Confluence Reversal Engine
This is not just another peak and valley indicator; it is a complete and total reimagining of how market turning points are detected, qualified, and acted upon. Born from the foundational concepts explored in systems like my earlier creation, DAFE - Turning Point, Inflection Point is a ground-up engineering feat designed for the modern trader. It moves beyond static rules and simple pattern recognition into the realm of dynamic, multi-factor confluence analysis and adaptive machine learning.
Where other indicators provide a guess, Inflection Point provides a probability. It meticulously analyzes the market's deepest currents—momentum, exhaustion, and reversal velocity—and fuses them into a single, unified "Confluence Score." This is not a simple combination of indicators; it is an intelligent, weighted system where each component works in concert, creating an analytical engine that is orders of magnitude more sophisticated and reliable than any standard reversal tool.
Furthermore, Inflection Point learns. Through its advanced Adaptive Learning Engine, it constantly monitors its own performance, adjusting its confidence and selectivity in real-time based on its recent success rate. This allows it to adapt its behavior to any security, on any timeframe, with remarkable success.
Theoretical Foundation - Confluence Core
Inflection Point's predictive power does not come from a single, magical formula. It comes from the intelligent synthesis of three critical market phenomena, weighted and scored in real-time to generate a single, high-conviction probability rating.
1. Factor One: Pre-Reversal Momentum State (RSI Analysis)
Instead of reacting to a simple RSI cross, Inflection Point proactively scans for the build-up of momentum that precedes a reversal.
• Formulaic Concept: It measures the highest RSI value over a lookback period for peaks and the lowest RSI for valleys. A signal is only considered valid if significant momentum has been established before the turn, indicating a stretched market condition ripe for reversal.
• Asymmetric Sophistication: The engine uses different, optimized thresholds for bull and bear momentum, recognizing that markets often fall faster than they rise.
2. Factor Two: Volatility Exhaustion (Bollinger Band Analysis)
A true reversal often occurs when price makes a final, exhaustive push into unsustainable territory.
• Formulaic Concept: The engine detects when price has significantly pierced the outer Bollinger Bands. This is not just a touch, but a statistical deviation from the mean that signals volatility exhaustion, where the energy for the current move is likely depleted.
3. Factor Three: Reversal Strength (Rate of Change Analysis)
The character of a reversal matters. A sharp, decisive turn is more significant than a slow, meandering one.
• Formulaic Concept: Using a short-term Rate of Change (ROC), the engine measures the velocity of the reversal itself. A higher ROC score adds significant weight to the final probability, confirming that the new direction has conviction.
4. The Final Calculation: The Adaptive Learning Engine
This is the system's "brain." It maintains a history of its past signals and calculates its real-time win rate. This hitRate is then used to generate an adaptiveMultiplier.
• Self-Correction: In "Quality Control" mode, a high win rate makes the indicator more selective, demanding a higher probability score to issue a signal, thereby protecting streaks. A lower win rate makes it slightly less selective to ensure it continues learning from new market conditions.
• The result is a system that is not static, but a living, breathing tool that adapts its personality to the unique rhythm of any chart.
Why Inflection Point is a Paradigm Shift
Inflection Point is fundamentally different from other reversal indicators for three key reasons:
Confluence Over Isolation: Standard indicators look at one thing (e.g., RSI > 70). Inflection Point simultaneously analyzes momentum, volatility, and velocity, understanding that true reversals are a product of multiple converging factors. It answers not just "if," but "why" a reversal is likely.
Probabilistic Over Binary: Other tools give you a simple "yes" or "no." Inflection Point provides a probability score from 0-100, allowing you to gauge the conviction of every potential signal. This empowers you to differentiate between a weak setup and an A+ opportunity.
Adaptive Over Static: Every other indicator uses the same rules forever. Inflection Point's Adaptive Engine means it is constantly refining its own logic based on what is actually working in the current market, on the specific asset you are trading. It is tailored to the now.
The Inputs Menu - Your Command Center
Every setting is a lever of control, allowing you to tune the engine to your precise trading style and market focus.
🧠 Neural Core Engine
Analysis Depth: This is the primary lookback for the Bollinger Band and other core calculations. A shorter depth makes the indicator faster and more sensitive, ideal for scalping. A longer depth makes it slower and more stable, ideal for swing trading.
Minimum Probability %: This is your master signal filter. It sets the minimum Confluence Score required to plot a signal. Higher values (85-95) will give you only the highest-conviction A+ setups. Lower values (70-80) will show more potential opportunities.
🤖 Adaptive Neural Learning
Enable Adaptive Learning Engine: Toggles the entire learning system. Disabling it will make the indicator's logic static.
Peak/Valley Success Threshold (ATR): This defines what constitutes a "successful" trade for the learning engine. A value of 1.5 means price must move 1.5x the ATR in your favor for the signal to be marked as a win. Adjust this to match your personal take-profit strategy.
Adaptive Mode: This dictates how the engine uses its hitRate. "Quality Control" is recommended for its intelligent filtering. "Aggressive" will always boost signal scores, useful for finding more setups in a known, trending environment.
Asymmetric Balance: Allows you to apply a "boost" to either peak (short) or valley (long) signals. If you find the market you're trading has stronger long reversals, you can increase the "Valley Signal Boost" to catch them more effectively.
🛡️ Elite Filters
Market Noise Filter: An exceptional tool for avoiding choppy markets. It counts the number of directional changes in the last 5 bars. If the market is whipping back and forth too much, it will block the signal. Lower the "Max Direction Changes" to be extremely selective.
Volume Filter: Requires signal confirmation from a significant volume spike. The "Volume Multiplier" dictates how large this spike must be (e.g., 1.2 = 20% above average volume). This is invaluable for filtering out low-conviction moves in stocks and crypto.
The Dashboard - Your Analytical Co-Pilot
The dashboard is not just a set of numbers; it is a holistic overview of the market's health and the engine's current state.
Unified AI Score: This section provides the most critical, at-a-glance information. "Total Score" is the current probability reading, while "Quality" gives you a human-readable interpretation. "Win Rate" shows the real-time performance of the Adaptive Engine.
Order Flow (OFPI): This measures the "weight" of money behind recent price moves by analyzing price change relative to volume. A high positive OFPI suggests strong buying pressure, while a high negative value suggests strong selling pressure. It gives you a peek into the market's underlying flow.
Component Analysis: This allows you to see the individual "Peak" and "Valley" confidence scores before they are filtered, giving you insight into building momentum before a signal forms.
Market Structure: This panel assesses the broader environment. "HTF Trend" tells you the direction of the larger trend (based on EMAs), while "Vol Regime" tells you if the market is in a high, medium, or low volatility state. Use this to align your signals with the broader market context.
Filter & Engine Statistics: Available on the "Large" dashboard, this provides deep insight into how many signals are being blocked by your filters and the current status of the Adaptive Engine's multiplier.
The Visual Interface - A Symphony of Data
Every visual element on the chart is designed for instant interpretation and insight.
Signal Markers: Simple, clean triangles mark the exact bar of a valid signal. A box is drawn around the high/low of the signal bar to highlight the precise point of inflection.
Dynamic Support/Resistance Zones: These are the glowing lines on your chart. They are not static lines; they are dynamic levels that represent the current battlefield between buyers and sellers.
Cyber Cyan (Valley Blue): This is the current Support Zone. This is the price level the market is currently trying to defend.
Neural Pink (Peak Red): This is the current Resistance Zone. This is the price level the market is currently trying to break through.
Grey (Next Level): This line is a projection, based on the current momentum and the size of the S/R range, of where the next major level of conflict will likely be. It acts as a potential price target.
Development & Philosophy
Inflection Point was not assembled; it was engineered. It represents hundreds of hours of research into market dynamics, statistical analysis, and machine learning principles. The goal was to create a tool that moves beyond the limitations of traditional technical analysis, which often fails in modern, algorithm-driven markets. By building a system based on multi-factor confluence and self-adaptive logic, Inflection Point provides a quantifiable, statistical edge that is simply unattainable with simpler tools. This is the result of a relentless pursuit of a better, more intelligent way to trade.
Universal Applicability
The principles of momentum, exhaustion, and velocity are universal to all freely traded markets. Because of its adaptive core and robust filtering options, Inflection Point has proven to be exceptionally effective on any security (stocks, crypto, forex, indices, futures) and on any timeframe (from 1-minute scalping charts to daily swing trading charts).
" Markets are constantly in a state of uncertainty and flux and money is made by discounting the obvious and betting on the unexpected. "
— George Soros
Trade with insight. Trade with anticipation.
— Dskyz, for DAFE Trading Systems

Liquidity Spectrum Visualizer [BigBeluga]🔵 OVERVIEW
The Liquidity Spectrum Visualizer is a smart tool for exposing hidden liquidity zones by combining a dynamic volume profile, clear liquidity levels, and intuitive volume bubbles directly on your price chart. It shows you exactly where significant volume is clustering inside your chosen lookback period — highlighting where big market participants may be defending price or planning breakouts.
🔵 CONCEPTS
Volume Profile Bins: Breaks your custom lookback range into 100 fine price bins, calculating total volume per bin to create a precise vertical liquidity histogram.
Liquidity Levels: Bins with high relative volume automatically plot as horizontal lines — thicker and brighter lines signal stronger liquidity concentrations.
Dynamic Coloring: Profile bins and liquidity levels adjust their colors live based on whether current price is trading above (support) or below (resistance).
Volume Bubbles: Each candle displays a bubble at its HLC3 price —
- The bubble’s size shows relative candle volume.
- Its color gradient indicates bullish or bearish volume: greenish for bullish candles, orange for bearish.
Bubble Labels: The largest bubbles automatically label the actual volume amount, revealing big hidden flows.
Range Box High/Low: Marks the absolute swing high and low inside the lookback window, clearly framing the active liquidity zone.
🔵 FEATURES
Smart, auto-scaled volume profile up to 200 candles (or custom).
Liquidity levels with dynamic thickness and color based on real-time volume.
Bubbles sized and colored to show both volume magnitude and bullish/bearish bias.
Largest bubbles labeled for fast detection of high-impact bars.
High and low price labels clearly show the analyzed range.
Toggle Volume Profile, Liquidity Levels, and Bubbles independently.
🔵 HOW TO USE
Watch for thick, bright liquidity levels — these zones mark where large orders or stop clusters are likely hidden.
Use dynamic coloring: if price is above a level, it’s support; if below, it’s resistance.
Pay special attention to big bubbles: these mark sudden spikes in traded volume and can signal absorption, traps, breakouts or significant price levels.
Combine with your existing confluence tools to confirm breakouts or fakeouts around visible liquidity clusters.
🔵 CONCLUSION
The Liquidity Spectrum Visualizer transforms hidden order flow into an intuitive, color-coded map. You see at a glance where price is absorbing, consolidating, or ready to break — all powered by real-time volume behavior and smart visuals. It’s a must-have tool for traders who want to read liquidity and react ahead of the crowd.
