Forex sessions with daylight savingsThis will adjust with Daylight Savings (DS) however you will need to update the start and end dates of DS once each year. That said, it's valid for 2021 and I'll try to remember to update this script each year so people don't have up to do the update of the DL start and end dates.
If there is a way to know these dates automatically in pine script someone please let me know.
Notice that Sydney has an offset of -1 instead of 1 for DS since being on the other side of the planet (sorry flat Earthers but this is a side-effect of a globe) they need to put their clocks backwards for DS instead of forwards.
Features:
Shows sessions for: Frankfurt, London, New York, Sydney & Tokyo
Includes Daylight savings changes
Has a legend you can display and hide to see which colors are for which sessions around the world
Allows you to show or hide each session individually
Allows you to display the legend in the same opacity as the indicators or 0 opacity to make it more readable.
This is my first public script so feedback most welcomed.
Tìm kiếm tập lệnh với "session"

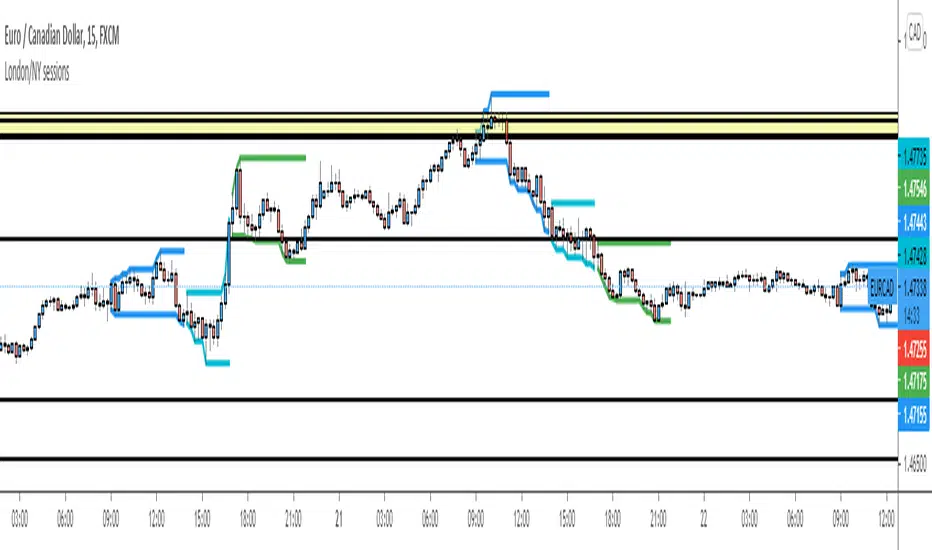
London/NY sessionsVertical lines that follow the low & highs of the London, London/NY overlap & New York Session.
Times used are my personal favourite
Example - Custom Defined Dual-State SessionThis script example aims to cover the following:
defining custom timeframe / session windows
gather a price range from the custom period ( high/low values )
create a secondary "holding" period through which to display the data collected from the initial session
simple method to shift times to re-align to preferred timezone
Articles and further reading:
www.investopedia.com - trading session
Reason for Study:
Educational purposes only.
Before considering writing this example I had seen multiple similar questions
asking how to go about creating custom timeframes or sessions, so it seemed
this might be a good topic to attempt to create a relatively generic example.

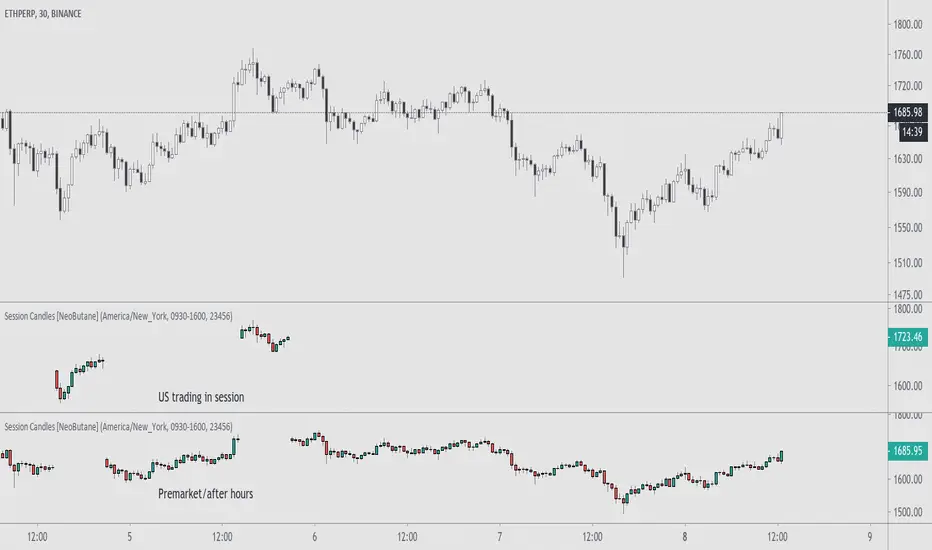
Trading Session Candles [NeoButane]█ OVERVIEW
Display candlesticks for the selected session, regular or extended.
█ CONFIGURATION
Options to change include displaying the regular or extended session, timezone, session hours, and session days.
█ CONCEPTS
Meant for charts with longer trading sessions or to view only extended hours trading action on US stocks that have afterhours available.
█ Notes
For trading days, '23456' refers to Monday to Friday.
Yesterday's RTH&ON sessions OHLCsThe indicator plots the OHLC levels of both trading sessions of the day before: the overnight session and the Regular Trading Hours.

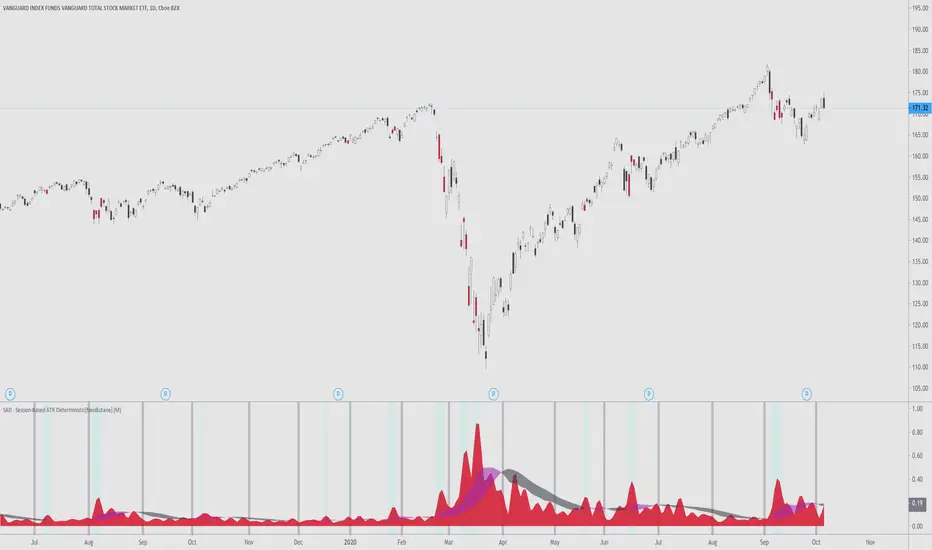
SAD - Session-Based ATR Deterministic[NeoButane]SAD - ATR with a utility tune-up.
Similar to ATR, SAD finds the true range of an asset. Unlike ATR, which is a rolling indicator, SAD is session based, simliar to VWAP. This gives it a great advantage over a regular ATR, where one must determine if their ATR level is statistically significant or not. SAD makes it easy for you to analyze statistical anomalies without having to pull out a calculator.
By breaking up ATR in sessions, it is able to be determined when price has moved an abnormal amount in a session deterministically. Noise is removed by a moving average filter, the weighted moving average. This was chosen over the EMA?SMA because an EMA would be to quick to change and the SMA would be too slow.
The ribbon's colors, purple, is active when volatility is rising. It is black when volatility is falling. You can see that this is directionally neutral.
Options to configure:
Timeframe
Ribbon dipslay
Session break display
[*}Bar coloring
Common examples of usage:
If you want to use this indicator, add it to your favorites and you can find it there.
High & Low Of Custom Session - OpeningRange Breakout (Expo)High & Low Of Custom Session - OpeningRange Breakout (Expo) prints the high and the low of a custom session.
I use the indicator to trade the re-test of opening range (high/low) as well as breakouts from the opening range. The same logic can be applied to the session you have chosen.
HOW TO USE
1. Use the indicator to trade the re-tests of the session range.
2. Use the indicator to trade breakouts of session range.
INDICATOR IN ACTION
1-min chart
I hope you find this indicator useful , and please comment or contact me if you like the script or have any questions/suggestions for future improvements. Thanks!
I will continually work on this indicator, so please share your experience and feedback as it will enable me to make even better improvements. Thanks to everyone that has already contacted me regarding my scripts. Your feedback is valuable for future developments!
-----------------
Disclaimer
Copyright by Zeiierman.
The information contained in my scripts/indicators/ideas does not constitute financial advice or a solicitation to buy or sell any securities of any type. I will not accept liability for any loss or damage, including without limitation any loss of profit, which may arise directly or indirectly from the use of or reliance on such information.
All investments involve risk, and the past performance of a security, industry, sector, market, financial product, trading strategy, or individual’s trading does not guarantee future results or returns. Investors are fully responsible for any investment decisions they make. Such decisions should be based solely on an evaluation of their financial circumstances, investment objectives, risk tolerance, and liquidity needs.
My scripts/indicators/ideas are only for educational purposes!

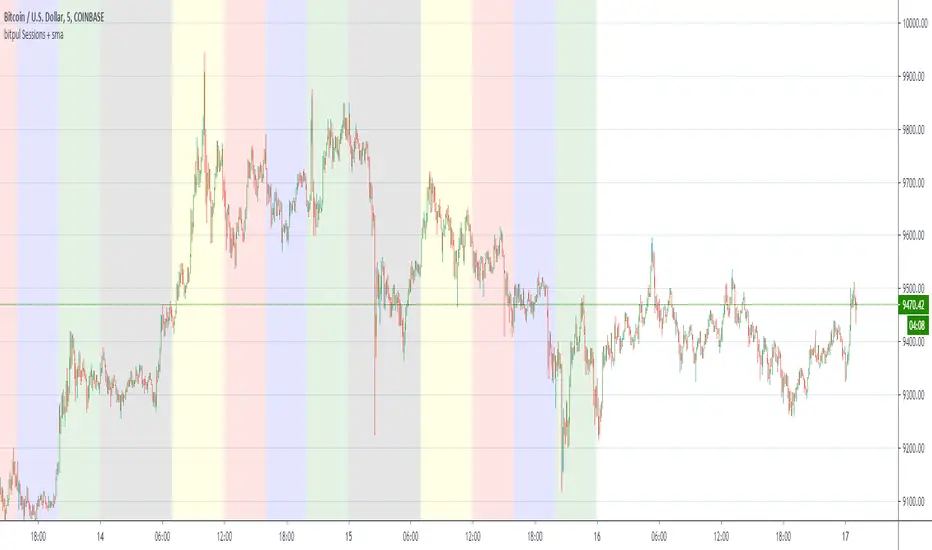
bitpul Sessions + sma [MHMK]Background colors that show open-close of the major market sessions ( Tokyo, London, joint time, New York, free time).
I added two sma to get more confirmation for the reversal - You can hide smas
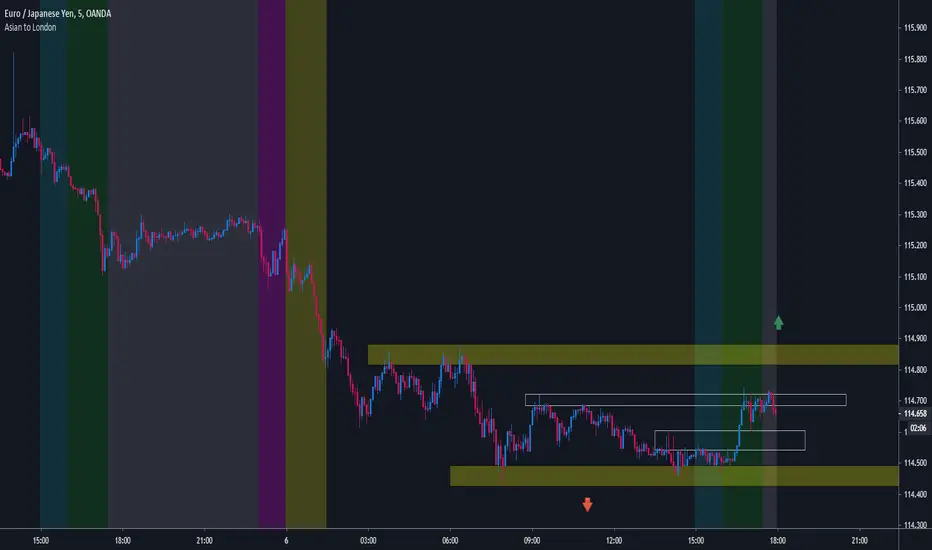
MF Custom Sessions - Asian to LondonThis indicator is meant to be used as a visual aid for understanding when major volumes / session timings are taking place. Asian to london sessions are covered.
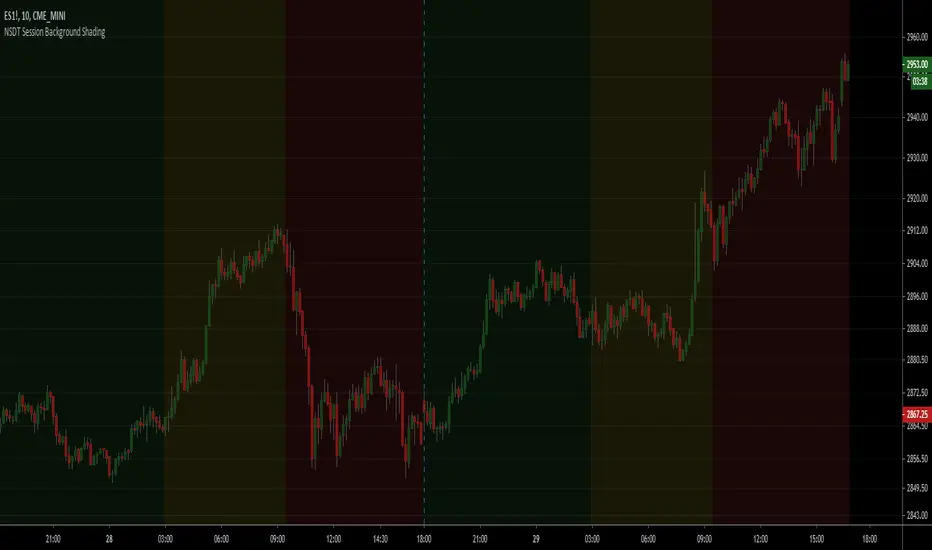
NSDT Session Background ShadingA simple script to add background colors to specific timeframes. Great for trading futures so you can separate sessions for easier viewing. Use for stocks to separate pre, open, and post market times.
There are three timeframes that can be set and all colors can be modified.
Forex Sessions by EF with DSTBased on the well known existing Sessions script
Changes:
- 3x daylight savings checkboxes for Australia, London and New York. No more manual script modifications when DST is on/off, just check/uncheck and go!
- sessions re-ordered to trading day
- 1 hour pre-market zones added (there is none for Australia as that is the start of the Forex day)
- modified transparency settings to make it more subtle
- default on are Asia open and New York open + their respective 1 hour Pre-Market

MIX: YL/YH- 3 sessions Day change-5 EMAS for FXCM by BlackwolfThis is a multi script: it shows the day session from midnight to midnight, asia - europe- america sessions , Yesterday Hi & yesterday Low and 5 EMAS at 5,13,50,200,800
Rome Time Based for FXCM Broker

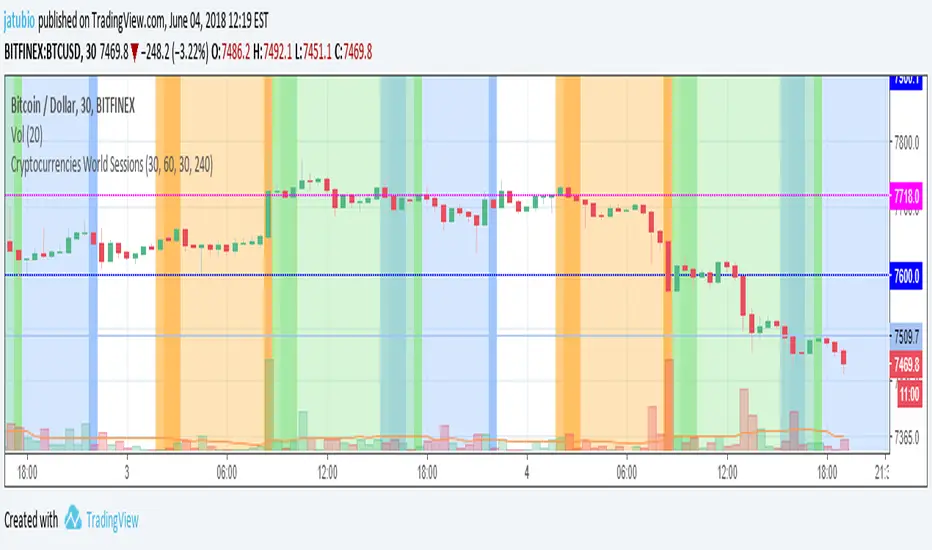
Cryptocurrencies World SessionsEste indicador cambia los colores del fondo para identificar zonas horarias relacionadas con las sesiones de trading en criptomonedas.
Se muestran las sesiones de: America (Nueva York), Europa (Londres) y Korea (Seúl)
Además de mostrar la duración de la sesión, se pueden configurar intervalos para resaltar (en minutos): Antes de la apertura, después de la apertura y antes del cierre.
-----------------------------------------------------------------------------------
This indicators show background colours to identify world timezones about to cryptocurrencies trading sessions
These sessions are shown: USA (New York), Europe (London) and Korea (Seoul).
In addition to show the duration of the session, you can set intervals to be highlighted (in minutes): Before opening, after opening, before closing.
Timezone Sessions IndicatorBasic timezones and sessions indicator
I have mine collapsed down to a minimum height and it serves only to indicate the time in a more visual way.

Forex Trading Sessions with Daylight Savings TimeV1 - Max WarrenDifferent version of the CM one but everything is configurable and easy to manage.
Daylight savings may also be toggled, I cannot automatically toggle it yet but hopefully with a pine update I will be able to.
It had the four main sessions but version two could possibly have all of them as optional toggles
Hope it is useful

Market Structure BOS - Session Based (5m, NY Time) This indicator visualizes market structure using a strict, rule-based
Break of Structure (BOS) logic, calculated on the 5-minute timeframe
and evaluated in New York time.
The script detects swing Highs and Lows based on candle direction
(bullish → bearish for Highs, bearish → bullish for Lows). From each
validated structure point, a horizontal level is drawn at the true
price extreme (wick included). Once created, structure levels never
repaint or move.
A Break of Structure is confirmed only when a candle CLOSES beyond
the most recent valid structure level:
- Bullish BOS: close above the latest High
- Bearish BOS: close below the latest Low
The indicator is trend-aware: once a bullish or bearish BOS is confirmed,
only BOS signals in the same direction are shown until the trend changes.
This prevents duplicate or redundant structure breaks during trends.
Session logic is fully integrated and based on New York time:
- Asia
- London (with pre-open range)
- New York (with pre-open range)
Structure levels and BOS logic can optionally reset at the end of each
New York trading day, keeping the chart clean and session-relevant.
The indicator is designed for traders who focus on intraday price action,
market structure, and session-based behavior without visual clutter.
No labels, alerts, or signals are plotted — only clean structure levels.

Intraday Session Ranges (Asian-London-NY) - JonathanJD86This script is a technical utility designed to automatically track and visualize the high and low price levels of the three major trading sessions (Asian, London, and New York).
How it works: The script uses the time() function with the America/New_York timezone anchor to ensure accuracy regardless of the user's local time. It tracks the maximum and minimum price values during specific user-defined intervals.
Key Methodology:
Vertical Tick Offset: Unlike standard session boxes, this tool allows users to set a vertical gap (in ticks) so that the labels do not overlap the candle wicks, providing a clearer view of the actual price action.
Session Intervals: Defaulted to high-activity windows: Asian (20:00-00:00), London (02:00-05:00), and New York (08:30-16:00).
Dynamic Visibility: The script includes a logical check to automatically hide levels on timeframes higher than 1H, preventing chart clutter during macro analysis.

Dual Session VWAPSeparate VWAP with 1 standard deviation band for the regular session as well as electronic session

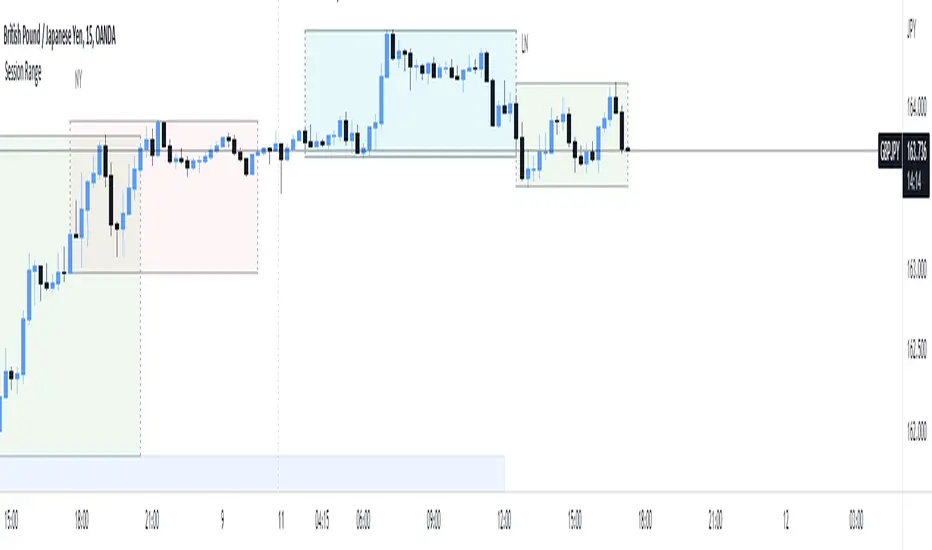
Fx Session RangeHello traders ,as you know the session timing plays a major role in trade execution.
I was searching for a good session indicator for a very long time but I was not satisfied with the indicators which are already available on Trading view. So I decided to code one my self.
This indicator is based on the timing provided by the website www.forex.timezoneconverter.com and time is set according to Ney York time zone.
I have added almost all major sessions including (Sydney , Tokyo and Frankfurt) and almost all features which I could.
I hope you guys 👍this indicator .
Incase you notice any bug or want any features added, let me know in comment section or you can Dm me as well.
Thank you all , enjoy :D
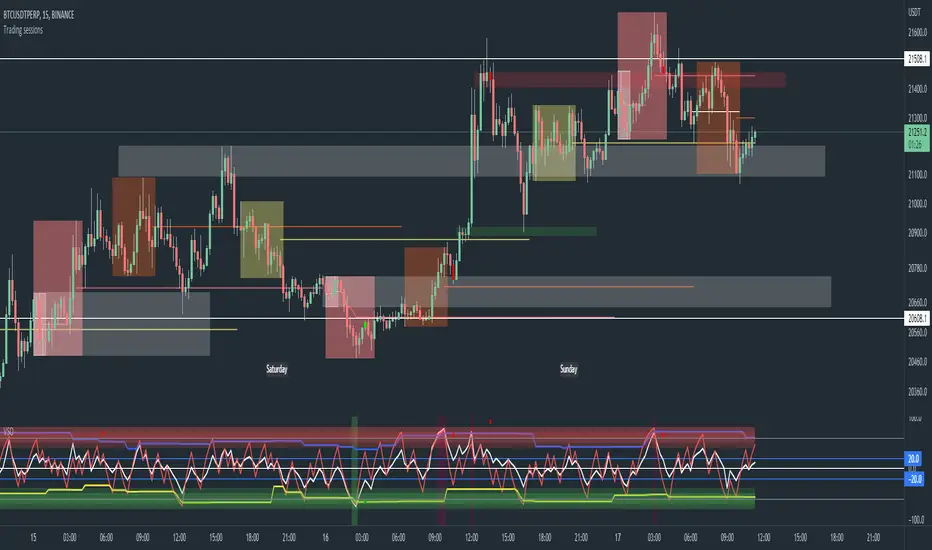
Trading sessions, Ichimoku and Classic Pivots█ OVERVIEW
This a self contained intraday trading style for crypto/forex made to be on and traded on 15-min.
This Script Creates a box around each major session to a trading range, include highlights for the first 12 15-min candles, classic Pivot points and ichimoku cloud.
█ CONCEPTS
1 — Session boxes and ranges are based of the times from Steve from Beat the market maker, and you have the option in setting to have an extension for the high/low until the start of the next box calculation.
2 — 12 candle window, this marks the first 3 hours after a open;
The first hour - stop hunt
The second hour - big moves
The third hour - tend continuation or reversal
3 — The Days of the weeks are labelled and coloured;
Weekends are in grey, ideally no trade days.
Monday, Tuesday, Thursday are green, to mark the week days
Wednesday is red to be mindful of mid week reversal
Friday is red to mark the end of week
4 — Ichimoku cloud, by default the only thing visible is the kumo cloud, but in setting you can turn the line back on. Ichimoku proves a great mark for areas to look for support and resistances.
5 — Lastly, you have classic pivots, by default they are extend to the right and on weekly, Each level act as support and resistance. Look for Bullish momentum at R3 for a larger moves to the upside.
Ichimoku and the pivot are here mainly for when you want to do higher time frame analysis.
█ OTHER SECTIONS
• HOW TO USE
Example of a trade
**Key thing to remember is London will set the high in a down trend and the low in an up trend
you can see the first hour look for stops and stopped at 50% of the range set coming into the session, the second hour a big move to the down side hitting 200% expansion then the third hour reversal stopping wick up then
back down from from London low. before continuing down.
• LIMITATIONS: I have not test this on Stock, as I have a different strategies for those market
• NOTES : I know a lot of people have moving averages on their chart, I have another separate one with all MA types, and it something that will not fit into one script, Other things you can add with this Bollinger bands, and
fib tool with 50%, 100%, 150% and 200%
[PX] Session LevelHello guys,
this scripts prints the high and low as well as the moving average of a user-defined session.
How does it work?
Basically, as soon as we are in the session range, the indicator will constantly keep track of the high and the low of this range. It also prints the moving average, which can either be a floating or a static line, that represents the latest MA value.
The indicator comes with multiple options to style the printed lines.
If you find this indicator useful, please leave a "like" and hit that "follow" button :)
Have fun and happy trading :)))
P.S: Check my signature if you want to get in touch with me.

Pre-session rangeSimple tool to capture high and low of pre-session period (not restricted to stock market, by any means!) and then plotting it on your trading session time.

