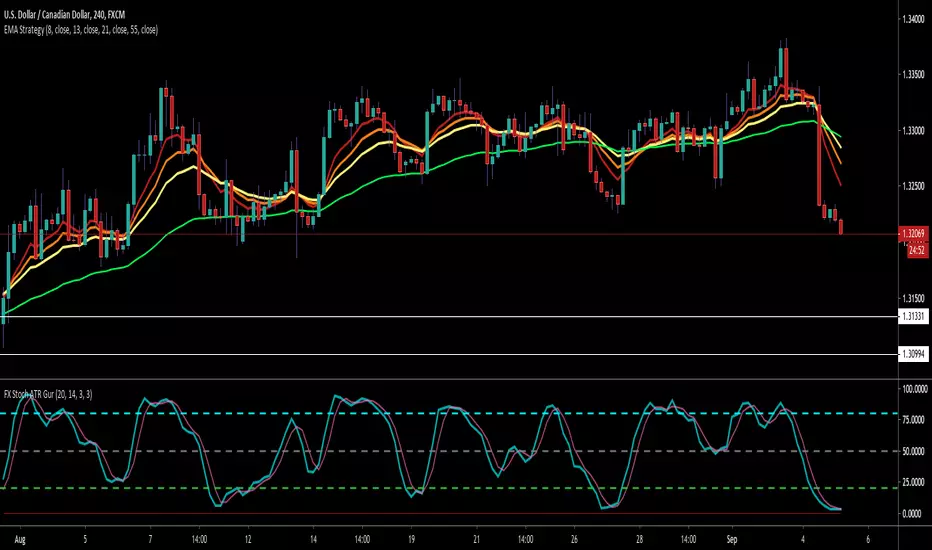
Trend Follow with kijun-sen/tenkan sen for 1 Hour SPX
This script determines, plots and alerts on probable trend initiation and continuation points, using tenkan-sen(conversion line of ichimoku), kijun-sen(baseline of ichimoku) and stochastic RSI, for 1 H SPX.
New long/short trend initiates when prices cross above/below kijun sen. The trend continues when prices cross above/below tenkan-sen or stochastic RSI crosses up/down its signal line, while prices are above/below kijun-sen.
It is good to take partial profit between 10-15 points gain and trail the left with stops below kijun-sen line.
While placing the order, using 2-3 points buffer above/below of signal bars is recommended. Additionally, please be careful about clouds and do not place long/short orders below/above clouds.
Tìm kiếm tập lệnh với "stoch"


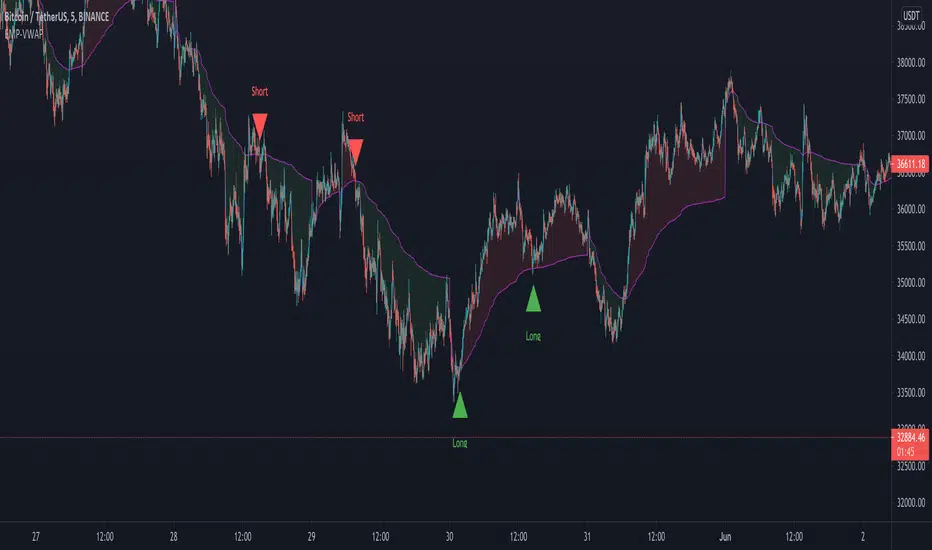
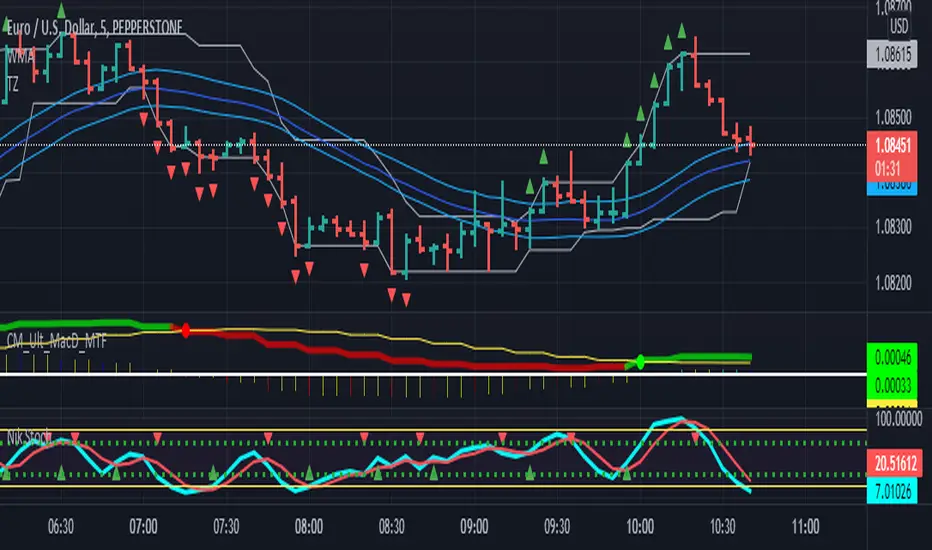
EmperorBTC's VWAP IndicatorThis indicator was created after EmperorBTC's conditions. Conditions displayed below:
Good timeframes for it: 30', 15', 5'
To convert from strategy to study switch the commented lines in the beginning and at the end of the script
What this indicator does is:
1) Check if Pivot Point was crossed
2) Stoch-RSI and VWAP were crossed up in current or previous candle
3) Candle (or previous candle) is green
Then, it will plot a Long opportunity.
FUTURE IDEAS:
- Volume Expansion
- Candle Stick patterns
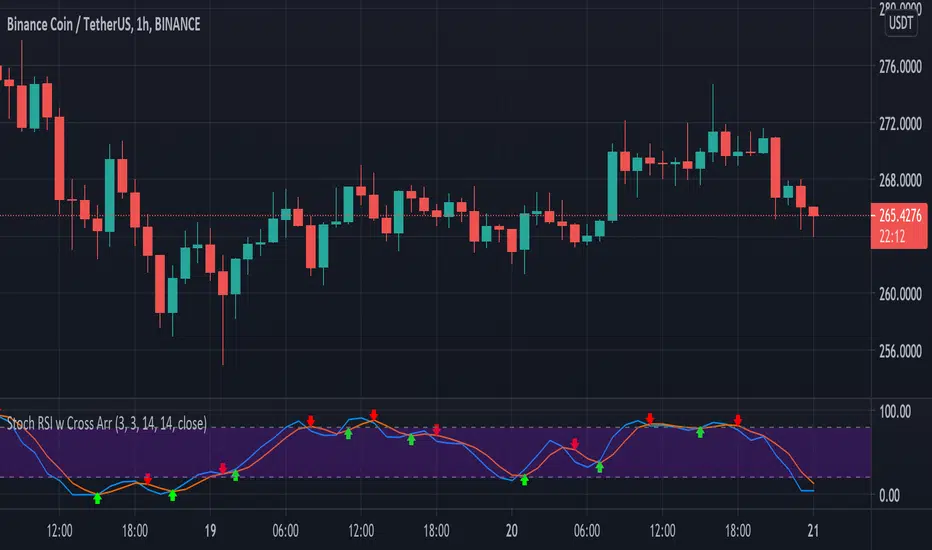
Stochastic RSI with Crossover ArrowsThe Stochastic RSI indicator (Stoch RSI) is essentially an indicator of an indicator. It is used in technical analysis to provide a stochastic calculation to the RSI indicator. This means that it is a measure of RSI relative to its own high/low range over a user defined period of time. The Stochastic RSI is an oscillator that calculates a value between 0 and 1 which is then plotted as a line. This indicator is primarily used for identifying overbought and oversold conditions.
In this update, crossover arrows helps your trade.
Xiang Stoch MACD 200EMAStochastic + MACD + 200 EMA indicator
Green flag
1) MACD crossover Signal line
2) Stochastic in oversold region (=80)
3) Below 200 EMA (direction of trend)
I use 200 EMA to determine the direction of the trend, (can ignore point 3 for both flag if you got other ways).
If green flag, high possibility of market going up.
If red flag, high possibility of market going down.

Jinqian168_V2RSI, EMA of RSI, EMA of RSI's EMA, and Stochastic.
V2 added Price Bar Coloring. Buy when Orange or Green, Sell when Yellow or Red.


Bullish Divergence SMI Base & Trigger with ATR FilterDescription:
A bullish divergence indicator combining the Stochastic Momentum Index (SMI) and Average True Range (ATR) to pinpoint high-probability entries:
1. Base Arrow (Orange ▲):
• Marks every SMI %K / %D bullish crossover where %K < –70 (deep oversold)—the first half of the divergence setup.
• Each new qualifying crossover replaces the previous base, continuously “arming” the divergence signal.
• Configurable SMI lookbacks, oversold threshold, and a base timeout (default 100 days) to clear stale bases.
2. Trigger Arrow (Green ▲):
• Completes the bullish divergence: fires on the next SMI bullish crossover where %K > –60 and price has dropped below the base arrow’s close by at least N × ATR (default 1 × 14-day ATR).
• A dashed green line links the base and trigger to visually confirm the divergence.
• Resets after triggering, ready for a new divergence cycle.
Inputs:
• SMI %K Length, EMA Smoothing, %D Length
• Oversold Base Level (–70), Trigger Level (–60)
• ATR Length (14), ATR Multiplier (1.0)
• Base Timeout (100 days)
Ideal for any market, this study highlights genuine bullish divergences—oversold momentum crossovers that coincide with significant price reactions—before entering long trades.

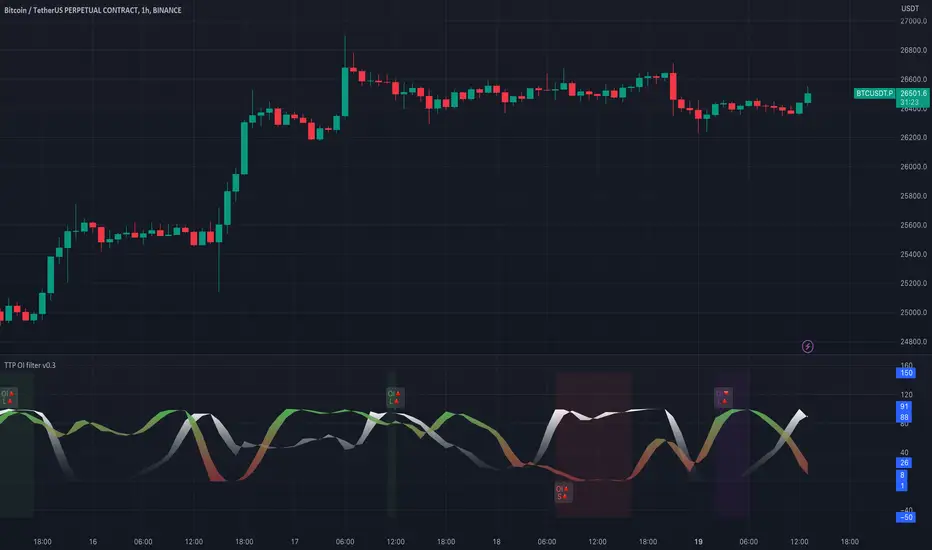
TTP OI + LS signal filterThis oscillator helps filtering specific conditions in the market based on open interest (OI) and the ratio of longs and shorts (LS) for crypto assets.
Currently it works with BINANCE:BTCUSDT.P but soon I'll be adding support for more assets.
It flags areas of interest like:
- Too many longs, too many shorts in the market
- Open interest too high or too low
It accepts an external signal as a source in which case filters can be applied to the original signal. For example the external signal might trigger and plot a 1 when RSI break below 70. By connecting such signal with this oscillator you'll be able to only pass-through the ones that occur when any of the areas of interest mentioned above are also valid.
If both filter are applied it acts as an OR. For example, if too many longs and too many shorts are active, it will pass through the signal in either condition.
The results of the original signal filtered is printed to be able to later use it in any external backtester strategy that accepts external sources too.
If external source signal is disabled it will trigger any time the combined filters are returning true.
Open interest and the ratio of longs/shorts is considered too high whenever the stochastic RSI calculation of the OI or ratio LS reaches a level above 80 and too low when below 20
The ratio of long/shorts is calculated by dividing the ratio of longs vs shorts from BITFINEX:BTCUSDLONGS and BITFINEX:BTCUSDSHORTS
Stochastic with Oversold/Overbought levels colorModification of original Stochastic covering:
dynamic color of smoothed Stoch if overbought or oversold levels reached
added inputs to Settings to define Oversold/Overbought levels dynamically
removed color fill what only makes indicator harder to read

Bollinger Band Reversal StudyThis strategy was inspired by ParallaxFX.
This strategy attempts to predict when a price reversal will happen. It uses bollinger bands, stochastics and candle formations.
The idea is that when an indecision candle, such as a doji, crosses outside the bollinger bands, then is followed by another candle that pushed sharply back inside the bands, you have a setup.
These setups are marked with green arrows to go long and red arrows to go short. Wait until the next candle begins before acting. The arrow may come and go as the price fluctuates, so wait until the candle closes.
Another play is when the same setup occurs, but on the middle bollinger band instead of the outer band.
These setups are marked with blue arrows to go long and yellow arrows to go short. Wait until the next candle begins before acting. The arrow may come and go as the price fluctuates, so wait until the candle closes.
Closing can happen a number of ways. You can use a predetermined risk-reward or look to sell when the price reaches another band.
In summary.
Go long when a green or blue arrow appears.
Go Short when a red or yellow arrow appears.
Green arrows show signs of reversal from lower BB.
Blue arrows show signs of reversal from middle BB.
Red arrows show signs of reversal from upper BB.
Yellow arrows show signs of reversal from middle BB.
Wait for candle with arrow to close before taking trade.

Sto RSI and kijun-sen line to determine and follow the trend This script uses 25-75 treshold of stochastic RSI with the help of kijun-sen as confirmation, to find entry points to any trend either newly developed or an established one. I just realized it on the 1 hour SPX chart. Sure it can be used on other symbols. Crossing above/below 25/75 line of sto RSI is considered as buy/sell signal. Signals are evaluated whether price be above/below kijun-sen line. If a sell signal below kijun-sen is generated it is a continuation signal for downtrend, otherwise it is a countertrend signal (maybe a signal for a new downtrend). A countertrend signal must be evaluated carefully and only accepted in the right side of kijun-sen. e.g entering a sell signal generated above kijun-sen should be accepted only below the kijun-sen, vice-versa.

rsi_with_stochrsi_[j15] v2This is version 2 of the combined indicator RSI and Stochastic RSI. Added intersection of lines k and d, as well as suppression of the upper and lower lines

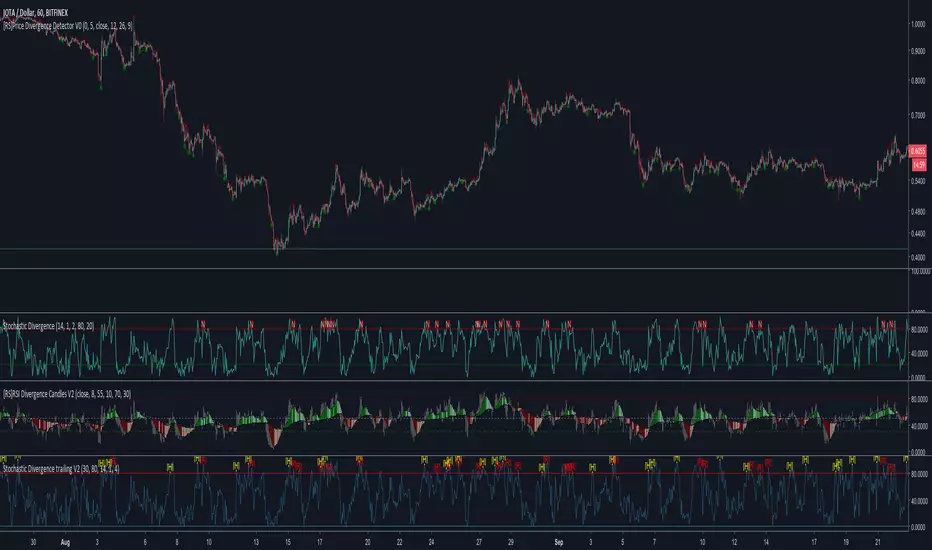
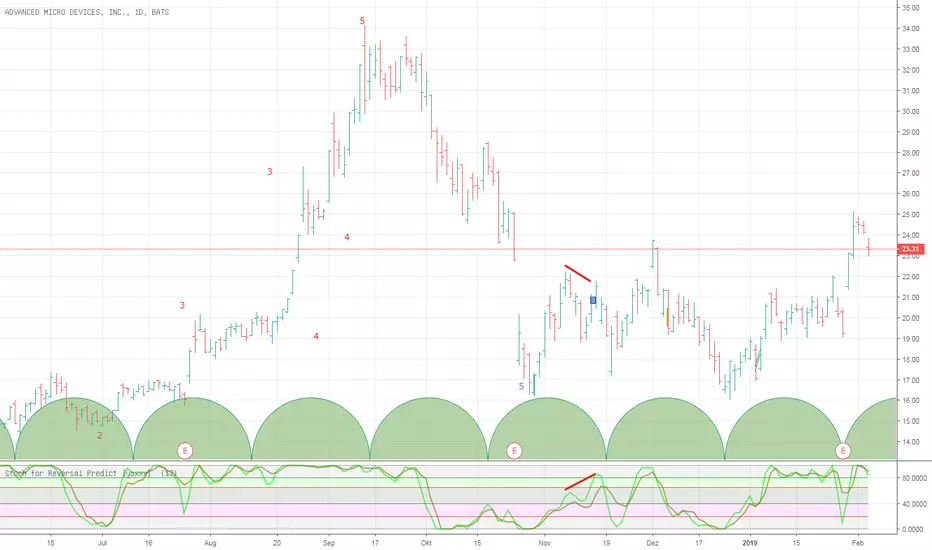
Stochastic for Reversal Predict [yoxxx] Usable for all markets, all time frames. (The bull bear sup/res lines are specific for stocks, but differ just a little to other instruments.)
This script is more likely a method support than a study - and your exit from the default stochastic club:
Most people use Stoch for ins and outs by 20 rsp 80 (a default behavior MM know well to deal with). C.G. Lane, the inventor of this indicator,
however used it to find divergences with quote (price / close) to predict reversals. Constance Brown refined this method by laying
a fix time cycle underneath the chart that is in rhythm with specific highs or lows of a stock or an index.
The length of one cycle divided by 2 equals the proper value for %D specified for that stock /index. The script offers an input for this specific value.
C. Brown stresses that good signals are only given within the bull or bear ranges (20-65 for bear markets, 40-80 for bull markets).
For your convenience, I laid these areas underneath the graphs. You can automate the divergence research (relative to quote)
by using my script "Bull Bear Divergence Indicator". Feedback welcome. Have fun and success.


Stochastics + CM Williams VixFix (Simple Buy Signal)📈 Stochastics + CM Williams VixFix (Simple Buy Signal)
This indicator combines two powerful tools to detect potential bottoming opportunities:
✅ Stochastics: Looks for momentum reversals. A signal is triggered when both %K and %D are below the oversold threshold (default: 20), suggesting the asset is deeply oversold.
✅ CM Williams Vix Fix: A volatility-based fear detector. When it spikes above its dynamic threshold, it indicates potential panic selling — often preceding a market bounce.
💡 Buy Signal is generated when:
%K and %D are both below 20
VixFix shows a volatility spike (green condition)
Use this script to identify high-probability reversal setups, especially during market corrections or panic phases.
Stochastic RSI with CrossesThis is the same Indicator on tradingview I just added a trigger for crosses for clarity. It has alerts and now you can clearly see who the STOCH/ RSI crosses.

Stochastic RSI Strategy with Inverted Trend LogicOverview:
The Stochastic RSI Strategy with Inverted Trend Logic is a custom-built Pine Script indicator that leverages the Stochastic RSI and a 200-period moving average to generate precise buy and sell signals. It is specifically designed for traders looking to capture opportunities during short-term market movements while factoring in broader trend conditions.
Key Components:
Stochastic RSI:
Stochastic RSI is a momentum indicator that applies stochastic calculations to the standard Relative Strength Index (RSI), rather than price data. This makes it particularly sensitive to market momentum changes, which is essential for timing entries and exits.
K Line and D Line: The indicator calculates and smooths both the K and D lines to capture momentum shifts more accurately.
200-Period Moving Average:
The 200-period Simple Moving Average (SMA) is used as a trend filter.
If the price is above the 200-period SMA, the trend is considered bullish.
If the price is below the 200-period SMA, the trend is considered bearish.
Inverted Trading Logic:
The trading logic is inverted from traditional strategies:
Long trades are executed only when the market is in a bearish trend (price below the 200-period moving average).
Short trades are executed only when the market is in a bullish trend (price above the 200-period moving average).
This inversion allows traders to take advantage of potential trend reversals by entering positions in the opposite direction of the prevailing trend.
Trading Rules:
Long Trade Conditions (Buy Signal):
The Stochastic RSI K line must be below 5 for 4 consecutive candles (oversold condition).
The price must be below the 200-period SMA (indicating a bearish trend).
Once these conditions are met, the indicator will generate a buy signal on the close of the 4th candle.
Exit Condition: The long position is exited when the Stochastic RSI K line crosses above 50 (neutral level).
Short Trade Conditions (Sell Signal):
The Stochastic RSI K line must be above 95 for 4 consecutive candles (overbought condition).
The price must be above the 200-period SMA (indicating a bullish trend).
Once these conditions are met, the indicator will generate a sell signal on the close of the 4th candle.
Exit Condition: The short position is exited when the Stochastic RSI K line crosses below 50.
Visual Signals on the Chart:
Buy Signal:
A green triangle below the bar is displayed on the chart when a buy condition is met, indicating a potential long trade opportunity.
The text "BUY" is displayed for further clarity.
Sell Signal:
A red triangle above the bar is displayed on the chart when a sell condition is met, indicating a potential short trade opportunity.
The text "SELL" is displayed for further clarity.
How to Use the Indicator:
Attach the Indicator: Apply the indicator to your desired chart (works on any time frame, but is optimized for short- to medium-term trading).
Monitor Signals: Watch for buy and sell signals on the chart:
Buy Signal: Enter long positions when a green triangle appears below the candle.
Sell Signal: Enter short positions when a red triangle appears above the candle.
Exit Positions: Exit long positions when the Stochastic RSI crosses above the 50 level, and exit short positions when the Stochastic RSI crosses below the 50 level.
Indicator Display:
Stochastic RSI: A visual representation of the Stochastic RSI (K and D lines) is plotted below the price chart, with overbought (100), midpoint (50), and oversold (0) levels clearly marked.
200-period SMA: The 200-period moving average is plotted on the price chart, giving a clear indication of the broader trend direction (orange line).
Key Benefits:
Reversal Opportunities: This strategy allows traders to capture reversal trades by using an inverted logic where longs are taken in bearish conditions and shorts are taken in bullish conditions. This can help capitalize on potential trend exhaustion and reversals.
Clear and Simple Rules: The use of Stochastic RSI and the 200-period moving average ensures the strategy remains simple yet effective, making it easy for traders to follow.
Visual Alerts: The indicator provides clear buy and sell signals, making it easy for traders to spot trading opportunities in real-time without needing to monitor multiple conditions manually.
Limitations and Considerations:
Trend Changes: Since the strategy is designed to work during trend reversals, it might not perform as well during strong, prolonged trends where price continues moving in one direction without significant pullbacks.
Time Frame Suitability: While the indicator works on any time frame, shorter time frames may result in more frequent signals and higher trade frequency, whereas higher time frames will provide fewer but potentially stronger signals.
Conclusion:
The Stochastic RSI Strategy with Inverted Trend Logic is a powerful tool for traders looking to capture market reversals by entering trades against the prevailing trend direction based on momentum exhaustion. Its simple and clear logic, combined with easy-to-understand visual signals, makes it a versatile indicator for both novice and experienced traders.

Stochastic Momentum Channel with Volume Filter [IkkeOmar]A stochastic version of my momentum channel volume filter
The "Stochastic Momentum" indicator combines the concepts of Stochastic and Bollinger Bands to provide insights into price momentum and potential trend reversals. It can be used to identify overbought and oversold conditions, as well as potential bullish and bearish signals.
The indicator calculates a Stochastic RSI using the RSI (Relative Strength Index) of a given price source. It applies smoothing to the Stochastic RSI values using moving averages to generate two lines: the %K line and the %D line. The %K line represents the current momentum, while the %D line represents a filtered version of the momentum.
Additionally, the indicator plots Bollinger Bands around the moving average of the Stochastic RSI. The upper and lower bands represent levels where the price is considered relatively high or low compared to its recent volatility. The distance between the bands reflects the current market volatility.
Here's how the indicator can be interpreted:
Stochastic Momentum (%K and %D lines):
When the %K line crosses above the %D line, it suggests a potential upward move or bullish momentum.
When the %K line crosses below the %D line, it indicates a potential downward move or bearish momentum.
The color of the plot changes based on the relationship between the %K and %D lines. Green indicates %K > %D, while red indicates %K < %D.
Bollinger Bands (Upper and Lower Bands):
When the price crosses above the upper band, it suggests an overbought condition, indicating a potential reversal or pullback.
When the price crosses below the lower band, it suggests an oversold condition, indicating a potential reversal or bounce.
To identify potential upward moves, consider the following conditions:
If the price is not in a contraction phase (the bands are not narrowing), and the price crosses above the lower band, it may signal a potential upward move or bounce.
If the %K line crosses above the %D line while the %K line is below the upper band, it may indicate a potential upward move.
To identify potential downward moves, consider the following conditions:
If the price is not in a contraction phase (the bands are not narrowing), and the price crosses below the upper band, it may signal a potential downward move or pullback.
If the %K line crosses below the %D line while the %K line is above the lower band, it may indicate a potential downward move.
Code explanation
Input Variables:
The input function is used to create customizable input variables that can be adjusted by the user.
smoothK and smoothD are inputs for the smoothing periods of the %K and %D lines, respectively.
lengthRSI represents the length of the RSI calculation.
lengthStoch is the length parameter for the stochastic calculation.
volumeFilterLength determines the length of the volume filter used to filter the RSI.
Source Definition:
The src variable is an input that defines the price source used for the calculations.
By default, the close price is used, but the user can choose a different price source.
RSI Calculation:
The rsi1 variable calculates the RSI using the ta.rsi function.
The RSI is a popular oscillator that measures the strength and speed of price movements.
It is calculated based on the average gain and average loss over a specified period.
In this case, the RSI is calculated using the src price source and the lengthRSI parameter.
Volume Filter:
The code calculates a volume filter to filter the RSI values based on the average volume.
The volumeAvg variable calculates the simple moving average of the volume over a specified period (volumeFilterLength).
The filteredRsi variable stores the RSI values that meet the condition of having a volume greater than or equal to the average volume (volume >= volumeAvg).
Stochastic Calculation:
The k variable calculates the %K line of the Stochastic RSI using the ta.stoch function.
The ta.stoch function takes the filtered RSI values (filteredRsi) as inputs and calculates the %K line based on the length parameter (lengthStoch).
The smoothK parameter is used to smooth the %K line by applying a moving average.
The d variable represents the %D line, which is a smoothed version of the %K line obtained by applying another moving average with a period defined by smoothD.
Momentum Calculation:
The kd variable calculates the average of the %K and %D lines, representing the momentum of the Stochastic RSI.
Bollinger Bands Calculation:
The ma variable calculates the moving average of the momentum values (kd) using the ta.sma function with a period defined by bandLength.
The offs variable calculates the offset by multiplying the standard deviation of the momentum values with a factor of 1.6185.
The up and dn variables represent the upper and lower bands, respectively, by adding and subtracting the offset from the moving average.
The Bollinger Bands provide a measure of volatility and can indicate potential overbought and oversold conditions.
Color Assignments:
The colors for the plot and Bollinger Bands are assigned based on certain conditions.
If the %K line is greater than the %D line, the plotCol variable is set to green. Otherwise, it is set to red.
The upCol and dnCol variables are set to different colors based on whether the fast moving average (fastMA) is above or below the upper and lower bands, respectively.
Plotting:
The Stochastic Momentum (%K) is plotted using the plot function with the assigned color (plotCol).
The upper and lower Bollinger Bands are plotted using the plot function with the respective colors (upCol and dnCol).
The fast moving average (fastMA) is plotted in black color to distinguish it from the bands.
The hline function is used to plot horizontal lines representing the upper and lower bands of the Stochastic Momentum.
The code combines the Stochastic RSI, Bollinger Bands, and color logic to provide visual representations of momentum and potential trend reversals. It allows traders to observe the interaction between the Stochastic Momentum lines, the Bollinger Bands, and price movements, enabling them to make informed trading decisions.
