electroNIK - Stoch-RSIThis is a script which will add Stochastic RSI on your graphs, supporting all timeframes
Tìm kiếm tập lệnh với "stoch"

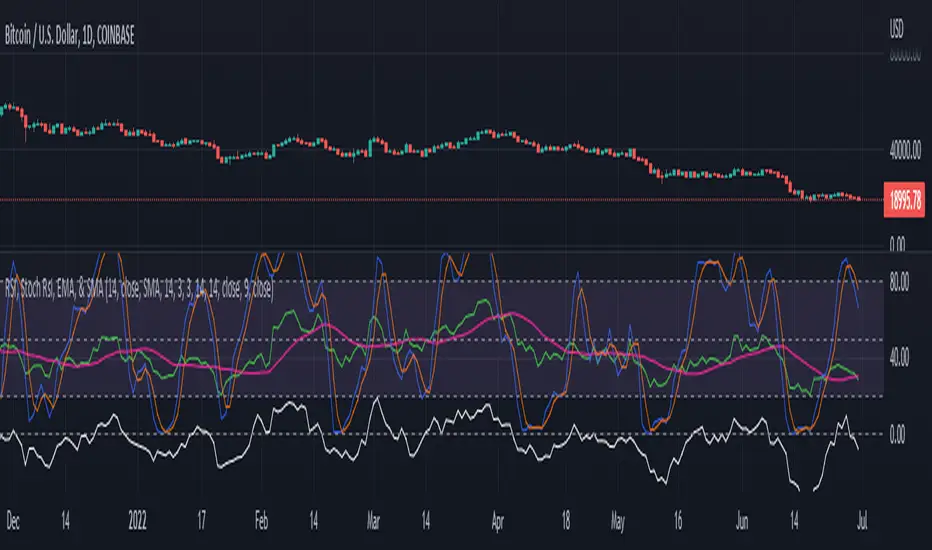
RSI, Stoch Rsi, EMA, SMA, & ROCThis indicator is simply an enhanced version of the RSI followed up by a few extra indicators that pair strongly with the RSI. This indicator allows the user to interact with various inputs based off the indicators provided. All indicators include moving average, relative strength index, stochastic relative strength index, simple moving average, exponential moving average, and rate of change. This program is unique as it is very versatile allowing the user to use as little or as many indicators as needed interchangeably.
Reverse Stoch [BApig Gift] - on PanelMssive credit to Motgench, Balipour and Wugamlo for this script. This script is all of their good work.
It is basically just the non-on chart version which I've slightly tweaked off their script. This can be useful to reduce the clutter on the chart itself. Releasing it in the hope that it can be useful for the community
Enjoy!

EL Fly Candle (spinning top) by Epullemanhighlight spinning top candle with alerted volume > vol sma 20 and stoch above 50

[ProfitTrailer:Feeder] Stochastics Just like RSI the Stochastics Indicator is very often used in ProfitTrailer:Feeder and therefore I decides to create this script so people can easily test/tryout there specific inputs.
Note: Because there's a difference (in outcome) between the calculation function from TV and the traditional calculation (used by ProfitTrailer) I created an option to select the kind of calculation you prefer.
Enjoy!

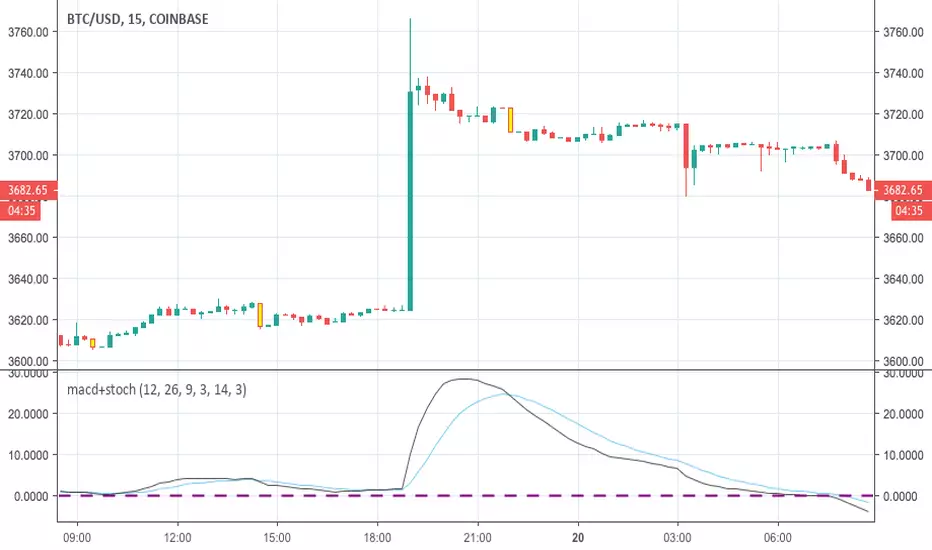
Simple strategy IndicatorHello, this is my Indicator, based on my MACD+RSI+Stoch trading strategy
You can use it by your own and try to apply it on any market
Please, adjust any parameters and don't forget to leave a feedback and comments

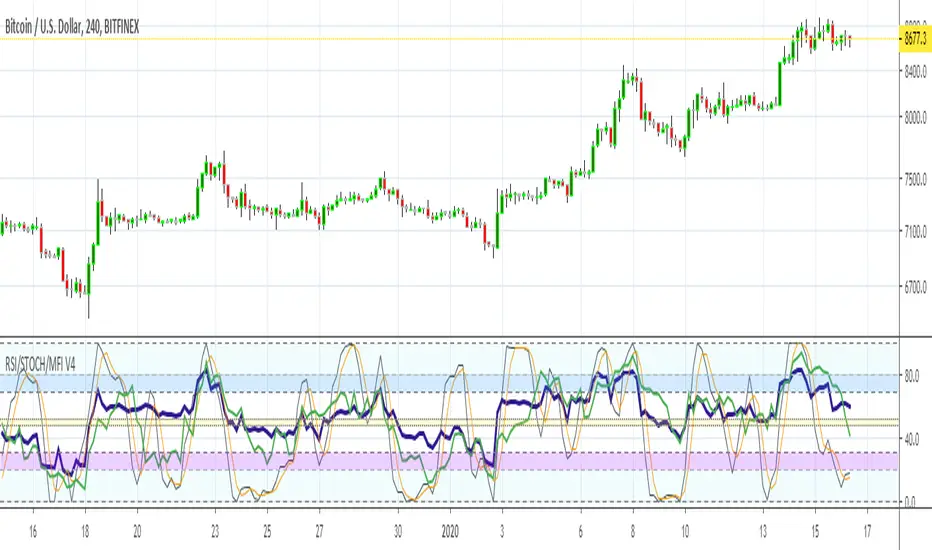
RSI + RSI STOCHASTIC + MFICombines: Relative Strength (purple) and RSI Stoch (Orange/gray), Money Flow (green) all in one indicator window.

Bilateral Stochastic Oscillator - For The Sake Of EfficiencyIntroduction
The stochastic oscillator is a feature scaling method commonly used in technical analysis, this method is the same as the running min-max normalization method except that the stochastic oscillator is in a range of (0,100) while min-max normalization is in a range of (0,1). The stochastic oscillator in itself is efficient since it tell's us when the price reached its highest/lowest or crossed this average, however there could be ways to further develop the stochastic oscillator, this is why i propose this new indicator that aim to show all the information a classical stochastic oscillator would give with some additional features.
Min-Max Derivation
The min-max normalization of the price is calculated as follow : (price - min)/(max - min) , this calculation is efficient but there is alternates forms such as :
price - (max - min) - min/(max - min)
This alternate form is the one i chosen to make the indicator except that both range (max - min) are smoothed with a simple moving average, there are also additional modifications that you can see on the code.
The Indicator
The indicator return two main lines, in blue the bull line who show the buying force and in red the bear line who show the selling force.
An orange line show the signal line who represent the moving average of the max(bull,bear), this line aim to show possible exit/reversals points for the current trend.
Length control the highest/lowest period as well as the smoothing amount, signal length control the moving average period of the signal line, the pre-filtering setting indicate which smoothing method will be used to smooth the input source before applying normalization.
The default pre-filtering method is the sma.
The ema method is slightly faster as you can see above.
The triangular moving average is the moving average of another moving average, the impulse response of this filter is a triangular function hence its name. This moving average is really smooth.
The lsma or least squares moving average is the fastest moving average used in this indicator, this filter try to best fit a linear function to the data in a certain window by using the least squares method.
No filtering will use the source price without prior smoothing for the indicator calculation.
Relationship With The Stochastic Oscillator
The crosses between the bull and bear line mean that the stochastic oscillator crossed the 50 level. When the Bull line is equal to 0 this mean that the stochastic oscillator is equal to 0 while a bear line equal to 0 mean a stochastic oscillator equal to 100.
The indicator and below a stochastic oscillator of both period 100
Using Levels
Unlike a stochastic oscillator who would clip at the 0 and 100 level the proposed indicator is not heavily constrained in a range like the stochastic oscillator, this mean that you can apply levels to trigger signals
Possible levels could be 1,2,3... even if the indicator rarely go over 3.
Its then possible to create strategies using such levels as support or resistance one.
Conclusion
I've showed a modified stochastic oscillator who aim to show additional information to the user while keeping all the information a classical stochastic oscillator would give. The proposed indicator is no longer constrained in an hard range and posses more liberty to exploit its scale which in return allow to create strategies based on levels.
For pinescript users what you can learn from this is that alternates forms of specific formulas can be extremely interesting to modify, changes can be really surprising so if you are feeling stuck, modifying alternates forms of know indicators can give great results, use tools such as sympy gamma to get alternates forms of formulas.
Thanks for reading !
If you are looking for something or just want to say thanks try to pm me :)

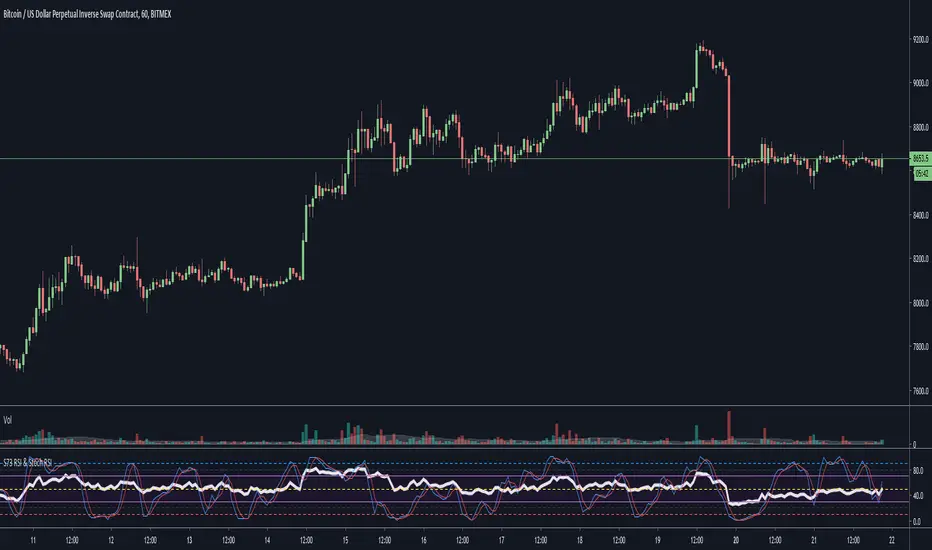
S73 RSI & Stoch RSIRSI and Stoch RSI combined into 1.
Get 2 for the price of 1.
Stoch RSI has two extra h lines, 10 an 90, as well as the traditional 20 and 80.
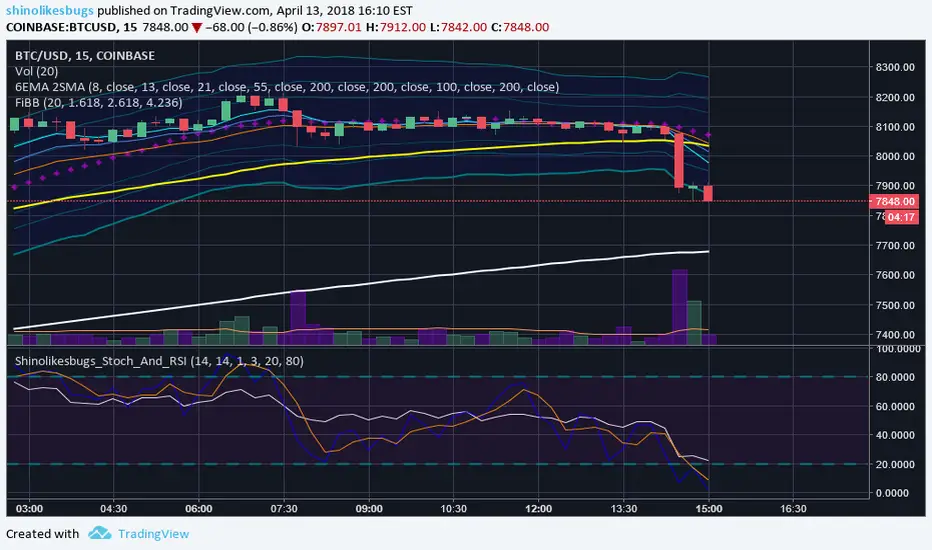
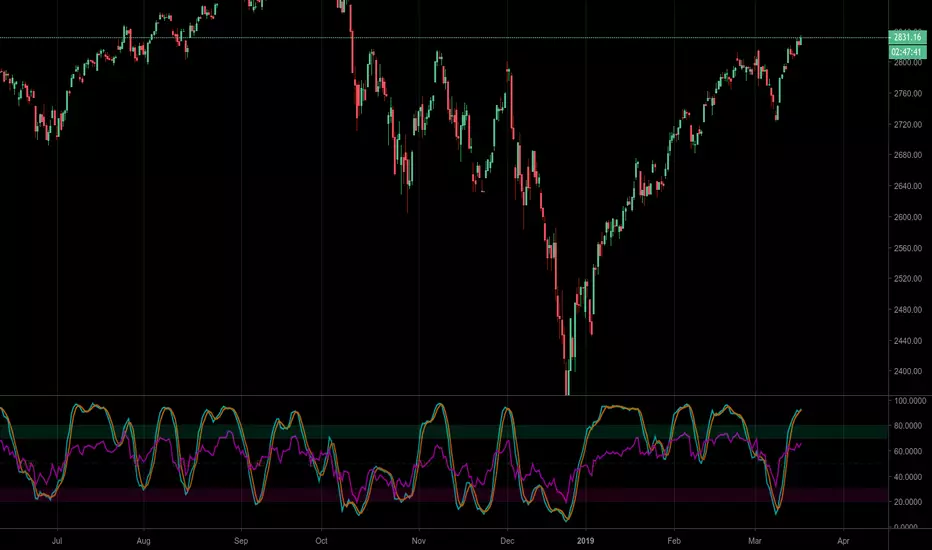
Remember, High Stoch RSI can mark the strength of a trend, doesn't necessarily mean there will be a change in trend once top and bottom levels are hit.
Click here to see how BTC has been topped out between levels of 90-100 for 14 weeks on the weekly chart.
VolumeS as stochv1just to show a concept . I use volume S to make it as stoch and add to it MTF function
B=buy
S=sell
D=down
if you do not like the MTF fuction just remove it from code or put the time frame of graph to be exact as MTF one
I did not add alert as it just a concept idea , to make it more complex it easy if you add more indicators to it and then compare the signals
have fun


Price Divergence Detector V3 revised by JustUncleLThis is a revised version of the original "Price Divergence Detector by RicardoSantos".
Description:
Price Divergence detection for various methods : RSI, MACD, STOCH, VOLUME, ACC-DIST, FISHER, CCI, BB %B and Ehlers IdealRSI. Both Hidden and Regular Divergences are detected.
Mofidifications:
Revision 3.0 by JustUncleL
Added option to disable/enable Hidden and Regular Divergence
Added new divergence method BB %B (close only)
Added new divergence mothos Ehlers IdealRSI (close only)
Revision 2.0 - by RicardoSantos
References:
Information on Divergence Trading:
www.babypips.com
www.incrediblecharts.com (BB %B)

Insync Index [LazyBear]BB Support + Histo mode
-------------------------------
Code: pastebin.com
Show enclosing BB
Show Insync as Histo:
v02 - Configurable levels
---------------------------------
Small update to allow configuring the 95/75/25/5 levels.
Latest source code: pastebin.com
v01 - orginal description
---------------------------------
Insync Index, by Norm North, is a consensus indicator. It uses RSI, MACD, MFI, DPO, ROC, Stoch, CCI and %B to calculate a composite signal. Basically, this index shows that when a majority of underlying indicators is in sync, a turning point is near.
There are couple of ways to use this indicator.
- Buy when crossing up 5, sell when crossing down 95.
- Market is typically bullish when index is above 50, bearish when below 50. This can be a great confirmation signal for price action + trend lines.
Also, since this is typical oscillator, look for divergences between price and index.
Levels 75/25 are early warning levels. Note that, index > 75 (and less than 95) should be considered very bullish and index below 25 (but above 5) as very bearish. Levels 95/5 are equivalent to traditional OB/OS levels.
The various values of the underlying components can be tuned via options page. I have also provided an option to color bars based on the index value.
More info: The Insync Index by Norm North, TASC Jan 1995
drive.google.com
List of my free indicators: bit.ly
List of my app-store indicators: blog.tradingview.com
(Support doc: bit.ly)

MTF Stoch RSI Confluence + Combined AlertMTF STOCH RSI CONFLUENCE INDICATOR 1m/5m/15m ( Scalping Indicator added on SRSI 1H)
IF all three Stoch are overbought(above 80) the indicator creates a red vertical line. If all Stoch are oversold(below 20) the indicator creates a green vertical line.
RULES!!!!
NEVER TRADE AGAINST THE TREND!!! This is super important!!!!
If 1H SRSI is above 80 with MTF overbouht and ZC is red (Downtrend) then we open a MR Short- (Prefered at PA Spikes) The same for opposites MR Longs.
If 1H SRSI is above 80 with the MTF oversold and ZC green then we can open a Long position. Prefered Momo Long. The same applies for opposite, hence momo short.

Kase Permission StochasticOverview
The Kase Permission Stochastic indicator is an advanced momentum oscillator developed from Kase's trading methodology. It offers enhanced signal smoothing and filtering compared to traditional stochastic oscillators, providing clearer entry and exit signals with fewer false triggers.
How It Works
This indicator calculates a specialized stochastic using a multi-stage smoothing process:
Initial stochastic calculation based on high, low, and close prices
Application of weighted moving averages (WMA) for short-term smoothing
Progressive smoothing through differential factors
Final smoothing to reduce noise and highlight significant trend changes
The indicator oscillates between 0 and 100, with two main components:
Main Line (Green): The smoothed stochastic value
Signal Line (Yellow): A further smoothed version of the main line
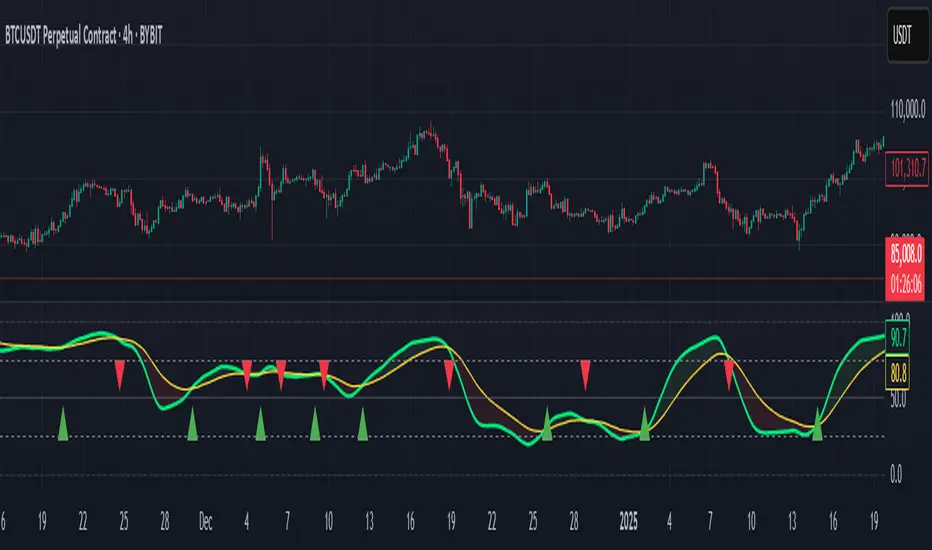
Signal Generation
Trading signals are generated when the main line crosses the signal line:
Buy Signal (Green Triangle): When the main line crosses above the signal line
Sell Signal (Red Triangle): When the main line crosses below the signal line
Key Features
Multiple Smoothing Algorithms: Uses a combination of weighted and exponential moving averages for superior noise reduction
Clear Visualization: Color-coded lines and background filling
Reference Levels: Horizontal lines at 25, 50, and 75 for context
Customizable Colors: All visual elements can be color-customized
Customization Options
PST Length: Base period for the stochastic calculation (default: 9)
PST X: Multiplier for the lookback period (default: 5)
PST Smooth: Smoothing factor for progressive calculations (default: 3)
Smooth Period: Final smoothing period (default: 10)
Trading Applications
Trend Confirmation: Use crossovers to confirm entries in the direction of the prevailing trend
Reversal Detection: Identify potential market reversals when crossovers occur at extreme levels
Range-Bound Markets: Look for oscillations between overbought and oversold levels
Filter for Other Indicators: Use as a confirmation tool alongside other technical indicators
Best Practices
Most effective in trending markets or during well-defined ranges
Combine with price action analysis for better context
Consider the overall market environment before taking signals
Use longer settings for fewer but higher-quality signals
The Kase Permission Stochastic delivers a sophisticated approach to momentum analysis, offering a refined perspective on market conditions while filtering out much of the noise that affects standard oscillators.
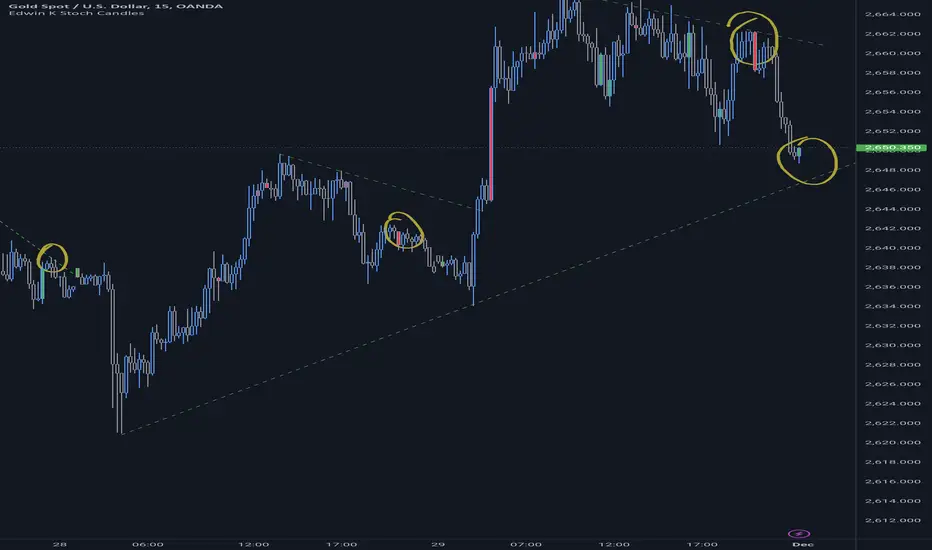
Edwin K Stochastic Candle ColorsThe Stochastic Candle Colors indicator highlights price action using candle colors based on signals from the stochastic oscillator. Here's how to use it:
1. Indicator Purpose
This indicator overlays on your price chart and changes candle colors based on stochastic oscillator signals:
Green candles: Indicate a bullish signal when the %K line crosses above the %D line in an oversold area (below 20).
Red candles: Indicate a bearish signal when the %K line crosses below the %D line in an overbought area (above 80).
2. How to Use the Inputs
K (periodK): The lookback period for calculating the %K line of the stochastic oscillator. A smaller value makes the indicator more sensitive to price changes.
D (periodD): The period for smoothing the %K line to get the %D line. A larger value creates smoother signals but may result in delays.
Smooth (smoothK): The additional smoothing applied to the %K line before calculating the %D line. This helps reduce noise.
3. How to Interpret the Candle Colors
Green Candle:
Occurs when the %K line crosses above the %D line in the oversold zone (below 20).
Signals a potential bullish reversal.
Red Candle:
Occurs when the %K line crosses below the %D line in the overbought zone (above 80).
Signals a potential bearish reversal.
No Color:
No crossover occurs, or the crossover doesn't happen in overbought/oversold zones.
4. Application in Trading
Entry Points:
Buy when you see a green candle and confirm with other indicators or chart patterns.
Sell when you see a red candle and confirm with additional signals.
Trend Context:
Combine this indicator with trend-following tools like moving averages or support/resistance levels to improve accuracy.
Stop Loss/Take Profit:
Use nearby swing highs/lows for stop-loss placement.
Set profit targets based on risk-reward ratios or key levels.
5. Customization
Adjust the input parameters (K, D, and Smooth) to align the indicator's sensitivity with your trading style:
Short-term traders might prefer lower values for quicker signals.
Long-term traders might opt for higher values for smoother, more reliable signals.
6. Limitations
Signals in isolation might not be reliable. Always use this indicator in conjunction with other tools.
Avoid using during low volatility or sideways markets as stochastic oscillators can produce false signals.
Money Flow Index Trend Zone Strength [UAlgo]The "Money Flow Index Trend Zone Strength " indicator is designed to analyze and visualize the strength of market trends and OB/OS zones using the Money Flow Index (MFI). The MFI is a momentum indicator that incorporates both price and volume data, providing insights into the buying and selling pressure in the market. This script enhances the traditional MFI by introducing trend and zone strength analysis, helping traders identify potential trend reversals and continuation points.
🔶 Customizable Settings
Amplitude: Defines the range for the MFI Zone Strength calculation.
Wavelength: Period used for the MFI calculation and Stochastic calculations.
Smoothing Factor: Smoothing period for the Stochastic calculations.
Show Zone Strength: Enables/disables visualization of the MFI Zone Strength line.
Show Trend Strength: Enables/disables visualization of the MFI Trend Strength area.
Trend Strength Signal Length: Period used for the final smoothing of the Trend Strength indicator.
Trend Anchor: Selects the anchor point (0 or 50) for the Trend Strength Stochastic calculation.
Trend Transform MA Length: Moving Average length for the Trend Transform calculation.
🔶 Calculations
Zone Strength (Stochastic MFI):
The highest and lowest MFI values over a specified amplitude are used to normalize the MFI value:
MFI Highest: Highest MFI value over the amplitude period.
MFI Lowest: Lowest MFI value over the amplitude period.
MFI Zone Strength: (MFI Value - MFI Lowest) / (MFI Highest - MFI Lowest)
By normalizing and smoothing the MFI values, we aim to highlight the relative strength of different market zones.
Trend Strength:
The smoothed MFI zone strength values are further processed to calculate the trend strength:
EMA of MFI Zone Strength: Exponential Moving Average of the MFI Zone Strength over the wavelength period.
Stochastic of EMA: Stochastic calculation of the EMA values, smoothed with the same smoothing factor.
Purpose: The trend strength calculation provides insights into the underlying market trends. By using EMA and stochastic functions, we can filter out noise and better understand the overall market direction. This helps traders stay aligned with the prevailing trend and make more informed trading decisions.
🔶 Usage
Interpreting Zone Strength: The zone strength plot helps identify overbought and oversold conditions. A higher zone strength indicates potential overbought conditions, while a lower zone strength suggests oversold conditions, can suggest areas for entry/exit decisions.
Interpreting Trend Strength: The trend strength plot visualizes the underlying market trend, can help signal potential trend continuation or reversal based on the chosen anchor point.
Using the Trend Transform: The trend transform plot provides an additional layer of trend analysis, helping traders identify potential trend reversals and continuation points.
Combine the insights from the zone strength and trend strength plots with other technical analysis tools to make informed trading decisions. Look for confluence between different indicators to increase the reliability of your trades.
🔶 Disclaimer:
Use with Caution: This indicator is provided for educational and informational purposes only and should not be considered as financial advice. Users should exercise caution and perform their own analysis before making trading decisions based on the indicator's signals.
Not Financial Advice: The information provided by this indicator does not constitute financial advice, and the creator (UAlgo) shall not be held responsible for any trading losses incurred as a result of using this indicator.
Backtesting Recommended: Traders are encouraged to backtest the indicator thoroughly on historical data before using it in live trading to assess its performance and suitability for their trading strategies.
Risk Management: Trading involves inherent risks, and users should implement proper risk management strategies, including but not limited to stop-loss orders and position sizing, to mitigate potential losses.
No Guarantees: The accuracy and reliability of the indicator's signals cannot be guaranteed, as they are based on historical price data and past performance may not be indicative of future results.
