Stochastic RSIThis is very specific k & d indicator.
You also will change the colours of you k d lines as your wish.
you can adjust the rsi bands in this stoch rsi.
Tìm kiếm tập lệnh với "stoch"

Stochastic RSI (50 Line)This Stoch RSI has a 50 line to help determine if the momentum is going up or down. Under 50, down and above 50 is up.
STOCH RSI DOTSThis Indicator will display dots when the stochastic RSI is either below or above the oversold/overbought threshold.

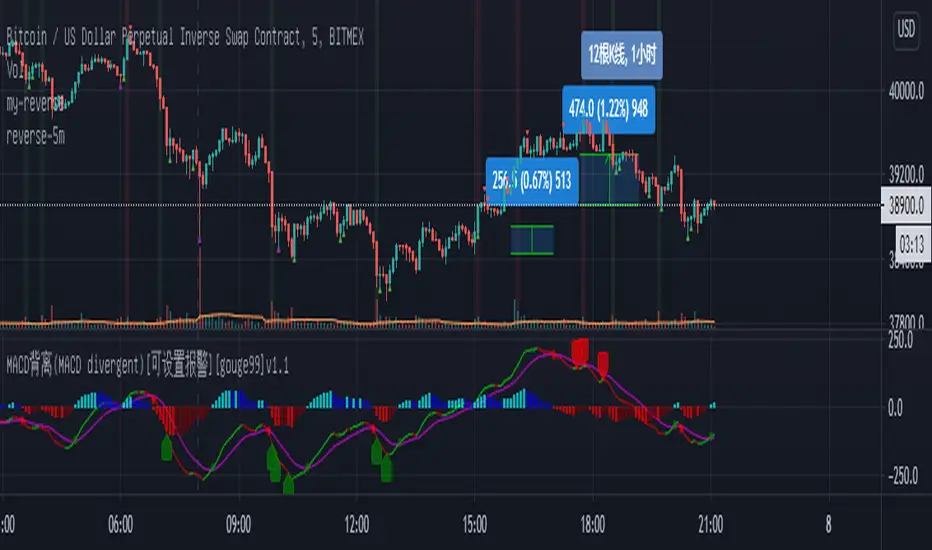
MACD背离(MACD divergent)[公开版][gouge99]注意:背离意味着做反转交易,所以入场要求很高,但是背离一般的收益风险比很大
MACD背离:收盘价创造新高或者新低,但是macd却没有出新高或者新低
计算原理:根据历史K线长度(默认90根K线)来判断收盘价的高低极值和macd的高低极值来进行比较判断
建议使用:
1.在震荡调整行情中,在支撑和压力位附近出现的突然的趋势K线,一般是假突破
2.在趋势末端,一般还会有一次缓慢的测试趋势极点的行情,一般这是趋势反转进入震荡的开始
3.结合其他形态如双顶,头肩,pin bar
4.结合其他指标如stoch随机指标做反转
5.推荐在1h, 30m, 15m级别中使用,5m也可以使用,但是最好背离计算长度设置大一点 比如150

Stoch_VX3Stoch_VX3
Upgrade from Stoch_VX2
*Cross over markers
*Directional bgcolor indication
To run in line with the VX family / or stand alone :-
Baseline_VX1
MACD_VX1
Stoch_VX3 (this one)
/Strategy, line up all three, place your bets - Black or Green :)

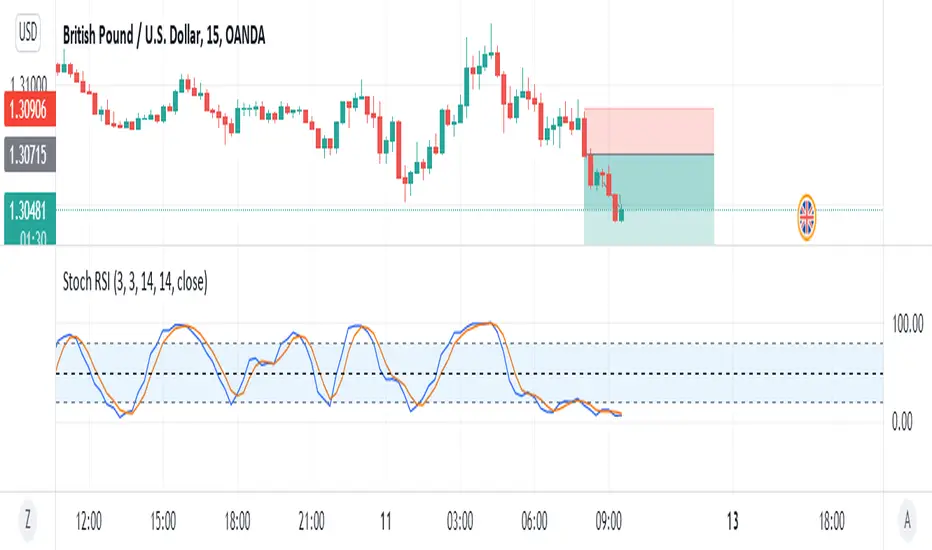
CapnsSurferV2Captain Surfer Version 2
Flags just informs you reversal of Stoch RSI different time Frames Its not Buy and Sell Indicator Use carefully


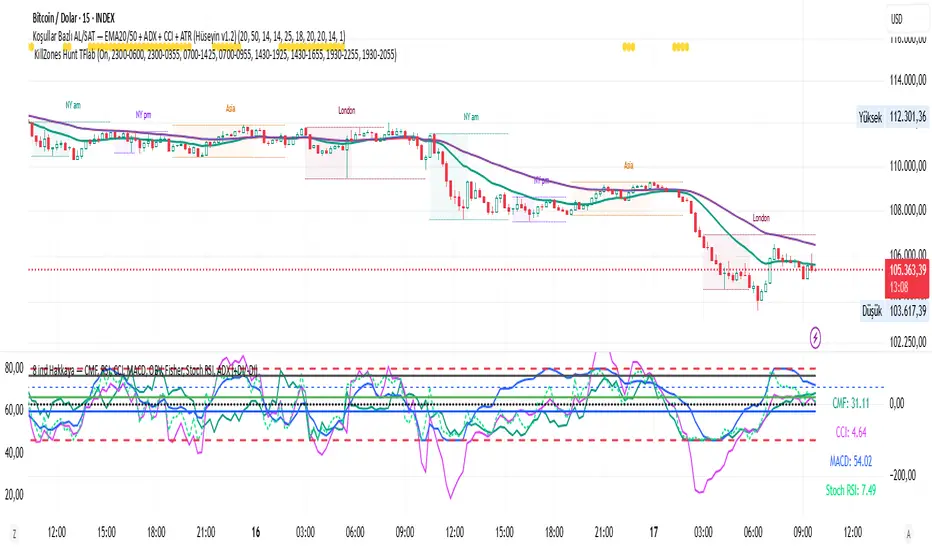
CMF, RSI, CCI, MACD, OBV, Fisher, Stoch RSI, ADX (+DI/-DI)
Stoch RSINine indicators in one, CMF, RSI, CCI, MACD, OBV, Fisher, Stoch RSI, ADX (+DI/-DI) You can use whichever of the nine indicators you want. I use CFM, CCI, MACD, Stoch RSI.
Stochastic Ribbon & EMAsHere's a comprehensive description for publishing your indicator:
---
# **Stochastic Ribbon & EMAs**
A clean and powerful trading indicator that combines **Stochastic Support/Resistance levels** with **Essential Moving Averages** for comprehensive market analysis.
## **📊 What It Does**
This indicator provides **7 key reference lines** on your chart:
- **3 Stochastic levels** (20%, 50%, 80%) - Dynamic support/resistance zones
- **4 Essential EMAs** (20, 50, 100, 200) - Trend direction and momentum
## **🎯 Key Features**
### **Stochastic Ribbon (3 Yellow Lines)**
- **80% Line**: Dynamic resistance level - potential selling zone
- **50% Line**: Market equilibrium - trend direction reference
- **20% Line**: Dynamic support level - potential buying zone
- **Default 50-period lookback** for stable, reliable levels
- **All lines in yellow** for clean, consistent visualization
### **Essential EMAs (4 Colored Lines)**
- **20 EMA** (Purple): Short-term trend and entry timing
- **50 EMA** (Dark Cyan): Medium-term trend direction
- **100 EMA** (Rosy Brown): Long-term trend confirmation
- **200 EMA** (Brown): Major trend and institutional levels
## **📈 How to Use**
### **For Support & Resistance:**
- **Above 80% line**: Look for selling opportunities (overbought zone)
- **Between 50-80%**: Bullish bias, pullbacks to 50% line for entries
- **Around 50% line**: Key equilibrium - watch for direction
- **Between 20-50%**: Bearish bias, bounces to 50% line for exits
- **Below 20% line**: Look for buying opportunities (oversold zone)
### **For Trend Analysis:**
- **EMA Stack Order**: Higher timeframe EMAs above lower = uptrend
- **Price above all EMAs**: Strong bullish momentum
- **Price below all EMAs**: Strong bearish momentum
- **EMA as dynamic support/resistance**: Bounces and rejections
### **For Entry Signals:**
- **Confluence zones**: Where Stochastic levels meet EMA levels
- **Breakouts**: Price breaking through multiple levels simultaneously
- **Reversals**: Price rejection at extreme Stochastic levels with EMA confirmation
## **⚙️ Settings**
### **Stochastic Ribbon**
- **Show/Hide**: Toggle the 3 Stochastic lines
- **Length**: Period for high/low calculation (default: 50)
- **Start**: Multiplier for calculation (default: 1)
### **EMAs**
- **Individual toggles**: Show/hide each EMA separately
- **Custom periods**: Adjust each EMA length (defaults: 20, 50, 100, 200)
- **Custom colors**: Personalize each EMA color
## **🚀 Why This Indicator?**
✅ **Clean & Simple**: No cluttered charts - just essential levels
✅ **Multi-Timeframe**: Works on all timeframes from 1m to 1W
✅ **Versatile**: Suitable for scalping, day trading, and swing trading
✅ **Low Lag**: Dynamic levels that adapt to current market conditions
✅ **Proven Components**: Combines two well-established technical concepts
✅ **Customizable**: Adjust all parameters to fit your trading style
## **💡 Pro Tips**
- **Use multiple timeframes**: Check higher timeframe alignment for stronger signals
- **Combine with volume**: Look for volume confirmation at key levels
- **Watch for confluences**: Best signals occur where multiple levels align
- **Respect the 50% line**: Often acts as the most important level for trend direction
## **📋 Technical Details**
- **Version**: Pine Script v5
- **Overlay**: Yes (displays on main price chart)
- **Plots**: 7 total (well within Pine Script limits)
- **Performance**: Optimized for fast loading and smooth operation
---
**Perfect for traders who want clear, actionable levels without chart clutter. Whether you're a beginner learning support/resistance or an experienced trader looking for clean reference points, this indicator delivers exactly what you need.**
Stochastic Z-Score [AlgoAlpha]🟠 OVERVIEW
This indicator is a custom-built oscillator called the Stochastic Z-Score , which blends a volatility-normalized Z-Score with stochastic principles and smooths it using a Hull Moving Average (HMA). It transforms raw price deviations into a normalized momentum structure, then processes that through a stochastic function to better identify extreme moves. A secondary long-term momentum component is also included using an ALMA smoother. The result is a responsive oscillator that reacts to sharp imbalances while remaining stable in sideways conditions. Colored histograms, dynamic oscillator bands, and reversal labels help users visually assess shifts in momentum and identify potential turning points.
🟠 CONCEPTS
The Z-Score is calculated by comparing price to its mean and dividing by its standard deviation—this normalizes movement and highlights how far current price has stretched from typical values. This Z-Score is then passed through a stochastic function, which further refines the signal into a bounded range for easier interpretation. To reduce noise, a Hull Moving Average is applied. A separate long-term trend filter based on the ALMA of the Z-Score helps determine broader context, filtering out short-term traps. Zones are mapped with thresholds at ±2 and ±2.5 to distinguish regular momentum from extreme exhaustion. The tool is built to adapt across timeframes and assets.
🟠 FEATURES
Z-Score histogram with gradient color to visualize deviation intensity (optional toggle).
Primary oscillator line (smoothed stochastic Z-Score) with adaptive coloring based on momentum direction.
Dynamic bands at ±2 and ±2.5 to represent regular vs extreme momentum zones.
Long-term momentum line (ALMA) with contextual coloring to separate trend phases.
Automatic reversal markers when short-term crosses occur at extremes with supporting long-term momentum.
Built-in alerts for oscillator direction changes, zero-line crosses, overbought/oversold entries, and trend confirmation.
🟠 USAGE
Use this script to track momentum shifts and identify potential reversal areas. When the oscillator is rising and crosses above the previous value—especially from deeply negative zones (below -2)—and the ALMA is also above zero, this suggests bullish reversal conditions. The opposite holds for bearish setups. Reversal labels ("▲" and "▼") appear only when both short- and long-term conditions align. The ±2 and ±2.5 thresholds act as momentum warning zones; values inside are typical trends, while those beyond suggest exhaustion or extremes. Adjust the length input to match the asset’s volatility. Enable the histogram to explore underlying raw Z-Score movements. Alerts can be configured to notify key changes in momentum or zone entries.

Stochastic RSI with MTF TableShort Description of the Script
The provided Pine Script indicator, titled "Stochastic RSI with MTF Table," calculates and displays the Stochastic RSI for the current timeframe and multiple other timeframes (5m, 15m, 30m, 60m, 240m, and daily). The Stochastic RSI is a momentum indicator that blends the Relative Strength Index (RSI) and Stochastic Oscillator to identify overbought and oversold conditions, as well as potential trend reversals via K and D line crossovers.
Key features of the script include:
Inputs: Customizable parameters such as K smoothing (default 3), D smoothing (default 3), RSI length (default 14), Stochastic length (default 14), source price (default close), and overbought/oversold levels (default 80/20).
MTF Table: A table displays the Stochastic RSI status for each timeframe:
"OB" (overbought) if K > 80, "OS" (oversold) if K < 20, or "N" (neutral) otherwise.
Crossovers: "K↑D" for bullish (K crosses above D) and "K↓D" for bearish (K crosses below D).
Visualization: Plots the K and D lines for the current timeframe, with horizontal lines at 80 (overbought), 50 (middle), and 20 (oversold), plus a background fill for clarity.
Table Position: Configurable to appear in one of four chart corners (default: top-right).
This indicator helps traders assess momentum across multiple timeframes simultaneously, aiding in the identification of trend strength and potential entry/exit points.
Trading Strategy with 50EMA and 200EMA for Highest Winning Rate
To create a strategy with the best probability of a high winning rate using the Stochastic RSI MTF indicator alongside the 50-period Exponential Moving Average (50EMA) and 200-period Exponential Moving Average (200EMA), we can combine trend identification with momentum-based entry timing. The 50EMA and 200EMA are widely used to determine medium- and long-term trends, while the Stochastic RSI MTF table provides multi-timeframe momentum signals. Here’s the strategy:
1. Determine the Overall Trend
Bullish Trend: The 50EMA is above the 200EMA on the current timeframe (e.g., daily or 60m chart). This suggests an uptrend, often associated with a "Golden Cross."
Bearish Trend: The 50EMA is below the 200EMA on the current timeframe. This indicates a downtrend, often linked to a "Death Cross."
Implementation: Plot the 50EMA and 200EMA on your chart and visually confirm their relative positions.
2. Identify Entry Signals Using the Stochastic RSI MTF Table
In a Bullish Trend (50EMA > 200EMA):
Look for timeframes in the MTF table showing:
Oversold (OS): K < 20, indicating a potential pullback in the uptrend where price may rebound.
Bullish Crossover (K↑D): K crosses above D, signaling rising momentum and a potential entry point.
Example: If the 60m and 240m timeframes show "OS" or "K↑D," this could be a buy signal.
In a Bearish Trend (50EMA < 200EMA):
Look for timeframes in the MTF table showing:
Overbought (OB): K > 80, suggesting a rally in the downtrend where price may reverse downward.
Bearish Crossover (K↓D): K crosses below D, indicating declining momentum and a potential short entry.
Example: If the 30m and daily timeframes show "OB" or "K↓D," this could be a sell/short signal.
Current Timeframe Check: Use the plotted K and D lines on your trading timeframe for precise entry timing (e.g., confirm a K↑D crossover on a 60m chart for a long trade).
3. Confirm Signals Across Multiple Timeframes
Strengthen the Signal: A higher winning rate is more likely when multiple timeframes align with the trend and signal. For instance:
Bullish trend + "OS" or "K↑D" on 60m, 240m, and daily = strong buy signal.
Bearish trend + "OB" or "K↓D" on 15m, 60m, and 240m = strong sell signal.
Prioritize Higher Timeframes: Signals from the 240m or daily timeframe carry more weight due to their indication of broader trends, increasing reliability.
4. Set Stop-Loss and Take-Profit Levels
Long Trades (Bullish):
Stop-Loss: Place below the most recent swing low or below the 50EMA, whichever is closer, to protect against trend reversals.
Take-Profit: Target a key resistance level or use a risk-reward ratio (e.g., 2:1 or 3:1) based on the stop-loss distance.
Short Trades (Bearish):
Stop-Loss: Place above the most recent swing high or above the 50EMA, whichever is closer.
Take-Profit: Target a key support level or apply a similar risk-reward ratio.
Trailing Stop Option: As the trend progresses, trail the stop below the 50EMA (for longs) or above it (for shorts) to lock in profits.
5. Risk Management
Position Sizing: Risk no more than 1-2% of your trading capital per trade to minimize losses from false signals.
Volatility Consideration: Adjust stop-loss distances and position sizes based on the asset’s volatility (e.g., wider stops for volatile stocks or crypto).
Avoid Overtrading: Wait for clear alignment between the EMA trend and MTF signals to avoid low-probability setups.
Example Scenario
Chart: 60-minute timeframe.
Trend: 50EMA > 200EMA (bullish).
MTF Table: 60m shows "OS," 240m shows "K↑D," and daily is "N."
Action: Enter a long position when the 60m K line crosses above D, confirming the table signal.
Stop-Loss: Below the recent 60m swing low (e.g., 2% below entry).
Take-Profit: At the next resistance level or a 3:1 reward-to-risk ratio.
Outcome: High probability of success due to trend alignment and multi-timeframe confirmation.
Why This Strategy Works
Trend Following: Trading in the direction of the 50EMA/200EMA trend reduces the risk of fighting the market’s momentum.
Momentum Timing: The Stochastic RSI MTF table pinpoints pullbacks or reversals within the trend, improving entry timing.
Multi-Timeframe Confirmation: Alignment across timeframes filters out noise, increasing the win rate.
Risk Control: Defined stop-loss and position sizing protect against inevitable losses.
Caveats
No strategy guarantees a 100% win rate; false signals can occur, especially in choppy markets.
Test this strategy on historical data or a demo account to verify its effectiveness for your asset and timeframe.
This approach leverages the strengths of both trend-following (EMA) and momentum (Stochastic RSI) tools, aiming for a high-probability, disciplined trading system.

Stochastic Strategy Table with Trend (1m–4H) + Toggle📊 Multi-Timeframe Stochastic Strategy Table with Trend Detection
This script is designed for intraday and swing traders who want to monitor Stochastic momentum across multiple timeframes in real-time — all directly on the main chart.
🔎 What This Script Does
This script builds a compact, color-coded table that displays:
✅ %K and %D values of the Stochastic oscillator
✅ Cross direction (K > D or K < D)
✅ Overbought/Oversold zone conditions
✅ Short-term trend detection via %K movement
It covers ten timeframes:
1m, 2m,3m,5m, 15m, 30m, 1H, 2H, 3H, 4H
🟩 How to Use It
Trend colors in header:
🟢 Green = %K is rising (uptrend)
🔴 Red = %K is falling (downtrend)
⚪ Gray = flat or neutral
Cross Row:
Green background = Bullish (%K > %D)
Red background = Bearish (%K < %D)
Zone Row:
Green = Oversold (%K and %D below 20)
Red = Overbought (%K and %D above 80)
Gray = Neutral zone
Use Case:
Look for multiple timeframes aligning in trend
Enter trades on short timeframes (e.g. 5m) when HTFs confirm direction
Especially powerful when used with price action on 5m/15m candles
⚙️ Configurable Inputs
%K Length
%K Smoothing
%D Length
Table location
Table size
💡 Why This Script Is Unique
Shows true higher timeframe Stochastic values (not interpolated from current chart)
Works in real-time with consistent updates
Trend direction is visualized without needing extra space
Built for serious intraday traders who rely on clean data and signal alignment
🙏 Credits & Notes
This tool was created to solve a real problem: getting accurate HTF stochastic data in a clean, real-time, decision-friendly format.
I built it for my own use — and now I'm sharing it for luck, and for anyone else looking to trade more clearly and confidently.
Feel free to fork, customize, or build upon it.
Good luck, and trade safe! 🍀💹

Stochastic Order Flow Momentum [ScorsoneEnterprises]This indicator implements a stochastic model of order flow using the Ornstein-Uhlenbeck (OU) process, combined with a Kalman filter to smooth momentum signals. It is designed to capture the dynamic momentum of volume delta, representing the net buying or selling pressure per bar, and highlight potential shifts in market direction. The volume delta data is sourced from TradingView’s built-in functionality:
www.tradingview.com
For a deeper dive into stochastic processes like the Ornstein-Uhlenbeck model in financial contexts, see these research articles: arxiv.org and arxiv.org
The SOFM tool aims to reveal the momentum and acceleration of order flow, modeled as a mean-reverting stochastic process. In markets, order flow often oscillates around a baseline, with bursts of buying or selling pressure that eventually fade—similar to how physical systems return to equilibrium. The OU process captures this behavior, while the Kalman filter refines the signal by filtering noise. Parameters theta (mean reversion rate), mu (mean level), and sigma (volatility) are estimated by minimizing a squared-error objective function using gradient descent, ensuring adaptability to real-time market conditions.
How It Works
The script combines a stochastic model with signal processing. Here’s a breakdown of the key components, including the OU equation and supporting functions.
// Ornstein-Uhlenbeck model for volume delta
ou_model(params, v_t, lkb) =>
theta = clamp(array.get(params, 0), 0.01, 1.0)
mu = clamp(array.get(params, 1), -100.0, 100.0)
sigma = clamp(array.get(params, 2), 0.01, 100.0)
error = 0.0
v_pred = array.new(lkb, 0.0)
array.set(v_pred, 0, array.get(v_t, 0))
for i = 1 to lkb - 1
v_prev = array.get(v_pred, i - 1)
v_curr = array.get(v_t, i)
// Discretized OU: v_t = v_{t-1} + theta * (mu - v_{t-1}) + sigma * noise
v_next = v_prev + theta * (mu - v_prev)
array.set(v_pred, i, v_next)
v_curr_clean = na(v_curr) ? 0 : v_curr
v_pred_clean = na(v_next) ? 0 : v_next
error := error + math.pow(v_curr_clean - v_pred_clean, 2)
error
The ou_model function implements a discretized Ornstein-Uhlenbeck process:
v_t = v_{t-1} + theta (mu - v_{t-1})
The model predicts volume delta (v_t) based on its previous value, adjusted by the mean-reverting term theta (mu - v_{t-1}), with sigma representing the volatility of random shocks (approximated in the Kalman filter).
Parameters Explained
The parameters theta, mu, and sigma represent distinct aspects of order flow dynamics:
Theta:
Definition: The mean reversion rate, controlling how quickly volume delta returns to its mean (mu). Constrained between 0.01 and 1.0 (e.g., clamp(array.get(params, 0), 0.01, 1.0)).
Interpretation: A higher theta indicates faster reversion (short-lived momentum), while a lower theta suggests persistent trends. Initial value is 0.1 in init_params.
In the Code: In ou_model, theta scales the pull toward \mu, influencing the predicted v_t.
Mu:
Definition: The long-term mean of volume delta, representing the equilibrium level of net buying/selling pressure. Constrained between -100.0 and 100.0 (e.g., clamp(array.get(params, 1), -100.0, 100.0)).
Interpretation: A positive mu suggests a bullish bias, while a negative mu indicates bearish pressure. Initial value is 0.0 in init_params.
In the Code: In ou_model, mu is the target level that v_t reverts to over time.
Sigma:
Definition: The volatility of volume delta, capturing the magnitude of random fluctuations. Constrained between 0.01 and 100.0 (e.g., clamp(array.get(params, 2), 0.01, 100.0)).
Interpretation: A higher sigma reflects choppier, noisier order flow, while a lower sigma indicates smoother behavior. Initial value is 0.1 in init_params.
In the Code: In the Kalman filter, sigma contributes to the error term, adjusting the smoothing process.
Summary:
theta: Speed of mean reversion (how fast momentum fades).
mu: Baseline order flow level (bullish or bearish bias).
sigma: Noise level (variability in order flow).
Other Parts of the Script
Clamp
A utility function to constrain parameters, preventing extreme values that could destabilize the model.
ObjectiveFunc
Defines the objective function (sum of squared errors) to minimize during parameter optimization. It compares the OU model’s predicted volume delta to observed data, returning a float to be minimized.
How It Works: Calls ou_model to generate predictions, computes the squared error for each timestep, and sums it. Used in optimization to assess parameter fit.
FiniteDifferenceGradient
Calculates the gradient of the objective function using finite differences. Think of it as finding the "slope" of the error surface for each parameter. It nudges each parameter (theta, mu, sigma) by a small amount (epsilon) and measures the change in error, returning an array of gradients.
Minimize
Performs gradient descent to optimize parameters. It iteratively adjusts theta, mu, and sigma by stepping down the "hill" of the error surface, using the gradients from FiniteDifferenceGradient. Stops when the gradient norm falls below a tolerance (0.001) or after 20 iterations.
Kalman Filter
Smooths the OU-modeled volume delta to extract momentum. It uses the optimized theta, mu, and sigma to predict the next state, then corrects it with observed data via the Kalman gain. The result is a cleaner momentum signal.
Applied
After initializing parameters (theta = 0.1, mu = 0.0, sigma = 0.1), the script optimizes them using volume delta data over the lookback period. The optimized parameters feed into the Kalman filter, producing a smoothed momentum array. The average momentum and its rate of change (acceleration) are calculated, though only momentum is plotted by default.
A rising momentum suggests increasing buying or selling pressure, while a flattening or reversing momentum indicates fading activity. Acceleration (not plotted here) could highlight rapid shifts.
Tool Examples
The SOFM indicator provides a dynamic view of order flow momentum, useful for spotting directional shifts or consolidation.
Low Time Frame Example: On a 5-minute chart of SEED_ALEXDRAYM_SHORTINTEREST2:NQ , a rising momentum above zero with a lookback of 5 might signal building buying pressure, while a drop below zero suggests selling dominance. Crossings of the zero line can mark transitions, though the focus is on trend strength rather than frequent crossovers.
High Time Frame Example: On a daily chart of NYSE:VST , a sustained positive momentum could confirm a bullish trend, while a sharp decline might warn of exhaustion. The mean-reverting nature of the OU process helps filter out noise on longer scales. It doesn’t make the most sense to use this on a high timeframe with what our data is.
Choppy Markets: When momentum oscillates near zero, it signals indecision or low conviction, helping traders avoid whipsaws. Larger deviations from zero suggest stronger directional moves to act on, this is on $STT.
Inputs
Lookback: Users can set the lookback period (default 5) to adjust the sensitivity of the OU model and Kalman filter. Shorter lookbacks react faster but may be noisier; longer lookbacks smooth more but lag slightly.
The user can also specify the timeframe they want the volume delta from. There is a default way to lower and expand the time frame based on the one we are looking at, but users have the flexibility.
No indicator is 100% accurate, and SOFM is no exception. It’s an estimation tool, blending stochastic modeling with signal processing to provide a leading view of order flow momentum. Use it alongside price action, support/resistance, and your own discretion for best results. I encourage comments and constructive criticism.

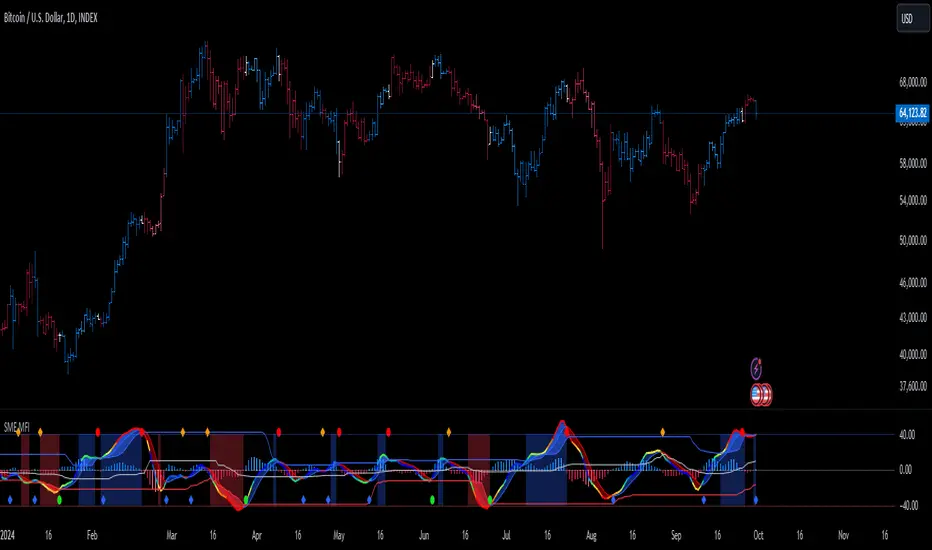
SMI Ergodic Indicator/Oscillator of Money Flow Index▮ Introduction
The Stochastic Momentum Index Ergodic (SMII) indicator is a technical analysis tool designed to predict trend reversals in the price of an asset.
It functions as a momentum oscillator, measuring the ratio of the smoothed price change to the smoothed absolute price change over a given number of previous periods.
The Ergodic SMI is based on the True Strength Index (TSI) and integrates a signal line, which is an exponential moving average (EMA) of the SMI indicator itself.
The Ergodic SMI oscillator provides a clearer picture of market trends than the traditional stochastic oscillator by incorporating the concept of 'ergodicity', which helps remove market noise.
On ther other hand, MFI (Money Flow Index) is a technical analysis indicator used to measure the inflow of money into an asset and thus help identify buying and selling pressure in a given financial instrument.
When these two indicators are combined, they can provide a more comprehensive view of price direction and market strength.
▮ Motivation: why another indicator?
By combining SMII with MFI, we can gain even more insights into the market.
One way to do this is to use the MFI as an input to the SMII, rather than just using price.
This means we are measuring momentum based on buying and selling pressure rather than just price.
Furthermore, there is the possibility of making several fine adjustments to both the calculation and visualization parameters that are not present in other indicators.
▮ What to look for
When using the SMII MFI indicator, there are a few things to look out for.
First, look at the SMII signal line.
When the line crosses above -40, it is considered a buy signal, while the crossing below +40 is considered a sell signal.
Also, pay attention to divergences between the SMII and the price.
If price is rising but the SMII is showing negative divergence, it could indicate that momentum is waning and a reversal could be in the offing.
Likewise, if price is falling but the SMII is showing positive divergence, this could indicate that momentum is building and a reversal could also be in the offing.
Divergences can be considered in both indicator and/or histogram.
Examples:
▮ Notes
The indicator presented here offers both the 'SMII' and the 'SMIO', that is, the 'Stochastic Momentum Index Ergodic Indicator' together with the 'Stochastic Momentum Index Ergodic Oscillator' (histogram), as per the documentation described in reference links.
So it is important to highlight the differences in relation to my other indicator, the 'Stochastic Momentum Index (SMI) of Money Flow Index (MFI)':
This last one is purely based on the SMI , which is implemented using SMA smoothing for the relative range and the high/low range.
Although they may seem the same in some situations, the calculation is actually different. The TSI tends to be more responsive at the expense of being noisier, while the SMI tends to be smoother. Which of these two indicators is best depends on the situation, the context, and the analyst's personal preference.
Please refer to reference links to more info.
▮ References
SMI documentation
SMII documentation
SMIO documentation
MFI documentation
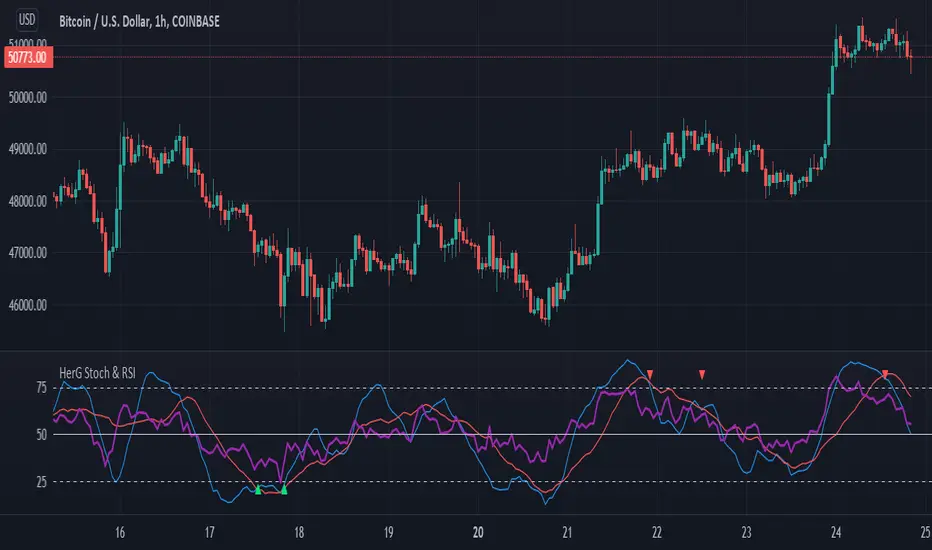
Stochastic and RSI in one indicator with customized alert.Hello Trading Viewers,
I present you Stochastic Oscillator and The Relative Strength Index Indicator inside one indicator, so that it will clear room to view charts.
When Stochastic is over-sold, the fast and slow stochastic underlap along with strong RSI (say above 45) will be a good indicator of buy at low with good risk-to-return of 2x or 3x; therefore I have set a triangle shape indicator within to help you identify or you can simply set an alert as I have coded an customized alert.
Same idea is used when Stochastic is over-bought you will receive an alert when fast & slow stochastic overlaps with RSI falling give a good sell set-up.
There is an option of selecting different timeframes which will further help make the correct decision. Say you are viewing a Daily chart but you want an indicator to present data of 4hrs timeframe, it can be done from the indicator cogwheel option. Default timeframe is "same as charts' ".
Above indicator is universal because settings such as RSI levels and no. of bars to calculate are user defined. You can use it on Crypto, Commodities, Stocks etc.
I suggest you first paper-trade with it and then use it on live account.
Happy trading.
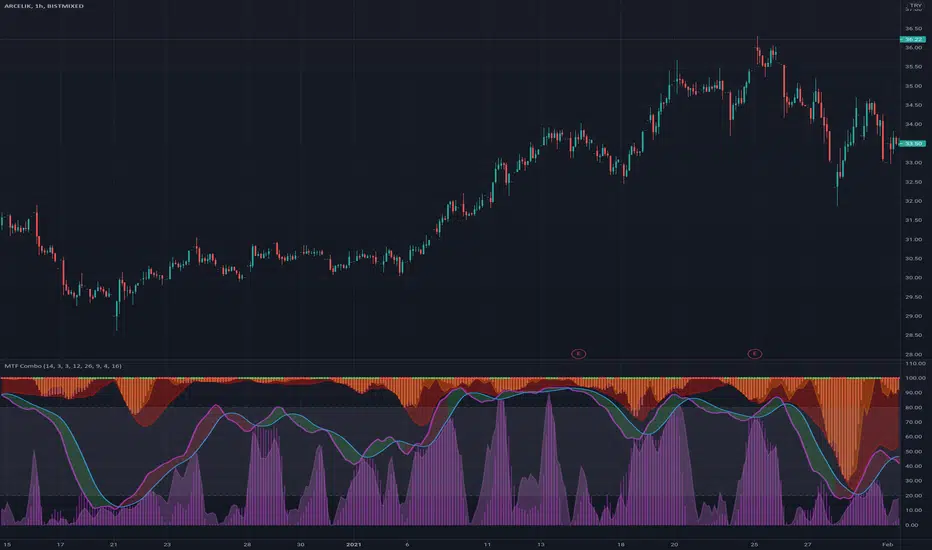
MTF ComboMiddle stochastic is the HTF stochastic of price. The color coding indicates the trend in even higher timeframe.
- The graph on top is the stochastic of ATR (with HTF and current one with RSI and macd histogram).
- The green graph at the bottom is the stochastic of the OBV (with HTF and current one with RSI and macd histogram).
- Purple histogram and area underneath the mid-stochsatic are the macd histogram and the stochastic RSI.
- The dots in the middle are determined by the combined score of all
@theCF StochasticStochastic with Bullish , Bearish and Neutral Ranges as well as a modification to check the %D line with a Exponential Moving Average .
Since Exponential Moving Averages put more weight onto recent values, they react differently than the Standard Simple Moving Average .
On Stochastic I have observed, that there can often occur false crossover signals. While this also happens with an Exponential Moving Average as %D indeed, the amount is more limited, therefore giving less false signals.
I prefer to display both at the same time, for more information.
The ranges act as general support and resistance zones on Stochastic . Whenever Stochastic oscillates within one of the ranges, one can interpret it as either bullish , neutral or bearish for price.
A Stochastic that oscillates mainly within the bullish range can be interpreted rather bullish , the opposite goes for the bearish range which is interpreted bearish .
I have coded these ranges into the Standard Stochastic Script, as well as the option to display the %D line as a Exponential Moving Average .
For more information about the indicator, feel free to leave a comment and ask.

Stochastic Signalbuy and sell indicator for slow stochastic, basic indicator to show buy and sell position based on slow stochastic 3 minute time frame.

Stochastic %K Colored by VolumeDescription:
"Stochastic %K Colored by Volume is a technical indicator that combines the traditional Stochastic %K oscillator with volume-based coloring. It highlights periods of high, low, and neutral trading volume by changing the color of the %K line. Additionally, it identifies bullish and bearish divergences between price and the %K oscillator, helping traders spot potential reversals and trend changes. The indicator also includes key levels for overbought, oversold, and extreme zones to guide trading decisions."

Stochastic with Z-Score📊 Stochastic with Z-Score
This custom indicator enhances the classic Stochastic Oscillator by applying Z-Score normalization to both %K and %D lines, helping traders identify statistically significant overbought and oversold conditions based on historical behavior.
🔍 Key Features:
Z-Score Normalization of %K and %D:
Detects deviations from the mean using standard deviation, offering a more dynamic and statistically grounded way to interpret momentum.
Signal Confirmation Filters:
✅ Trend Filter using 200 EMA: Only trade in the direction of the prevailing trend.
✅ Volume Filter: Confirms signals only when volume exceeds the moving average, reducing noise.
Buy & Sell Signals:
📈 Buy: Triggered when the Z-score of %K crosses above a negative threshold, %D is still below that threshold, and the candle is bullish.
📉 Sell: Triggered when the Z-score of %K crosses below a positive threshold, %D is still above that threshold, and the candle is bearish.
Signals are further filtered by trend and volume if enabled.
Customizable Thresholds & Settings:
Control Z-score length, thresholds, Stochastic lengths, and filter settings.
Visual Enhancements:
Colored histogram based on Z-score levels.
Shaded background in overbought/oversold zones.
Clear “Buy” and “Sell” labels plotted directly on the chart.
Alerts Included:
Set alerts on confirmed buy and sell signals for real-time notifications.
📘 How to Use:
Use this indicator on any timeframe or asset.
Enable or disable trend and volume filters depending on your strategy.
Use signals in confluence with price action or other indicators.
Adjust Z-score thresholds for more or fewer signals based on your risk profile.
⚠️ Note: This is an indicator, not a strategy. Always test signals on historical data and in simulation before live trading.

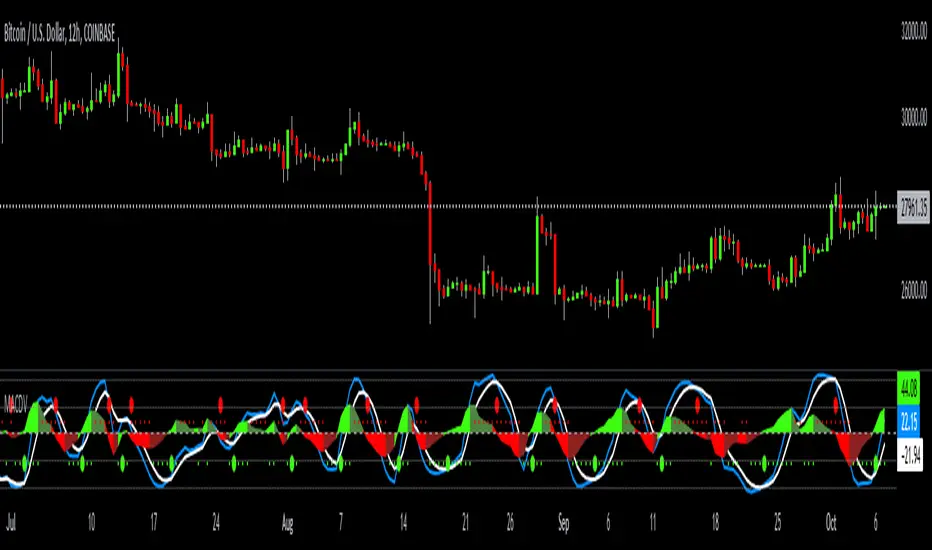
MACDVMACDV = Moving Average Convergence Divergence Volume
The MACDV indicator uses stochastic accumulation / distribution volume inflow and outflow formulas to visualize it in a standard MACD type of appearance.
To be able to merge these formulas I had to normalize the math.
Accumulation / distribution volume is a unique scale.
Stochastic is a 0-100 scale.
MACD is a unique scale.
The normalized output scale range for MACDV is -100 to 100.
100 = overbought
-100 = oversold
Everything in between is either bullish or bearish.
Rising = bullish
Falling = bearish
crossover = bullish
crossunder = bearish
convergence = direction change
divergence = momentum
The default input settings are:
7 = K length, Stochastic accumulation / distribution length
3 = D smoothing, smoothing stochastic accumulation / distribution volume weighted moving average
6 = MACDV fast, MACDV fast length line
color = blue
13 = MACDV slow, MACDV slow length line
color = white
4 = MACDV signal, MACDV histogram length
color rising above 0 = bright green
color falling above 0 = dark green
color falling below 0 = bright red
color rising below 0 = dark red
2 = Stretch, Output multiplier for MACDV visual expansion
Horizontal lines:
100
75
50
25
0
-25
-50
-75
-100
Stochastic Moving Average Delta Oscillator (SMADO)This is an interesting take on the stochastic oscillator. What I have done here is I've taken the cumulative sum of the deltas of all the simple moving averages from 1 to 200 and summed them. Next I transform this into a stochastic oscillator with ta.stoch. The point of this is to show you trends, tops and bottoms. I hope you find this indicator as interesting as I did. Please enjoy!
The Feature include: Stochastic Window, Number of MA's to check, General Smoothing, and Direction Indication.
