Red Candles with Green Precedent
**Title**: Red Candles with Green Precedent Indicator
**Description**:
This TradingView indicator is designed to help traders identify potential reversal or continuation patterns based on the appearance of consecutive red candles following a green candle. The script marks a region starting from a green candle that precedes at least four consecutive red candles, extending a box forward for a predefined number of bars to analyze the continuation of the trend.
**Key Features**:
- **Consecutive Red Candles Detection**: The indicator counts consecutive red candles that close lower than they open.
- **Initial Green Candle Identification**: Identifies the last green candle before a series of red candles begins. This green candle must close higher than it opens.
- **Visual Box Extension**: Creates a visual box from the open to the high of the green candle and extends it forward to highlight the period of interest.
- **Dynamic Box Termination**: Optionally terminates the box early if a significant green candle appears within the extension period, suggesting a potential reversal.
**Usage**:
1. **Setup**: Apply the indicator to any chart in TradingView. Adjust the number of consecutive red candles to track based on your trading strategy.
2. **Interpretation**: A visual green box will appear when the criteria are met. This box helps focus on the price action following a potentially significant green candle. Traders should watch for price actions within and around the box to make informed decisions.
3. **Alerts**: Consider setting alerts for when a new box is created or when a significant green candle forms that might terminate the box early, indicating potential market movements.
**Suitable for**: This indicator is suitable for traders looking for visual cues about potential bearish exhaustion or the setup for a bullish reversal, particularly in volatile markets.
---
Feel free to customize the description and features according to any additional details or personal insights you might want to include based on your trading experience or the specific behaviors of the markets you track.
**Disclaimer**:
This script is provided as a tool for trading analysis and is not intended to be used as the sole basis for any trading decisions. While this indicator aims to identify potential trading opportunities, its effectiveness can depend on market conditions and individual trading strategies. Users should conduct their own research and consult with professional advisors before making any investment decisions. The creator of this script assumes no responsibility for any potential financial losses incurred from using this indicator. Trading in financial markets involves risk, and it is possible to lose more than your initial investment.
---
Tìm kiếm tập lệnh với "track"

Day/Week/Month Metrics (Zeiierman)█ Overview
The Day/Week/Month Metrics (Zeiierman) indicator is a powerful tool for traders looking to incorporate historical performance into their trading strategy. It computes statistical metrics related to the performance of a trading instrument on different time scales: daily, weekly, and monthly. Breaking down the performance into daily, weekly, and monthly metrics provides a granular view of the instrument's behavior.
The indicator requires the chart to be set on a daily timeframe.
█ Key Statistics
⚪ Day in month
The performance of financial markets can show variability across different days within a month. This phenomenon, often referred to as the "monthly effect" or "turn-of-the-month effect," suggests that certain days of the month, especially the first and last days, tend to exhibit higher than average returns in many stock markets around the world. This effect is attributed to various factors including payroll contributions, investment of monthly dividends, and psychological factors among traders and investors.
⚪ Edge
The Edge calculation identifies days within a month that consistently outperform the average monthly trading performance. It provides a statistical advantage by quantifying how often trading on these specific days yields better returns than the overall monthly average. This insight helps traders understand not just when returns might be higher, but also how reliable these patterns are over time. By focusing on days with a higher "Edge," traders can potentially increase their chances of success by aligning their strategies with historically more profitable days.
⚪ Month
Historically, the stock market has exhibited seasonal trends, with certain months showing distinct patterns of performance. One of the most well-documented patterns is the "Sell in May and go away" phenomenon, suggesting that the period from November to April has historically brought significantly stronger gains in many major stock indices compared to the period from May to October. This pattern highlights the potential impact of seasonal investor sentiment and activities on market performance.
⚪ Day in week
Various studies have identified the "day-of-the-week effect," where certain days of the week, particularly Monday and Friday, show different average returns compared to other weekdays. Historically, Mondays have been associated with lower or negative average returns in many markets, a phenomenon often linked to the settlement of trades from the previous week and negative news accumulation over the weekend. Fridays, on the other hand, might exhibit positive bias as investors adjust positions ahead of the weekend.
⚪ Week in month
The performance of markets can also vary within different weeks of the month, with some studies suggesting a "week of the month effect." Typically, the first and the last week of the month may show stronger performance compared to the middle weeks. This pattern can be influenced by factors such as the timing of economic reports, monthly investment flows, and options and futures expiration dates which tend to cluster around these periods, affecting investor behavior and market liquidity.
█ How It Works
⚪ Day in Month
For each day of the month (1-31), the script calculates the average percentage change between the opening and closing prices of a trading instrument. This metric helps identify which days have historically been more volatile or profitable.
It uses arrays to store the sum of percentage changes for each day and the total occurrences of each day to calculate the average percentage change.
⚪ Month
The script calculates the overall gain for each month (January-December) by comparing the closing price at the start of a month to the closing price at the end, expressed as a percentage. This metric offers insights into which months might offer better trading opportunities based on historical performance.
Monthly gains are tracked using arrays that store the sum of these gains for each month and the count of occurrences to calculate the average monthly gain.
⚪ Day in Week
Similar to the day in the month analysis, the script evaluates the average percentage change between the opening and closing prices for each day of the week (Monday-Sunday). This information can be used to assess which days of the week are typically more favorable for trading.
The script uses arrays to accumulate percentage changes and occurrences for each weekday, allowing for the calculation of average changes per day of the week.
⚪ Week in Month
The script assesses the performance of each week within a month, identifying the gain from the start to the end of each week, expressed as a percentage. This can help traders understand which weeks within a month may have historically presented better trading conditions.
It employs arrays to track the weekly gains and the number of weeks, using a counter to identify which week of the month it is (1-4), allowing for the calculation of average weekly gains.
█ How to Use
Traders can use this indicator to identify patterns or trends in the instrument's performance. For example, if a particular day of the week consistently shows a higher percentage of bullish closes, a trader might consider this in their strategy. Similarly, if certain months show stronger performance historically, this information could influence trading decisions.
Identifying High-Performance Days and Periods
Day in Month & Day in Week Analysis: By examining the average percentage change for each day of the month and week, traders can identify specific days that historically have shown higher volatility or profitability. This allows for targeted trading strategies, focusing on these high-performance days to maximize potential gains.
Month Analysis: Understanding which months have historically provided better returns enables traders to adjust their trading intensity or capital allocation in anticipation of seasonally stronger or weaker periods.
Week in Month Analysis: Identifying which weeks within a month have historically been more profitable can help traders plan their trades around these periods, potentially increasing their chances of success.
█ Settings
Enable or disable the types of statistics you want to display in the table.
Table Size: Users can select the size of the table displayed on the chart, ranging from "Tiny" to "Auto," which adjusts based on screen size.
Table Position: Users can choose the location of the table on the chart
-----------------
Disclaimer
The information contained in my Scripts/Indicators/Ideas/Algos/Systems does not constitute financial advice or a solicitation to buy or sell any securities of any type. I will not accept liability for any loss or damage, including without limitation any loss of profit, which may arise directly or indirectly from the use of or reliance on such information.
All investments involve risk, and the past performance of a security, industry, sector, market, financial product, trading strategy, backtest, or individual's trading does not guarantee future results or returns. Investors are fully responsible for any investment decisions they make. Such decisions should be based solely on an evaluation of their financial circumstances, investment objectives, risk tolerance, and liquidity needs.
My Scripts/Indicators/Ideas/Algos/Systems are only for educational purposes!

ottlibLibrary "ottlib"
█ OVERVIEW
This library contains functions for the calculation of the OTT (Optimized Trend Tracker) and its variants, originally created by Anıl Özekşi (Anil_Ozeksi). Special thanks to him for the concept and to Kıvanç Özbilgiç (KivancOzbilgic) and dg_factor (dg_factor) for adapting them to Pine Script.
█ WHAT IS "OTT"
The OTT (Optimized Trend Tracker) is a highly customizable and very effective trend-following indicator that relies on moving averages and a trailing stop at its core. Moving averages help reduce noise by smoothing out sudden price movements in the markets, while trailing stops assist in detecting trend reversals with precision. Initially developed as a noise-free trailing stop, the current variants of OTT range from rapid trend reversal detection to long-term trend confirmation, thanks to its extensive customizability.
It's well-known variants are:
OTT (Optimized Trend Tracker).
TOTT (Twin OTT).
OTT Channels.
RISOTTO (RSI OTT).
SOTT (Stochastic OTT).
HOTT & LOTT (Highest & Lowest OTT)
ROTT (Relative OTT)
FT (Original name is Fırsatçı Trend in Turkish which translates to Opportunist Trend)
█ LIBRARY FEATURES
This library has been prepared in accordance with the style, coding, and annotation standards of Pine Script version 5. As a result, explanations and examples will appear when users hover over functions or enter function parameters in the editor.
█ USAGE
Usage of this library is very simple. Just import it to your script with the code below and use its functions.
import ismailcarlik/ottlib/1 as ottlib
█ FUNCTIONS
• f_vidya(source, length, cmoLength)
Short Definition: Chande's Variable Index Dynamic Average (VIDYA).
Details: This function computes Chande's Variable Index Dynamic Average (VIDYA), which serves as the original moving average for OTT. The 'length' parameter determines the number of bars used to calculate the average of the given source. Lower values result in less smoothing of prices, while higher values lead to greater smoothing. While primarily used internally in this library, it has been made available for users who wish to utilize it as a moving average or use in custom OTT implementations.
Parameters:
source (float) : (series float) Series of values to process.
length (simple int) : (simple int) Number of bars to lookback.
cmoLength (simple int) : (simple int) Number of bars to lookback for calculating CMO. Default value is `9`.
Returns: (float) Calculated average of `source` for `length` bars back.
Example:
vidyaValue = ottlib.f_vidya(source = close, length = 20)
plot(vidyaValue, color = color.blue)
• f_mostTrail(source, multiplier)
Short Definition: Calculates trailing stop value.
Details: This function calculates the trailing stop value for a given source and the percentage. The 'multiplier' parameter defines the percentage of the trailing stop. Lower values are beneficial for catching short-term reversals, while higher values aid in identifying long-term trends. Although only used once internally in this library, it has been made available for users who wish to utilize it as a traditional trailing stop or use in custom OTT implementations.
Parameters:
source (float) : (series int/float) Series of values to process.
multiplier (simple float) : (simple float) Percent of trailing stop.
Returns: (float) Calculated value of trailing stop.
Example:
emaValue = ta.ema(source = close, length = 14)
mostValue = ottlib.f_mostTrail(source = emaValue, multiplier = 2.0)
plot(mostValue, color = emaValue >= mostValue ? color.green : color.red)
• f_ottTrail(source, multiplier)
Short Definition: Calculates OTT-specific trailing stop value.
Details: This function calculates the trailing stop value for a given source in the manner used in OTT. Unlike a traditional trailing stop, this function modifies the traditional trailing stop value from two bars prior by adjusting it further with half the specified percentage. The 'multiplier' parameter defines the percentage of the trailing stop. Lower values are beneficial for catching short-term reversals, while higher values aid in identifying long-term trends. Although primarily used internally in this library, it has been made available for users who wish to utilize it as a trailing stop or use in custom OTT implementations.
Parameters:
source (float) : (series int/float) Series of values to process.
multiplier (simple float) : (simple float) Percent of trailing stop.
Returns: (float) Calculated value of OTT-specific trailing stop.
Example:
vidyaValue = ottlib.f_vidya(source = close, length = 20)
ottValue = ottlib.f_ottTrail(source = vidyaValue, multiplier = 1.5)
plot(ottValue, color = vidyaValue >= ottValue ? color.green : color.red)
• ott(source, length, multiplier)
Short Definition: Calculates OTT (Optimized Trend Tracker).
Details: The OTT consists of two lines. The first, known as the "Support Line", is the VIDYA of the given source. The second, called the "OTT Line", is the trailing stop based on the Support Line. The market is considered to be in an uptrend when the Support Line is above the OTT Line, and in a downtrend when it is below.
Parameters:
source (float) : (series float) Series of values to process. Default value is `close`.
length (simple int) : (simple int) Number of bars to lookback. Default value is `2`.
multiplier (simple float) : (simple float) Percent of trailing stop. Default value is `1.4`.
Returns: ( [ float, float ]) Tuple of `supportLine` and `ottLine`.
Example:
= ottlib.ott(source = close, length = 2, multiplier = 1.4)
longCondition = ta.crossover(supportLine, ottLine)
shortCondition = ta.crossunder(supportLine, ottLine)
• tott(source, length, multiplier, bandsMultiplier)
Short Definition: Calculates TOTT (Twin OTT).
Details: TOTT consists of three lines: the "Support Line," which is the VIDYA of the given source; the "Upper Line," a trailing stop of the Support Line adjusted with an added multiplier; and the "Lower Line," another trailing stop of the Support Line, adjusted with a reduced multiplier. The market is considered in an uptrend if the Support Line is above the Upper Line and in a downtrend if it is below the Lower Line.
Parameters:
source (float) : (series float) Series of values to process. Default value is `close`.
length (simple int) : (simple int) Number of bars to lookback. Default value is `40`.
multiplier (simple float) : (simple float) Percent of trailing stop. Default value is `0.6`.
bandsMultiplier (simple float) : Multiplier for bands. Default value is `0.0006`.
Returns: ( [ float, float, float ]) Tuple of `supportLine`, `upperLine` and `lowerLine`.
Example:
= ottlib.tott(source = close, length = 40, multiplier = 0.6, bandsMultiplier = 0.0006)
longCondition = ta.crossover(supportLine, upperLine)
shortCondition = ta.crossunder(supportLine, lowerLine)
• ott_channel(source, length, multiplier, ulMultiplier, llMultiplier)
Short Definition: Calculates OTT Channels.
Details: OTT Channels comprise nine lines. The central line, known as the "Mid Line," is the OTT of the given source's VIDYA. The remaining lines are positioned above and below the Mid Line, shifted by specified multipliers.
Parameters:
source (float) : (series float) Series of values to process. Default value is `close`
length (simple int) : (simple int) Number of bars to lookback. Default value is `2`
multiplier (simple float) : (simple float) Percent of trailing stop. Default value is `1.4`
ulMultiplier (simple float) : (simple float) Multiplier for upper line. Default value is `0.01`
llMultiplier (simple float) : (simple float) Multiplier for lower line. Default value is `0.01`
Returns: ( [ float, float, float, float, float, float, float, float, float ]) Tuple of `ul4`, `ul3`, `ul2`, `ul1`, `midLine`, `ll1`, `ll2`, `ll3`, `ll4`.
Example:
= ottlib.ott_channel(source = close, length = 2, multiplier = 1.4, ulMultiplier = 0.01, llMultiplier = 0.01)
• risotto(source, length, rsiLength, multiplier)
Short Definition: Calculates RISOTTO (RSI OTT).
Details: RISOTTO comprised of two lines: the "Support Line," which is the VIDYA of the given source's RSI value, calculated based on the length parameter, and the "RISOTTO Line," a trailing stop of the Support Line. The market is considered in an uptrend when the Support Line is above the RISOTTO Line, and in a downtrend if it is below.
Parameters:
source (float) : (series float) Series of values to process. Default value is `close`.
length (simple int) : (simple int) Number of bars to lookback. Default value is `50`.
rsiLength (simple int) : (simple int) Number of bars used for RSI calculation. Default value is `100`.
multiplier (simple float) : (simple float) Percent of trailing stop. Default value is `0.2`.
Returns: ( [ float, float ]) Tuple of `supportLine` and `risottoLine`.
Example:
= ottlib.risotto(source = close, length = 50, rsiLength = 100, multiplier = 0.2)
longCondition = ta.crossover(supportLine, risottoLine)
shortCondition = ta.crossunder(supportLine, risottoLine)
• sott(source, kLength, dLength, multiplier)
Short Definition: Calculates SOTT (Stochastic OTT).
Details: SOTT is comprised of two lines: the "Support Line," which is the VIDYA of the given source's Stochastic value, based on the %K and %D lengths, and the "SOTT Line," serving as the trailing stop of the Support Line. The market is considered in an uptrend when the Support Line is above the SOTT Line, and in a downtrend when it is below.
Parameters:
source (float) : (series float) Series of values to process. Default value is `close`.
kLength (simple int) : (simple int) Stochastic %K length. Default value is `500`.
dLength (simple int) : (simple int) Stochastic %D length. Default value is `200`.
multiplier (simple float) : (simple float) Percent of trailing stop. Default value is `0.5`.
Returns: ( [ float, float ]) Tuple of `supportLine` and `sottLine`.
Example:
= ottlib.sott(source = close, kLength = 500, dLength = 200, multiplier = 0.5)
longCondition = ta.crossover(supportLine, sottLine)
shortCondition = ta.crossunder(supportLine, sottLine)
• hottlott(length, multiplier)
Short Definition: Calculates HOTT & LOTT (Highest & Lowest OTT).
Details: HOTT & LOTT are composed of two lines: the "HOTT Line", which is the OTT of the highest price's VIDYA, and the "LOTT Line", the OTT of the lowest price's VIDYA. A high price surpassing the HOTT Line can be considered a long signal, while a low price dropping below the LOTT Line may indicate a short signal.
Parameters:
length (simple int) : (simple int) Number of bars to lookback. Default value is `20`.
multiplier (simple float) : (simple float) Percent of trailing stop. Default value is `0.6`.
Returns: ( [ float, float ]) Tuple of `hottLine` and `lottLine`.
Example:
= ottlib.hottlott(length = 20, multiplier = 0.6)
longCondition = ta.crossover(high, hottLine)
shortCondition = ta.crossunder(low, lottLine)
• rott(source, length, multiplier)
Short Definition: Calculates ROTT (Relative OTT).
Details: ROTT comprises two lines: the "Support Line", which is the VIDYA of the given source, and the "ROTT Line", the OTT of the Support Line's VIDYA. The market is considered in an uptrend if the Support Line is above the ROTT Line, and in a downtrend if it is below. ROTT is similar to OTT, but the key difference is that the ROTT Line is derived from the VIDYA of two bars of Support Line, not directly from it.
Parameters:
source (float) : (series float) Series of values to process. Default value is `close`.
length (simple int) : (simple int) Number of bars to lookback. Default value is `200`.
multiplier (simple float) : (simple float) Percent of trailing stop. Default value is `0.1`.
Returns: ( [ float, float ]) Tuple of `supportLine` and `rottLine`.
Example:
= ottlib.rott(source = close, length = 200, multiplier = 0.1)
isUpTrend = supportLine > rottLine
isDownTrend = supportLine < rottLine
• ft(source, length, majorMultiplier, minorMultiplier)
Short Definition: Calculates Fırsatçı Trend (Opportunist Trend).
Details: FT is comprised of two lines: the "Support Line", which is the VIDYA of the given source, and the "FT Line", a trailing stop of the Support Line calculated using both minor and major trend values. The market is considered in an uptrend when the Support Line is above the FT Line, and in a downtrend when it is below.
Parameters:
source (float) : (series float) Series of values to process. Default value is `close`.
length (simple int) : (simple int) Number of bars to lookback. Default value is `30`.
majorMultiplier (simple float) : (simple float) Percent of major trend. Default value is `3.6`.
minorMultiplier (simple float) : (simple float) Percent of minor trend. Default value is `1.8`.
Returns: ( [ float, float ]) Tuple of `supportLine` and `ftLine`.
Example:
= ottlib.ft(source = close, length = 30, majorMultiplier = 3.6, minorMultiplier = 1.8)
longCondition = ta.crossover(supportLine, ftLine)
shortCondition = ta.crossunder(supportLine, ftLine)
█ CUSTOM OTT CREATION
Users can create custom OTT implementations using f_ottTrail function in this library. The example code which uses EMA of 7 period as moving average and calculates OTT based of it is below.
Source Code:
//@version=5
indicator("Custom OTT", shorttitle = "COTT", overlay = true)
import ismailcarlik/ottlib/1 as ottlib
src = input.source(close, title = "Source")
length = input.int(7, title = "Length", minval = 1)
multiplier = input.float(2.0, title = "Multiplier", minval = 0.1)
support = ta.ema(source = src, length = length)
ott = ottlib.f_ottTrail(source = support, multiplier = multiplier)
pSupport = plot(support, title = "Moving Average Line (Support)", color = color.blue)
pOtt = plot(ott, title = "Custom OTT Line", color = color.orange)
fillColor = support >= ott ? color.new(color.green, 60) : color.new(color.red, 60)
fill(pSupport, pOtt, color = fillColor, title = "Direction")
Result:
█ DISCLAIMER
Trading is risky and most of the day traders lose money eventually. This library and its functions are only for educational purposes and should not be construed as financial advice. Past performances does not guarantee future results.
FlexiSuperTrend - Strategy [presentTrading]█ Introduction and How it is Different
The "FlexiSuperTrend - Strategy" by PresentTrading is a cutting-edge trading strategy that redefines market analysis through the integration of the SuperTrend indicator and advanced variance tracking.
BTC 6H L/S
This strategy stands apart from conventional methods by its dynamic adaptability, capturing market trends and momentum shifts with increased sensitivity. It's designed for traders seeking a more responsive tool to navigate complex market movements.
Local
█ Strategy, How It Works: Detailed Explanation
The "FlexiSuperTrend - Strategy" employs a multifaceted approach, combining the adaptability of the SuperTrend indicator with variance tracking. The strategy's core lies in its unique formulation and application of these components:
🔶 SuperTrend Polyfactor Oscillator:
- Basic Concept: The oscillator is a series of SuperTrend calculations with varying ATR lengths and multipliers. This approach provides a broader and more nuanced perspective of market trends.
- Calculation:
- For each iteration, `i`, the SuperTrend is calculated using:
- `ATR Length = indicatorLength * (startingFactor + i * incrementFactor)`.
- `Multiplier = dynamically adjusted based on market conditions`.
- The SuperTrend output for each iteration is compared with the indicator source (like hlc3), and the deviation is recorded.
SuperTrend Calculation:
- `Upper Band (UB) = hl2 + (ATR Length * Multiplier)`
- `Lower Band (LB) = hl2 - (ATR Length * Multiplier)`
- Where `hl2` is the average of high and low prices.
Deviation Calculation:
- `Deviation = indicatorSource - SuperTrend Value`
- This value is calculated for each SuperTrend setting in the oscillator series.
🔶 Indicator Source (`hlc3`):
- **Usage:** The strategy uses the average of high, low, and close prices, providing a balanced representation of market activity.
🔶 Adaptive ATR Lengths and Factors:
- Dynamic Adjustment: The strategy adjusts the ATR length and multiplier based on the `startingFactor` and `incrementFactor`. This adaptability is key in responding to changing market volatilities.
- Equation: ATR Length at each iteration `i` is given by `len = indicatorLength * (startingFactor + i * incrementFactor)`.
incrementFactor - 1
incrementFactor - 2
🔶 Normalization Methods:
Purpose: To standardize the deviations for comparability.
- Methods:
- 'Max-Min': Scales the deviation based on the range of values.
- 'Absolute Sum': Uses the sum of absolute deviations for normalization.
Normalization 'Absolute Sum'
- For 'Max-Min': `Normalized Deviation = (Deviation - Min(Deviations)) / (Max(Deviations) - Min(Deviations))`
- For 'Absolute Sum': `Normalized Deviation = Deviation / Sum(Absolute(Deviations))`
🔶 Trading Logic:
The strategy integrates the SuperTrend indicator, renowned for its effectiveness in identifying trend direction and reversals. The SuperTrend's incorporation enhances the strategy's ability to filter out false signals and confirm genuine market trends. * The SuperTrend Toolkit is made by @QuantiLuxe
- Long Entry Conditions: A buy signal is generated when the current trend, as indicated by the SuperTrend Polyfactor Oscillator, turns positive.
- Short Entry Conditions: A sell signal is triggered when the current trend turns negative.
- Entry and Exit Strategy: The strategy opens or closes positions based on these signals, aligning with the selected trade direction (long, short, or both).
█ Trade Direction
The strategy is versatile, allowing traders to choose their preferred trading direction: long, short, or both. This flexibility enables traders to tailor their strategies to their market outlook and risk appetite.
█ Usage
The FlexiSuperTrend strategy is suitable for various market conditions and can be adapted to different asset classes and time frames. Traders should set the strategy parameters according to their risk tolerance and trading goals. It's particularly useful for capturing long-term movements, ideal for swing traders, yet adaptable for short-term trading strategies.
█ Default Settings
1. Trading Direction: Choose from "Long", "Short", or "Both" to define the trade type.
2. Indicator Source (HLC3): Utilizes the HLC3 as the primary price reference.
3. Indicator Length (Default: 10): Influences the moving average calculation and trend sensitivity.
4. Starting Factor (0.618): Initiates the ATR length, influenced by Fibonacci ratios.
5. Increment Factor (0.382): Adjusts the ATR length incrementally for dynamic trend tracking.
6. Normalization Method: Options include "None", "Max-Min", and "Absolute Sum" for scaling deviations.
7. SuperTrend Settings: Varied ATR lengths and multipliers tailor the indicator's responsiveness.
8. Additional Settings: Features mesh style plotting and customizable colors for visual distinction.
The default settings provide a balanced approach, but users are encouraged to adjust them based on their individual trading style and market analysis.

lib_retracement_patternsLibrary "lib_retracement_patterns"
types and functions for XABCD pattern detection and plotting
method set_tolerances(this, tolerance_Bmin, tolerance_Bmax, tolerance_Cmin, tolerance_Cmax, tolerance_Dmin, tolerance_Dmax)
sets tolerances for B, C and D retracements. This creates another Pattern instance that is set as tolerances field on the original and will be used for detection instead of the original ratios.
Namespace types: Pattern
create_config(pattern_line_args, pattern_point_args, name_label_args, retracement_line_args, retracement_label_args, line_args_Dtarget, line_args_completion, line_args_tp1, line_args_tp2, line_args_sl, label_args_completion, label_args_tp1, label_args_tp2, label_args_sl, label_terminal, label_terminal_up_char, label_terminal_down_char, color_bull, color_bear, color_muted, fill_opacity, draw_point_labels, draw_retracements, draw_target_range, draw_levels, hide_shorter_if_shared_legs_greater_than_max, hide_engulfed_pattern, hide_engulfed_pattern_of_same_type, hide_longer_pattern_with_same_X, mute_previous_pattern_when_next_overlaps, keep_failed_patterns)
method direction(this)
Namespace types: Match
method length(this)
return the length of this pattern, determined by the distance between X and D point
Namespace types: Match
method height(this)
return the height of this pattern, determined by the distance between the biggest distance between A/C and X/D
Namespace types: Match
method is_forming(this)
returns true if not complete, not expired and not invalidated
Namespace types: Match
method tostring(this)
return a string representation of all Matches in this map
Namespace types: Match
method tostring(this)
Namespace types: map
remove_complete_and_expired(this)
method add(this, item)
Namespace types: map
method is_engulfed_by(this, other)
checks if this Match is engulfed by the other
Namespace types: Match
method update(tracking_matches, zigzag, patterns, max_age_idx, detect_dir, pattern_minlen, pattern_maxlen, max_sub_waves, max_shared_legs, max_XB_BD_ratio, debug_log)
checks this map of tracking Matches if any of them was completed or invalidated in
Namespace types: map
method mute(this, mute_color, mute_fill_color)
mute this pattern by making it all one color (lines and labels, for pattern fill there's another)
Namespace types: Match
method mute(this, mute_color, mute_fill_color)
mute all patterns in this map by making it all one color (lines and labels, for pattern fill there's another)
Namespace types: map
method hide(this)
hide this pattern by muting it with a transparent color
Namespace types: Match
method reset_styles(this)
reset the style of a muted or hidden match back to the preset configuration
Namespace types: Match
method delete(this)
remove the plot of this Match from the chart
Namespace types: Match
method delete(this)
remove all the plots of the Matches in this map from the chart
Namespace types: map
method draw(this)
draw this Match on the chart
Namespace types: Match
method draw(this, config, all_patterns, debug_log)
draw all Matches in this map, considering all other patterns for engulfing and overlapping
Namespace types: map
method check_hide_or_mute(this, all, config, debug_log)
checks if this pattern needs to be hidden or muted based on other plotted patterns and given configuration
Namespace types: Match
method add_if(id, item, condition)
convenience function to add a search pattern to a list, only if given condition (input.bool) is true
Namespace types: Pattern
Pattern
type to hold retracement ratios and tolerances for this pattern, as well as targets for trades
Config
allows control of pattern plotting shape and colors, as well as settings for hiding overlapped patterns etc.
Match
holds all information on a Pattern and a successful match in the chart. Includes XABCD pivot points as well as all Line and Label objects to draw it

ICT Donchian Smart Money Structure (Expo)█ Concept Overview
The Inner Circle Trader (ICT) methodology is focused on understanding the actions and implications of the so-called "smart money" - large institutions and professional traders who often influence market movements. Key to this is the concept of market structure and how it can provide insights into potential price moves.
Over time, however, there has been a notable shift in how some traders interpret and apply this methodology. Initially, it was designed with a focus on the fractal nature of markets. Fractals are recurring patterns in price action that are self-similar across different time scales, providing a nuanced and dynamic understanding of market structure.
However, as the ICT methodology has grown in popularity, there has been a drift away from this fractal-based perspective. Instead, many traders have started to focus more on pivot points as their primary tool for understanding market structure.
Pivot points provide static levels of potential support and resistance. While they can be useful in some contexts, relying heavily on them could provide a skewed perspective of market structure. They offer a static, backward-looking view that may not accurately reflect real-time changes in market sentiment or the dynamic nature of markets.
This shift from a fractal-based perspective to a pivot point perspective has significant implications. It can lead traders to misinterpret market structure and potentially make incorrect trading decisions.
To highlight this issue, you've developed a Donchian Structure indicator that mirrors the use of pivot points. The Donchian Channels are formed by the highest high and the lowest low over a certain period, providing another representation of potential market extremes. The fact that the Donchian Structure indicator produces the same results as pivot points underscores the inherent limitations of relying too heavily on these tools.
While the Donchian Structure indicator or pivot points can be useful tools, they should not replace the original, fractal-based perspective of the ICT methodology. These tools can provide a broad overview of market structure but may not capture the intricate dynamics and real-time changes that a fractal-based approach can offer.
It's essential for traders to understand these differences and to apply these tools correctly within the broader context of the ICT methodology and the Smart Money Concept Structure. A well-rounded approach that incorporates fractals, along with other tools and forms of analysis, is likely to provide a more accurate and comprehensive understanding of market structure.
█ Smart Money Concept - Misunderstandings
The Smart Money Concept is a popular concept among traders, and it's based on the idea that the "smart money" - typically large institutional investors, market makers, and professional traders - have superior knowledge or information, and their actions can provide valuable insight for other traders.
One of the biggest misunderstandings with this concept is the belief that tracking smart money activity can guarantee profitable trading.
█ Here are a few common misconceptions:
Following Smart Money Equals Guaranteed Success: Many traders believe that if they can follow the smart money, they will be successful. However, tracking the activity of large institutional investors and other professionals isn't easy, as they use complex strategies, have access to information not available to the public, and often intentionally hide their moves to prevent others from detecting their strategies.
Instantaneous Reaction and Results: Another misconception is that market movements will reflect smart money actions immediately. However, large institutions often slowly accumulate or distribute positions over time to avoid moving the market drastically. As a result, their actions might not produce an immediate noticeable effect on the market.
Smart Money Always Wins: It's not accurate to assume that smart money always makes the right decisions. Even the most experienced institutional investors and professional traders make mistakes, misjudge market conditions, or are affected by unpredictable events.
Smart Money Activity is Transparent: Understanding what constitutes smart money activity can be quite challenging. There are many indicators and metrics that traders use to try and track smart money, such as the COT (Commitments of Traders) reports, Level II market data, block trades, etc. However, these can be difficult to interpret correctly and are often misleading.
Assuming Uniformity Among Smart Money: 'Smart Money' is not a monolithic entity. Different institutional investors and professional traders have different strategies, risk tolerances, and investment horizons. What might be a good trade for a long-term institutional investor might not be a good trade for a short-term professional trader, and vice versa.
█ Market Structure
The Smart Money Concept Structure deals with the interpretation of price action that forms the market structure, focusing on understanding key shifts or changes in the market that may indicate where 'smart money' (large institutional investors and professional traders) might be moving in the market.
█ Three common concepts in this regard are Change of Character (CHoCH), and Shift in Market Structure (SMS), Break of Structure (BMS/BoS).
Change of Character (CHoCH): This refers to a noticeable change in the behavior of price movement, which could suggest that a shift in the market might be about to occur. This might be signaled by a sudden increase in volatility, a break of a trendline, or a change in volume, among other things.
Shift in Market Structure (SMS): This is when the overall structure of the market changes, suggesting a potential new trend. It usually involves a sequence of lower highs and lower lows for a downtrend, or higher highs and higher lows for an uptrend.
Break of Structure (BMS/BoS): This is when a previously defined trend or pattern in the price structure is broken, which may suggest a trend continuation.
A key component of this approach is the use of fractals, which are repeating patterns in price action that can give insights into potential market reversals. They appear at all scales of a price chart, reflecting the self-similar nature of markets.
█ Market Structure - Misunderstandings
One of the biggest misunderstandings about the ICT approach is the over-reliance or incorrect application of pivot points. Pivot points are a popular tool among traders due to their simplicity and easy-to-understand nature. However, when it comes to the Smart Money Concept and trying to follow the steps of professional traders or large institutions, relying heavily on pivot points can create misconceptions and lead to confusion. Here's why:
Delayed and Static Information: Pivot points are inherently backward-looking because they're calculated based on the previous period's data. As such, they may not reflect real-time market dynamics or sudden changes in market sentiment. Furthermore, they present a static view of market structure, delineating pre-defined levels of support and resistance. This static nature can be misleading because markets are fundamentally dynamic and constantly changing due to countless variables.
Inadequate Representation of Market Complexity: Markets are influenced by a myriad of factors, including economic indicators, geopolitical events, institutional actions, and market sentiment, among others. Relying on pivot points alone for reading market structure oversimplifies this complexity and can lead to a myopic understanding of market dynamics.
False Signals and Misinterpretations: Pivot points can often give false signals, especially in volatile markets. Prices might react to these levels temporarily but then continue in the original direction, leading to potential misinterpretation of market structure and sentiment. Also, a trader might wrongly perceive a break of a pivot point as a significant market event, when in fact, it could be due to random price fluctuations or temporary volatility.
Over-simplification: Viewing market structure only through the lens of pivot points simplifies the market to static levels of support and resistance, which can lead to misinterpretation of market dynamics. For instance, a trader might view a break of a pivot point as a definite sign of a trend, when it could just be a temporary price spike.
Ignoring the Fractal Nature of Markets: In the context of the Smart Money Concept Structure, understanding the fractal nature of markets is crucial. Fractals are self-similar patterns that repeat at all scales and provide a more dynamic and nuanced understanding of market structure. They can help traders identify shifts in market sentiment or direction in real-time, providing more relevant and timely information compared to pivot points.
The key takeaway here is not that pivot points should be entirely avoided or that they're useless. They can provide valuable insights and serve as a useful tool in a trader's toolbox when used correctly. However, they should not be the sole or primary method for understanding the market structure, especially in the context of the Smart Money Concept Structure.
█ Fractals
Instead, traders should aim for a comprehensive understanding of markets that incorporates a range of tools and concepts, including but not limited to fractals, order flow, volume analysis, fundamental analysis, and, yes, even pivot points. Fractals offer a more dynamic and nuanced view of the market. They reflect the recursive nature of markets and can provide valuable insights into potential market reversals. Because they appear at all scales of a price chart, they can provide a more holistic and real-time understanding of market structure.
In contrast, the Smart Money Concept Structure, focusing on fractals and comprehensive market analysis, aims to capture a more holistic and real-time view of the market. Fractals, being self-similar patterns that repeat at different scales, offer a dynamic understanding of market structure. As a result, they can help to identify shifts in market sentiment or direction as they happen, providing a more detailed and timely perspective.
Furthermore, a comprehensive market analysis would consider a broader set of factors, including order flow, volume analysis, and fundamental analysis, which could provide additional insights into 'smart money' actions.
█ Donchian Structure
Donchian Channels are a type of indicator used in technical analysis to identify potential price breakouts and trends, and they may also serve as a tool for understanding market structure. The channels are formed by taking the highest high and the lowest low over a certain number of periods, creating an envelope of price action.
Donchian Channels (or pivot points) can be useful tools for providing a general view of market structure, and they may not capture the intricate dynamics associated with the Smart Money Concept Structure. A more nuanced approach, centered on real-time fractals and a comprehensive analysis of various market factors, offers a more accurate understanding of 'smart money' actions and market structure.
█ Here is why Donchian Structure may be misleading:
Lack of Nuance: Donchian Channels, like pivot points, provide a simplified view of market structure. They don't take into account the nuanced behaviors of price action or the complex dynamics between buyers and sellers that can be critical in the Smart Money Concept Structure.
Limited Insights into 'Smart Money' Actions: While Donchian Channels can highlight potential breakout points and trends, they don't necessarily provide insights into the actions of 'smart money'. These large institutional traders often use sophisticated strategies that can't be easily inferred from price action alone.
█ Indicator Overview
We have built this Donchian Structure indicator to show that it returns the same results as using pivot points. The Donchian Structure indicator can be a useful tool for market analysis. However, it should not be seen as a direct replacement or equivalent to the original Smart Money concept, nor should any indicator based on pivot points. The indicator highlights the importance of understanding what kind of trading tools we use and how they can affect our decisions.
The Donchian Structure Indicator displays CHoCH, SMS, BoS/BMS, as well as premium and discount areas. This indicator plots everything in real-time and allows for easy backtesting on any market and timeframe. A unique candle coloring has been added to make it more engaging and visually appealing when identifying new trading setups and strategies. This candle coloring is "leading," meaning it can signal a structural change before it actually happens, giving traders ample time to plan their next trade accordingly.
█ How to use
The indicator is great for traders who want to simplify their view on the market structure and easily backtest Smart Money Concept Strategies. The added candle coloring function serves as a heads-up for structure change or can be used as trend confirmation. This new candle coloring feature can generate many new Smart Money Concepts strategies.
█ Features
Market Structure
The market structure is based on the Donchian channel, to which we have added what we call 'Structure Response'. This addition makes the indicator more useful, especially in trending markets. The core concept involves traders buying at a discount and selling or shorting at a premium, depending on the order flow. Structure response enables traders to determine the order flow more clearly. Consequently, more trading opportunities will appear in trending markets.
Structure Candles
Structure Candles highlight the current order flow and are significantly more responsive to structural changes. They can provide traders with a heads-up before a break in structure occurs
-----------------
Disclaimer
The information contained in my Scripts/Indicators/Ideas/Algos/Systems does not constitute financial advice or a solicitation to buy or sell any securities of any type. I will not accept liability for any loss or damage, including without limitation any loss of profit, which may arise directly or indirectly from the use of or reliance on such information.
All investments involve risk, and the past performance of a security, industry, sector, market, financial product, trading strategy, backtest, or individual's trading does not guarantee future results or returns. Investors are fully responsible for any investment decisions they make. Such decisions should be based solely on an evaluation of their financial circumstances, investment objectives, risk tolerance, and liquidity needs.
My Scripts/Indicators/Ideas/Algos/Systems are only for educational purposes!

Chart Time and Price Range It is easy to loose track of time and price volatility when the chart automatically scales to the bars on the chart. This helps you keep track.
This is a very simple indicator that is designed to ensure that you're looking at a segment of the chart that is relevant to the trade you're considering in both price distance and time.
The Problem:
When looking at a chart the lowest price is at the bottom of the screen, the highest price is at the top. The time at the beginning of the chart is based on how many bars and what timeframe you're looking at.
But is the price difference between the two wide or narrow? Are you seeing minutes, hours, or days of price action?
You can get the measure tool out, but you'll change the zoom level and now its different. You change the timeframe and its different.
This Solution:
This indicator puts a table on the screen that will tell you the X/Y distance of everything that is on your chart. If your hold period is 5 minutes, why would you be looking at 3 days of price action to find s/r or make a decision on a trade?
This will show you how much price opportunity was available in the amount of time you are currently viewing. Using the PineCoders VisibleChart library, we're retrieving the time and bar_index of the beginning of the chart so that everything that is currently on the chart is measured and it adapts as that changes.
It will work with light and dark themes (you can change the colors) and can be positioned wherever you prefer to see the information.
Disclaimer: This was a quick release script. I wrote it and published the same day. There could be bugs, so send me a message or add a comment to report anything that isn't behaving correctly.

Live PnL v1.0Live P&L for multiple stocks, currencies, crypto and commodities can now be tracked for your favorite scripts, pair trading etc.
This indicator gives provision to add up to 3 stocks/futures/currency with Buy and Sell, Quantity (can be lot size or any other) and Entry Price and set as default so that every time you put back this indicator you can monitor the live Profit / Loss figure.
This indicator will help trade to evaluate and track tips/trades of experts on social media and Media platforms and check their accuracy themselves in an organized way.
Apart from paper trading a trade or multiple positions ones combined together it also gives a feeler of combined Mark to live Market Drawdowns or Profitability.

The Price of Hard MoneyIf we calculate “the price of hard money” (the market capitalization weighted price of gold plus Bitcoin); we get this chart.
Since 2017, Bitcoin’s share of hard money growth has been increasing, we can see it visibly on the gold chart by a widening delta between the price of hard money and the Gold price. We can also see some interesting technical behaviours.
In 2021, Hard Money broke out and held this breakout above the 2011 Gold high. Only later in 2022 did a correction of 20% occur – typical of Golds historic volatility in periods of inflation and high interest rates.
Hard Money is at major support and we have evidence for a fundamental shift in investor capital flows away from gold and into Bitcoin.
This Indicator is useful:
- To track the market capitalization of Gold (estimated), Bitcoin and combined market capitalization of Hard Money.
- To track the price action and respective change in investor flows from Gold to Bitcoin .
Provided Bitcoin continues to suck more value out of gold with time, this chart will be useful for tracking price action of the combined asset classes into the years to come.

Big Whale Purchases and SalesBig Whale Purchases and Sales - plots big whale transactions on your chart!
People that hold more than 1% of a crypto currencies circulating supply are considered whales and have a huge influence on price, not just because they can move the market with their huge transactions, but also because other traders often track their wallets and follow their example. Taking a look at whale holdings, one can see why whale worship is so common in crypto: While Bitcoin has a relatively low whale concentration, many of the Top 100 Cryptocurrencies have whales control 60% or more of their circulating supply.
Integrating IntoTheBlock data, this script plots the transactions of these whales and, in strategy mode, copy trades them.
Features:
Strategy Mode: Switches the script between an indicator and a strategy.
Standard Deviations: The number of Standard Deviations that a transaction needs to surpass to be considered worth plotting. Setting this to 0 will show all whale transactions, higher settings will only show the biggest transactions.
Blockchain: The Chain on which Whale activity is tracked.

Compare Crypto Bollinger Bands//This is not financial advice, I am not a financial advisor.
//What are volatility tokens?
//Volatility tokens are ERC-20 tokens that aim to track the implied volatility of crypto markets.
//Volatility tokens get their exposure to an asset’s implied volatility using FTX MOVE contracts.
//There are currently two volatility tokens: BVOL and IBVOL.
//BVOL targets tracking the daily returns of being 1x long the implied volatility of BTC
//IBVOL targets tracking the daily returns of being 1x short the implied volatility of BTC.
/////////////////////////////////////////////////////////////////
CAN USE ON ANY CRYPTO CHART AS BINANCE:BTCUSD is still the most dominant crypto, positive volatility for BTC is positive for all.
/////////////////////////////////////////////////////////////////
//The Code.
//The blue line (ChartLine) is the current chart plotted on in Bollinger
//The red line (BVOLLine) plots the implied volatility of BTC
//The green line (IBVOLLine) plot the inverse implied volatility of BTC
//The orange line (TOTALLine) plots how well the crypto market is performing on the Bolling scale. The higher the number the better.
//There are 2 horizontal lines, 0.40 at the bottom & 0.60 at the top
/////////To Buy
//1. The blue line (ChartLine) must be higher than the green line (IBVOLLine)
//2. The green line (IBVOLLine) must be higher than the red line (BVOLLine)
//3. The red line (BVOLLine) must be less than 0.40 // This also acts as a trendsetter
//4. The orange line (TOTALLine) MUST be greater than the red line. This means that the crypto market is positive.
//5.IF THE BLUE LINE (ChartLine) IS GREATER THAN THE ORANGE LINE (TOTALLine) IT MEANS YOUR CRYPTO IS OUTPERFOMING THE MARKET {good for short term explosive bars}
//6. If the orange line (TOTALLine) is higher than your current chart, say BTCUSD. And BTC is going up to. It just means BTC is going up slowly. it's fine as long as they are moving in the same position.
//5. I use this on the 4hr, 1D, 1W timeframes
///////To Exit
//1.If the blue line (ChartLine) crosses under the green line (IBVOLLine) exit{ works best on 4hr,1D, 1W to avoid fakes}
//2.If the red line crosses over the green line when long. {close positions, or watch positions} It means negative volatility is wining

Example - MA-Cross Retracement DetectionThe retracement tracker function(s) in this script outline how to:
Track conditions using "toggle" booleans.
Use multiple coinciding conditions to trigger an event just once.
What is a retracement?
"Retracements are temporary price reversals that take place within a
larger trend. The key here is that these price reversals are temporary
and do not indicate a change in the larger trend."
Quote Source: www.investopedia.com

BEST Engulfing + Breakout StrategyHello traders
This is a simple algorithm for a Tradingview strategy tracking a convergence of 2 unrelated indicators.
Convergence is the solution to my trading problems.
It's a puzzle with infinite possibilities and only a few working combinations.
Here's one that I like
- Engulfing pattern
- Price vs Moving average for detecting a breakout
Definition
Take out the notebooks :) and some coffee (good for focus). I'm bullish in coffee
The engulfing pattern is a two-candle reversal pattern.
The second candle completely ‘engulfs’ the real body of the first one, without regard to the length of the tail shadows.
The bullish Engulfing pattern appears in a downtrend and is a combination of one red candle followed by a larger green candle
The bearish Engulfing pattern appears in a downtrend and is a combination of one green candle followed by a larger red candle
Example: imgur.com
We're bored sir... what's the point of all this?
In summary, an engulfing is a pattern to track reversals. (the whole TradingView audience stands up now giving a standing ovation)
Adding the Price vs Moving average filters allows to track reversals with momentums (half of the audience collapsed because this is too awesome)
Ok sir... you picked up my interest
I included some cool backtest filters:
- date range filtering
- flexible take profit in USD value (plotted in blue)
- flexible stop loss in USD value (plotted in red)
All the best
Dave

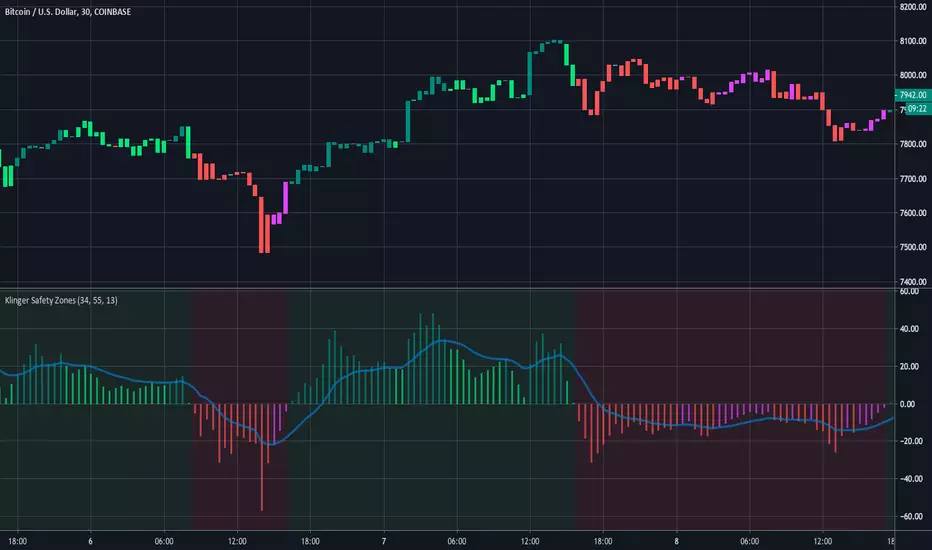
Klinger Safety ZonesThis indicator is based on the Klinger Volume Oscillator, or KVO. The KVO is pretty cool since it can track long-term changes in money flow (both into and out of a market), as well as respond and predict short term price fluctuations.
The Klinger Oscillator determines the direction (or trend) of money flow based on the high, low, and closing price of the security. It then compares all three values (HLC/3) to the previous period’s values to determine how volume should be factored into the KVO. If the current period’s price is greater than that of the previous period, then volume is added. It is subtracted, however, if the price is less than the previous period. This utilization of volume is what makes it an accurate tracker of money flow and a valuable confirmation indicator. This value is often called volume force or the “trend” line.
A fast and slow EMA of the volume force are then calculated. The fast EMA has a smaller window length, while the slow EMA has a larger window. Traders can adjust the lengths of each EMA in the input option menu, but we chose the standard 55 and 34 period lengths as the default settings. We are finally left with the actual KVO value after subtracting the slow EMA from the fast EMA.
The Klinger Oscillator uses a signal line similar to the MACD and many other indicators. The default length for it is 13, but that length can also be adjusted in the input menu. A shorter length will result in more responsiveness but possibly more false signals and whipsaws.
The Chart and Interpretation:
The histogram shows the KVO series. Remember, since the Oscillator represents the difference between the fast and slow EMA, the KVO is bullish when it is greater than zero and bearish when it is less than zero.
When the KVO is greater than zero, the background on the chart is green, meaning that the trend is bullish and traders should look to go long. On the flip side, the background is red when the KVO is less than zero meaning traders should look to go short.
The aqua line plotted on top of the histogram is the signal line.
Here is a quick summary of the histogram colors:
(if KVO > 0 and KVO > signal)
then (color = teal)
if (KVO > 0 and KVO < signal)
then (color = lime)
if (KVO < 0 and KVO < signal)
then (color = red)
if (KVO < 0 and KVO > signal)
then (color = pink)
Users can choose to have the candles change color to match the KVO histogram color by adjusting the setting in the input menu.
~Happy (and safe) trading~
Sentinel Market Structure [JOAT]
Sentinel Market Structure - Smart Money Structure Analysis
Introduction and Purpose
Sentinel Market Structure is an open-source overlay indicator that identifies swing highs/lows, tracks market structure (HH/HL/LH/LL), detects Break of Structure (BOS) and Change of Character (CHoCH) signals, and marks order blocks. The core problem this indicator solves is that retail traders often miss structural shifts that smart money traders use to identify trend changes.
This indicator addresses that by automatically tracking market structure and alerting traders to key structural breaks that often precede significant moves.
Why These Components Work Together
Each component provides different structural information:
1. Swing Detection - Identifies significant pivot highs and lows. These are the building blocks of market structure.
2. Structure Labels (HH/HL/LH/LL) - Classifies each swing relative to the previous swing. Higher Highs + Higher Lows = uptrend. Lower Highs + Lower Lows = downtrend.
3. Break of Structure (BOS) - Identifies when price breaks a swing level in the direction of the trend. This is a continuation signal.
4. Change of Character (CHoCH) - Identifies when price breaks a swing level against the trend. This is a potential reversal signal.
5. Order Blocks - Marks the last opposing candle before an impulse move. These zones often act as future support/resistance.
How the Detection Works
Swing Detection:
bool swingHighDetected = high == ta.highest(high, swingLength * 2 + 1)
bool swingLowDetected = low == ta.lowest(low, swingLength * 2 + 1)
BOS vs CHoCH Logic:
// BOS: Break in direction of trend (continuation)
bool bullishBOS = close > lastSwingHigh and marketTrend >= 0
// CHoCH: Break against trend (reversal signal)
bool bullishCHOCH = close > lastSwingHigh and marketTrend < 0
Order Block Detection:
bool bullOB = close < open and // Previous candle bearish
close > open and // Current candle bullish
close > high and // Breaking above
(high - low) > ta.atr(14) * 1.5 // Strong impulse
Signal Types
HH (Higher High) - Swing high above previous swing high (bullish structure)
HL (Higher Low) - Swing low above previous swing low (bullish structure)
LH (Lower High) - Swing high below previous swing high (bearish structure)
LL (Lower Low) - Swing low below previous swing low (bearish structure)
BOS↑/BOS↓ - Break of structure in trend direction (continuation)
CHoCH↑/CHoCH↓ - Change of character against trend (potential reversal)
Dashboard Information
Trend - Current market bias (BULLISH/BEARISH/NEUTRAL)
Swing High - Last swing high price with HH/LH label
Swing Low - Last swing low price with HL/LL label
Structure - Current structure state (HH+HL, LH+LL, etc.)
Price - Price position relative to structure
How to Use This Indicator
For Trend Following:
1. Identify trend using structure (HH+HL = uptrend, LH+LL = downtrend)
2. Enter on BOS signals in trend direction
3. Use swing levels for stop placement
For Reversal Trading:
1. Watch for CHoCH signals (break against trend)
2. Confirm with order block formation
3. Enter on retest of order block zone
For Risk Management:
1. Place stops beyond swing highs/lows
2. Use structure lines as trailing stop references
3. Exit when CHoCH signals against your position
Input Parameters
Swing Detection Length (5) - Bars on each side for pivot detection
Show Swing High/Low Points (true) - Toggle swing markers
Show BOS/CHoCH (true) - Toggle structural break signals
Show Structure Lines (true) - Toggle horizontal swing lines
Show Order Blocks (true) - Toggle order block zones
Zone Extension (50) - How far order block boxes extend
Timeframe Recommendations
15m-1H: Good for intraday structure analysis
4H-Daily: Best for swing trading structure
Lower timeframes require smaller swing detection length
Limitations
Swing detection has inherent lag (needs confirmation bars)
Not all BOS/CHoCH signals lead to continuation/reversal
Order block zones are simplified (not full ICT methodology)
Structure analysis is subjective - different traders see different swings
Open-Source and Disclaimer
This script is published as open-source under the Mozilla Public License 2.0 for educational purposes.
This indicator does not constitute financial advice. Market structure analysis does not guarantee trade outcomes. Always use proper risk management.
- Made with passion by officialjackofalltrades

Current & Prior Day OHLC Levels# Current & Prior Day OHLC Levels with 15-Minute Opening Range
## Overview
This comprehensive indicator plots key price levels for futures and stock traders, displaying Current Day levels, Prior Day levels, and the 15-Minute Opening Range. These levels serve as critical support and resistance zones that professional traders monitor throughout the trading session.
## Key Features
### Current Day Levels (Session-Based)
- **Current Open**: The opening price of the current trading session
- **Current High**: The highest price reached during the current session (updates in real-time)
- **Current Low**: The lowest price reached during the current session (updates in real-time)
The indicator properly recognizes **futures trading sessions**, which begin at their respective session start times (not midnight). For example, most equity index futures sessions begin at 6:00 PM ET the previous day, ensuring accurate session-based tracking for overnight and globex trading.
### Prior Day Levels
- **Prior Open**: Opening price from the previous trading session
- **Prior High**: High of the previous trading session
- **Prior Low**: Low of the previous trading session
- **Prior Close**: Closing price from the previous trading session
Prior day levels are some of the most widely watched technical levels in trading, often acting as psychological support and resistance zones where price action tends to react.
### 15-Minute Opening Range (NY Session)
- **OR High**: The high of the first 15 minutes after New York market open (9:30-9:45 AM ET)
- **OR Low**: The low of the first 15 minutes after New York market open (9:30-9:45 AM ET)
The opening range concept is a popular day trading strategy. The first 15 minutes often establishes the tone for the day, with these levels frequently serving as breakout or breakdown points. The indicator tracks these levels in real-time as they form, then locks them in after 9:45 AM ET.
## Visual Design
### Smart Line Extension
- Lines extend **left** to the exact bar that created each level (e.g., the bar that made the high)
- Lines extend **right** by a configurable number of bars (default: 50 bars)
- No infinite line extension cluttering your chart
### Intelligent Label Placement
- Labels positioned **above** highs and opens
- Labels positioned **below** lows
- Adjustable offset to position labels optimally for your timeframe
- Optional price display in labels (e.g., "Current High: 5,950.00")
- Semi-transparent label backgrounds for clean chart appearance
## Customization Options
### Individual Level Controls
Each level (Current Open, High, Low, Prior Open, High, Low, Close, OR High, OR Low) can be:
- Toggled on/off independently
- Assigned a custom color
- Given its own line style (Solid, Dashed, or Dotted)
- Adjusted for line width (1-5 pixels)
### Default Styling
- **Current Day**: Solid lines (Gold for Open, Green for High, Red for Low)
- **Prior Day**: Dashed lines (Steel Blue for Open, Dark Cyan for High, Crimson for Low, Slate Blue for Close)
- **Opening Range**: Dotted lines (Cyan for High, Tomato for Low)
This default styling provides clear visual distinction between level types while remaining professional and easy to read.
### Label Customization
- Toggle all labels on/off
- Show or hide price values in labels
- Adjust label offset (distance from current bar)
- Five label size options: Tiny, Small, Normal, Large, Huge
### Line Extension Control
- Configurable right extension (0-500 bars)
- Adjust based on your chart timeframe and preference
## Best Use Cases
### Futures Traders
The indicator's session-aware design makes it perfect for futures markets, properly handling:
- Electronic trading hours (Globex)
- Session rollovers at 5:00 PM or 6:00 PM ET (depending on contract)
- Overnight price action
### Day Traders
- Use Opening Range levels for breakout/breakdown strategies
- Monitor Current High/Low for intraday trend identification
- Watch Prior Day levels for profit targets and stop placement
### Swing Traders
- Prior Day High/Low often act as key decision points
- Prior Close serves as an important reference level
- Current Day levels help with intraday entry/exit timing
### Multi-Timeframe Analysis
Works on any intraday timeframe:
- 1-minute for scalping
- 5-minute for active day trading
- 15-minute or 30-minute for swing entries
- 1-hour for position context
## Technical Details
### Session Detection
- Uses TradingView's built-in session detection for accurate daily boundaries
- Properly handles futures contracts with non-midnight session starts
- New York timezone detection for Opening Range (9:30 AM ET)
### Real-Time Updates
- Current High and Low update dynamically as price moves
- Opening Range levels update live during the 9:30-9:45 AM window
- Lines redraw on each bar to maintain accurate positioning
### Performance
- Maximum 500 lines and 500 labels to ensure smooth chart performance
- Efficient line/label deletion and recreation on session changes
- Minimal computational overhead
## Tips for Optimal Use
1. **Adjust Line Extension**: For lower timeframes (1-min, 5-min), reduce right extension to 20-30 bars. For higher timeframes (1-hour), increase to 100+ bars.
2. **Combine with Price Action**: These levels work best when combined with candlestick patterns, volume analysis, and order flow.
3. **Watch for Level Tests**: Price often tests these levels multiple times before breaking through or reversing.
4. **Opening Range Breakouts**: Many traders wait for price to break and close above OR High or below OR Low before entering directional trades.
5. **Prior Day Levels as Targets**: Use Prior High as an upside target and Prior Low as a downside target for intraday trades.
## Compatibility
- Works on all instruments (Futures, Stocks, Forex, Crypto)
- Optimized for intraday timeframes (1-min to 1-hour)
- Best results on liquid instruments with clear session boundaries
- Designed specifically with ES, NQ, YM, and RTY futures traders in mind
## Credits
Ported from NinjaTrader indicators with enhanced features and TradingView-specific optimizations. Original concept based on classic technical analysis principles used by professional traders worldwide.
---
*Note: These levels are for informational and educational purposes only. Past performance does not guarantee future results. Always practice proper risk management.*

Liquidation Map [Alpha Extract]A sophisticated liquidity distribution visualization system that identifies potential liquidation zones through pivot-based detection and renders them as an interactive histogram with cumulative distance-to-liquidation curves. Utilizing multi-exchange volume aggregation and ATR-scaled pocket detection, this indicator delivers institutional-grade liquidity mapping with real-time histogram display showing relative concentration of long and short liquidation levels across configurable price ranges. The system's box-based rendering architecture combined with cumulative distribution overlays provides comprehensive visual assessment of asymmetric liquidity positioning for strategic trade planning.
🔶 Advanced Multi-Exchange Aggregation Framework
Implements intelligent ticker detection and multi-source volume aggregation across major exchanges including Binance, Bybit, KuCoin, OKX, and MEXC for accurate liquidity weight calculations. The system automatically identifies base currency (BTC, ETH, SOL) from chart ticker, retrieves volume data from matching perpetual contracts across multiple venues, and aggregates into composite volume metric for enhanced pocket weighting accuracy.
🔶 Pivot-Based Liquidation Pocket Detection
Features sophisticated swing point identification using configurable pivot width with ATR-scaled vertical zone construction for volatility-adaptive pocket sizing. The system detects pivot highs for short liquidation zones (placed above swing) and pivot lows for long liquidation zones (placed below swing), applying 200-period ATR with percentage multipliers to determine pocket heights that adjust to market volatility conditions.
🔶 Interactive Histogram Visualization Engine
Provides real-time box-based histogram rendering in indicator pane with configurable bin counts (up to 400 columns) and adjustable height, displaying liquidity concentration across fixed percentage range above and below current price. The system calculates bin sizes from view range, accumulates pocket weights into price bins, and renders vertical bars with gradient color intensity reflecting relative liquidity concentration at each price level.
🔶 Cumulative Distance Overlay System
Implements innovative cumulative distribution curves showing aggregate liquidity distance from current price for both long (left) and short (right) positions. The system calculates running totals of pocket weights from current price outward in both directions, normalizes against maximum span, and overlays line segments showing how much total liquidity exists at various distances, enabling instant assessment of liquidation cascade potential.
🔶 Dynamic Price Range Adaptation
Features fixed percentage-based view window that maintains consistent price range visualization across all timeframes and instruments, automatically centering histogram on current price with configurable +/- percentage bounds. The system recalculates histogram bins and pocket distributions on each bar close, ensuring visualization adapts to price movement while maintaining interpretable scale regardless of volatility regime.
🔶 Touch Detection and Weight Adjustment
Provides intelligent pocket state tracking that identifies when price trades through liquidation zones and applies configurable weight multipliers to touched pockets for historical context. The system monitors price interaction with pocket midpoints, marks pockets as "hit" when violated, and optionally increases their visual weight (default 5x) to emphasize historical liquidation levels while distinguishing from untouched future zones.
🔶 Gradient Intensity Color System
Implements sophisticated color gradient engine that modulates bar opacity from transparent to opaque based on relative liquidity concentration within each bin. The system normalizes bin values against maximum liquidity, applies color interpolation from faded to vivid hues, and distinguishes long liquidation zones (cyan) from short liquidation zones (yellow/gold) with current price column highlighted in red for instant orientation.
🔶 Performance-Optimized Rendering Architecture
Utilizes efficient box and line object management with dynamic allocation based on histogram configuration, implementing intelligent cleanup and reuse to maintain smooth performance. The system includes adaptive line budget calculations that adjust segment density for cumulative curves based on available object limits, ensuring consistent operation even with maximum histogram resolution settings.
🔶 Asymmetric Distribution Analysis
Calculates separate cumulative distributions for long and short liquidation zones split at current price, enabling identification of imbalanced liquidity positioning. The system normalizes distributions against respective maximums and overlays both curves on single histogram, allowing traders to instantly assess whether more liquidation risk exists above (shorts vulnerable) or below (longs vulnerable) current price levels.
🔶 Configurable Label and Scale System
Provides price axis labeling with adjustable frequency to reduce clutter while maintaining reference points, displaying price values at regular column intervals with configurable offset positioning. The system includes current price label showing exact value and percentile position within view range, offering both absolute price reference and relative positioning context for distribution interpretation.
🔶 Historical Pocket Persistence Framework
Maintains rolling window of liquidation pockets up to 3000 bars with automatic expiration management and optional preservation of touched zones for historical analysis. The system tracks pocket creation time, monitors age against lookback limits, and manages array cleanup to prevent memory overflow while retaining relevant historical liquidation levels for pattern recognition and support/resistance validation.
This indicator delivers sophisticated liquidity distribution analysis through histogram visualization and cumulative distance curves that reveal asymmetric positioning of potential liquidation levels. Unlike simple liquidation heatmaps that show absolute levels, the Liquidation Map's cumulative distribution overlays instantly communicate how much total liquidity exists at various distances from current price, enabling assessment of cascade potential. The system's multi-exchange volume aggregation, touch-weighted historical zones, and fixed-range visualization make it essential for traders seeking strategic positioning around institutional liquidity clusters in cryptocurrency futures markets. The histogram format enables instant identification of price levels where concentrated liquidations may trigger significant volatility or reversal events, while the asymmetric distribution curves reveal whether market structure favors upside or downside cascades.

Anchored VWAP PercentageINDICATOR: ANCHORED VWAP PERCENTAGE (AVWAP)
1. Overview
The Anchored VWAP Percentage (AVWAP) is a quantitative momentum and mean-reversion tool. It measures the percentage distance between the current price and a Volume Weighted Average Price (VWAP) that resets automatically based on specific time cycles. It allows traders to identify overextended market conditions relative to institutional value.
---
2. Core Logic & Calculation
The script tracks the relationship between price and volume starting from a specific Anchor Point .
* Volume-Weighted Foundation: Unlike simple moving averages, this indicator uses the VWAP formula: sum(Volume * Price) / sum(Volume) .
* Automatic Anchoring: The starting point (Anchor) resets automatically depending on the chart timeframe (e.g., resets weekly on a 15m chart, or yearly on a Daily chart).
* Percentage Deviation: It calculates the precise gap between the price and the VWAP, plotted as an oscillator: ((Price - VWAP) / VWAP) * 100 .
---
3. Adaptive Intelligence (Multi-Asset & Multi-TF)
The AVWAP is built with an internal database of 85th Percentile (P85) volatility thresholds. It recognizes that different assets have different "stretching" limits:
1. Asset-Specific Calibration: It includes optimized data for Bitcoin, Ethereum, Altcoins, Forex, and Indices .
2. Dynamic Timeframe Mapping: The anchor period and the exhaustion thresholds adjust automatically. For example:
* Intraday (1m-5m): Anchors to an 8-hour (480 min) cycle.
* Mid-Term (15m-60m): Anchors to a Weekly (W) cycle.
* Swing (Daily): Anchors to a Yearly (12M) cycle.
---
4. Visual Anatomy
The indicator is designed for high-speed decision-making:
* The Histogram:
* Green: Price is trading above the VWAP (Bullish premium).
* Red: Price is trading below the VWAP (Bearish discount).
* P85 Threshold Lines:
* These lines represent the 85th percentile of historical deviations . Historically, the price stays within these boundaries 85% of the time.
* Background Highlighting: When the histogram crosses the P85 line, the background glows, signaling a Statistical Exhaustion Zone where a retracement to the mean is highly probable.
---
5. How to Trade with AVWAP
* Mean Reversion: When the histogram reaches the P85 Zone , the price is "statistically overextended." This is a prime area to look for reversals or to take profits on existing trends.
* Trend Strength: If the histogram stays near the Zero Line while the price moves, the trend is supported by healthy volume.
* Value Area: The Zero Line represents the Fair Value . Buying near the Zero Line during a bullish histogram (Green) offers a high-probability entry with low risk.
---
6. Technical Parameters
* Asset Selection: A dropdown to switch between Crypto, Forex, and Indices.
* Color Customization: User-defined colors for bullish and bearish sentiment.
* Precision Control: 4-decimal precision for accurate tracking of thin-margin assets like Forex.

Stop Loss Hunting Zones This Pine Script indicator identifies and visualizes potential "stop loss hunting zones" on charts. It marks price levels where institutional traders or market makers might trigger retail stop losses before reversing direction, helping traders avoid false breakouts and better time their entries.
Key Features:
Four Types of Detection Zones-
1.Swing Zones (Red/Green): Identifies swing highs and lows using pivot point analysis where stop losses typically cluster above resistance and below support levels.
2.Breakout Zones (Orange): Detects consolidation periods and marks levels where false breakouts might occur, trapping traders who enter too early.
3.Wick Trap Zones (Purple): Highlights candles with disproportionately large wicks relative to body size, indicating potential stop loss raids with quick reversals.
4.Volume Reversal Zones (Blue): Identifies high-volume reversal patterns where price briefly touches a level before sharply reversing, suggesting stop loss absorption.
Customizable Parameters:
Swing Lookback: Period for pivot point detection (5-100 bars)
Swing Threshold: Minimum percentage move to qualify as a swing (0.5-10%)
Volume Threshold: Multiplier for detecting unusual volume (1-5x average)
Wick Ratio: Minimum wick-to-total range ratio for trap detection (0.3-0.9)
ATR Settings: Length and multiplier for zone buffer calculation
Zone Management: Maximum zones per type and minimum distance between zones
Display Options: Toggle individual zone types, heatmap intensity, labels, and transparency
Visual Features:
Heatmap Mode: Colour intensity reflects how often price has tested each zone
Smart Zone Management: Prevents chart cluttering by limiting zones and removing those too close together
Dynamic Labels: Clear zone identification with customizable display
Adjustable Transparency: Control zone visibility (10-90%)
How It Works:
The indicator uses ATR-based buffers to create zones around detected levels. It tracks price history to calculate "intensity" scores for the heatmap feature, helping identify the most significant hunting zones. The algorithm ensures zones are meaningful by enforcing minimum distances and limiting total zones displayed.
Avoid placing stop losses at obvious levels where hunting is likely
Identify potential reversal points for counter-trend trades
Recognize false breakout patterns before they complete
Time entries after stop loss hunts are absorbed
Technical Details:
Maximum 500 boxes, lines, and labels for comprehensive zone tracking
Compatible with all timeframes
Works on any market (stocks, forex, crypto, futures)
Real-time detection as new bars confirm
This indicator is designed for traders who want to understand where institutional players might target retail stop losses and use that information to their advantage. Please boost & follow for more. Happy trading !!
Disclaimer: This indicator is for educational and informational purposes only. It should not be considered financial advice. Always perform your own analysis and risk management before trading.

Multi-indicator Signal Builder [Skyrexio]Overview
Multi-Indicator Signal Builder is a versatile, all-in-one script designed to streamline your trading workflow by combining multiple popular technical indicators under a single roof.
It features a single-entry, single-exit logic, intrabar stop-loss/take-profit handling, an optional time filter, a visually accessible condition table, and a built-in statistics label.
Traders can choose any combination of 12+ indicators (RSI, Ultimate Oscillator, Bollinger %B, Moving Averages, ADX, Stochastic, MACD, PSAR, MFI, CCI, Heikin Ashi, and a “TV Screener” placeholder) to form entry or exit conditions.
This script aims to simplify strategy creation and analysis , making it a powerful toolkit for technical traders.
Indicators Overview
RSI (Relative Strength Index)
Measures recent price changes to evaluate overbought or oversold conditions on a 0–100 scale.
Ultimate Oscillator (UO)
Uses weighted averages of three different timeframes, aiming to confirm price momentum while avoiding false divergences.
Bollinger %B
Expresses price relative to Bollinger Bands, indicating whether price is near the upper band (overbought) or lower band (oversold).
Moving Average (MA)
Smooths price data over a specified period. The script supports both SMA and EMA to help identify trend direction and potential crossovers.
ADX (Average Directional Index)
Gauges the strength of a trend (0–100). Higher ADX signals stronger momentum, while lower ADX indicates a weaker trend.
Stochastic
Compares a closing price to a price range over a given period to identify momentum shifts and potential reversals.
MACD (Moving Average Convergence/Divergence)
Tracks the difference between two EMAs plus a signal line, commonly used to spot momentum flips through crossovers.
PSAR (Parabolic SAR)
Plots a trailing stop-and-reverse dot that moves with the trend. Often used to signal potential reversals when price crosses PSAR.
MFI (Money Flow Index)
Similar to RSI but incorporates volume data. A reading above 80 can suggest overbought conditions, while below 20 may indicate oversold.
CCI (Commodity Channel Index)
Identifies cyclical trends or overbought/oversold levels by comparing current price to an average price over a set timeframe.
Heikin Ashi
A type of candlestick charting that filters out market noise. The script uses a streak-based approach (multiple consecutive bullish or bearish bars) to gauge mini-trends.
TV Screener
A placeholder condition designed to integrate external buy/sell logic (like a TradingView “Buy” or “Sell” rating). Users can override or reference external signals if desired.
Unique Features
Multi-Indicator Entry and Exit
You can selectively enable any subset of 12+ classic indicators, each with customizable parameters and conditions. A position opens only if all enabled entry conditions are met, and it closes only when all enabled exit conditions are satisfied, helping reduce false triggers.
Single-Entry / Single-Exit with Intrabar SL/TP
The script supports a single position at a time. Once a position is open, it monitors intrabar to see if the price hits your stop-loss or take-profit levels before the bar closes, making results more realistic for fast-moving markets.
Time Window Filter
Users may specify a start/end date range during which trades are allowed, making it convenient to focus on specific market cycles for backtesting or live trading.
Condition Table and Statistics
A table at the bottom of the chart lists all active entry/exit indicators. Upon each closed trade, an integrated statistics label displays net profit, total trades, win/loss count, average and median PnL, etc.
Seamless Alerts and Automation
• Configure alerts in TradingView using “Any alert() function call.”
• The script sends JSON alert messages you can route to your own webhook.
• The indicator can be integrated with Skyrexio alert bots to automate execution on major cryptocurrency exchanges.
Optional MA/PSAR Plots
For added visual clarity, optionally plot the chosen moving averages or PSAR on the chart to confirm signals without stacking multiple indicators.
Methodology
Multi-Indicator Entry Logic
When multiple entry indicators are enabled (e.g., RSI + Stochastic + MACD), the script requires all signals to align before generating an entry. Each indicator can be set for crossovers, crossunders, thresholds (above/below), etc. This “AND” logic aims to filter out low-confidence triggers.
Single-Entry Intrabar SL/TP
• One Position At a Time: Once an entry signal triggers, a trade opens at the bar’s close.
• Intrabar Checks: Stop-loss and take-profit levels (if enabled) are monitored on every tick. If either is reached, the position closes immediately, without waiting for the bar to end.
Exit Logic
All Conditions Must Agree: If the trade is still open (SL/TP not triggered), then all enabled exit indicators must confirm a closure before the script exits on the bar’s close.
Time Filter
Optional Trading Window: You can activate a date/time range to constrain entries and exits strictly to that interval.
Justification of Methodology
Indicator Confluence: Combining multiple tools (RSI, MACD, etc.) can reduce noise and false signals.
Intrabar SL/TP: Capturing real-time spikes or dips provides a more precise reflection of typical live trading scenarios.
Single-Entry Model: Straightforward for both manual and automated tracking (especially important in bridging to bots).
Custom Date Range: Helps refine backtesting for specific market conditions or to avoid known irregular data periods.
How to Use
Add the Script to Your Chart
• In TradingView, open Indicators , search for “Multi-indicator Signal Builder” .
• Click to add it to your chart.
Configure Inputs
• Time Filter: Set a start and end date for trades.
• Alerts Messages: Input any JSON or text payload needed by your external service or bot.
• Entry Conditions: Enable and configure any indicators (e.g., RSI, MACD) for a confluence-based entry.
• Close Conditions: Enable exit indicators, along with optional SL (negative %) and TP (positive %) levels.
Set Up Alerts
• In TradingView, select “Create Alert” → Condition = “Any alert() function call” → choose this script.
• Entry Alert: Triggers on the script’s entry signal.
• Close Alert: Triggers on the script’s close signal (or if SL/TP is hit).
• Skyrexio Alert Bots: You can route these alerts via webhook to Skyrexio alert bots to automate order execution on major crypto exchanges (or any other supported broker).
Visual Reference
• A condition table at the bottom summarizes active signals.
• Statistics Label updates automatically as trades are closed, showing PnL stats and distribution metrics.
Backtesting Guidelines
Symbol/Timeframe: Works on multiple assets and timeframes; always do thorough testing.
Realistic Costs: Adjust commissions and potential slippage to match typical exchange conditions.
Risk Management: If using the built-in stop-loss/take-profit, set percentages that reflect your personal risk tolerance.
Longer Test Horizons: Verify performance across diverse market cycles to gauge reliability.
Example of statistic calculation
Test Period: 2023-01-01 to 2025-12-31
Initial Capital: $1,000
Commission: 0.1%, Slippage ~5 ticks
Trade Count: 680 (varies by strategy conditions)
Win rate: 75.44% (varies by strategy conditions)
Net Profit: +90.14% (varies by strategy conditions)
Disclaimer
This indicator is provided strictly for informational and educational purposes.
It does not constitute financial or trading advice.
Past performance never guarantees future results.
Always test thoroughly in demo environments before using real capital.
Enjoy exploring the Multi-Indicator Signal Builder! Experiment with different indicator combinations and adjust parameters to align with your trading preferences, whether you trade manually or link your alerts to external automation services. Happy trading and stay safe!

Supply & Demand (10-MTF) | StableThe Supply & Demand (10-MTF) indicator is a sophisticated technical analysis tool designed to identify high-probability institutional "buy" and "sell" zones across ten different timeframes simultaneously.
Core Functionality
The indicator works by scanning for displacement—sharp, aggressive price movements that leave behind "unfilled orders."
Zone Identification: It identifies a "Base" (the candle before the move) and a "Leg-out" (the momentum candles). If the leg-out meets your momentum strength requirements, a zone is drawn.
Multi-Timeframe Aggregation: Instead of switching between charts, a trader can see 1H Supply, 4H Demand, and Daily Supply zones all layered on a 5-minute chart.
Real-Time Invalidation: The indicator tracks whether price has "mitigated" (broken) a zone. Once a zone is breached by a wick or a close (depending on your settings), it can be hidden or marked as historic.
Why It’s Useful for Traders
1. Confluence Mapping (The "Nest" Strategy)
The most powerful use of this tool is finding Nested Zones. When a 15-minute Demand zone resides inside a 4-hour Demand zone, the probability of a reversal is significantly higher. This indicator makes these high-confluence areas visually obvious.
2. Institutional Footprint Tracking
Institutions do not buy or sell everything at once; they leave footprints in the form of supply and demand imbalances. This tool helps retail traders avoid "buying the top" or "selling the bottom" by showing where the big money actually entered the market.
3. Dynamic Stop Loss & Take Profit
Stop Loss: Traders can place stops just outside the structural boundary of a zone.
Take Profit: Traders can use the opposing HTF (Higher Timeframe) supply zone as a natural target for a long trade.
4. Time Efficiency
Managing 10 timeframes manually is mentally exhausting. This indicator automates the "top-down analysis" process, allowing you to focus on execution rather than chart flipping.

GapFinder & TrapFinderGapFinder Pro is a comprehensive gap detection and trap zone analysis tool designed for traders who understand that unfilled gaps act as price magnets. This indicator automatically identifies, tracks, and monitors price gaps while alerting you to potential bull and bear traps.
Gaps represent areas where price moved so quickly that no transactions occurred—leaving behind "fair value gaps" that price often returns to fill. This indicator makes tracking these opportunities effortless.

Velocity Divergence Radar [JOAT]
Velocity Divergence Radar - Momentum Physics Edition
Overview
Velocity Divergence Radar is an open-source oscillator indicator that applies physics concepts to market analysis. It calculates price velocity (rate of change), acceleration (rate of velocity change), and jerk (rate of acceleration change) to provide a multi-dimensional view of momentum. The indicator also includes divergence detection and force vector analysis.
What This Indicator Does
The indicator calculates and displays:
Velocity - Rate of price change over a configurable period, smoothed with EMA
Acceleration - Rate of velocity change, showing momentum shifts
Jerk (3rd Derivative) - Rate of acceleration change, indicating momentum stability
Force Vectors - Volume-weighted acceleration representing market force
Kinetic Energy - Calculated as 0.5 * mass (volume ratio) * velocity squared
Momentum Conservation - Tracks momentum relative to historical average
Divergence Detection - Identifies when price and velocity diverge at pivots
How It Works
Velocity is calculated as smoothed rate of change:
calculateVelocity(series float price, simple int period) =>
float roc = ta.roc(price, period)
float velocity = ta.ema(roc, period / 2)
velocity
Acceleration is the change in velocity:
calculateAcceleration(series float velocity, simple int period) =>
float accel = ta.change(velocity, period)
float smoothAccel = ta.ema(accel, period / 2)
smoothAccel
Jerk is the change in acceleration:
calculateJerk(series float acceleration, simple int period) =>
float jerk = ta.change(acceleration, period)
float smoothJerk = ta.ema(jerk, period / 2)
smoothJerk
Force is calculated using F = m * a (mass approximated by volume ratio):
calculateForceVector(series float mass, series float acceleration) =>
float force = mass * acceleration
float forceDirection = math.sign(force)
float forceMagnitude = math.abs(force)
Signal Generation
Signals are generated based on velocity behavior:
Bullish Divergence: Price makes lower low while velocity makes higher low
Bearish Divergence: Price makes higher high while velocity makes lower high
Velocity Cross: Velocity crosses above/below zero line
Extreme Velocity: Velocity exceeds 1.5x the upper/lower zone threshold
Jerk Extreme: Jerk exceeds 2x standard deviation
Force Extreme: Force magnitude exceeds 2x average
Dashboard Panel (Top-Right)
Velocity - Current velocity value
Acceleration - Current acceleration value
Momentum Strength - Combined velocity and acceleration strength
Radar Score - Composite score based on velocity and acceleration
Direction - STRONG UP/SLOWING UP/STRONG DOWN/SLOWING DOWN/FLAT
Jerk - Current jerk value
Force Vector - Current force magnitude
Kinetic Energy - Current kinetic energy value
Physics Score - Overall physics-based momentum score
Signal - Current actionable status
Visual Elements
Velocity Line - Main oscillator line with color based on direction
Velocity EMA - Smoothed velocity for trend reference
Acceleration Histogram - Bar chart showing acceleration direction
Jerk Area - Filled area showing jerk magnitude
Vector Magnitude - Line showing combined vector strength
Radar Scan - Oscillating pattern for visual effect
Zone Lines - Upper and lower threshold lines
Divergence Labels - BULL DIV / BEAR DIV markers
Extreme Markers - Triangles at velocity extremes
Input Parameters
Velocity Period (default: 14) - Period for velocity calculation
Acceleration Period (default: 7) - Period for acceleration calculation
Divergence Lookback (default: 10) - Bars to scan for divergence
Radar Sensitivity (default: 1.0) - Zone threshold multiplier
Jerk Analysis (default: true) - Enable 3rd derivative calculation
Force Vectors (default: true) - Enable force analysis
Kinetic Energy (default: true) - Enable energy calculation
Momentum Conservation (default: true) - Enable momentum tracking
Suggested Use Cases
Identify momentum direction using velocity sign and magnitude
Watch for divergences as potential reversal warnings
Use acceleration to detect momentum shifts before price confirms
Monitor jerk for momentum stability assessment
Combine force and kinetic energy for conviction analysis
Timeframe Recommendations
Works on all timeframes. Higher timeframes provide smoother readings; lower timeframes show more granular momentum changes.
Limitations
Physics analogies are conceptual and not literal market physics
Divergence detection uses pivot-based lookback and may lag
Force calculation uses volume ratio as mass proxy
Kinetic energy is a derived metric, not actual energy
Open-Source and Disclaimer
This script is published as open-source under the Mozilla Public License 2.0 for educational purposes. It does not constitute financial advice. Past performance does not guarantee future results. Always use proper risk management.
- Made with passion by officialjackofalltrades
