Historical Range (Using eStrategy library)⬜ The script is intended to cover few things.
▶ Strategy testing framework based on eStrategy library
▶ Using historicalrange of values for identifying better entry and exits.
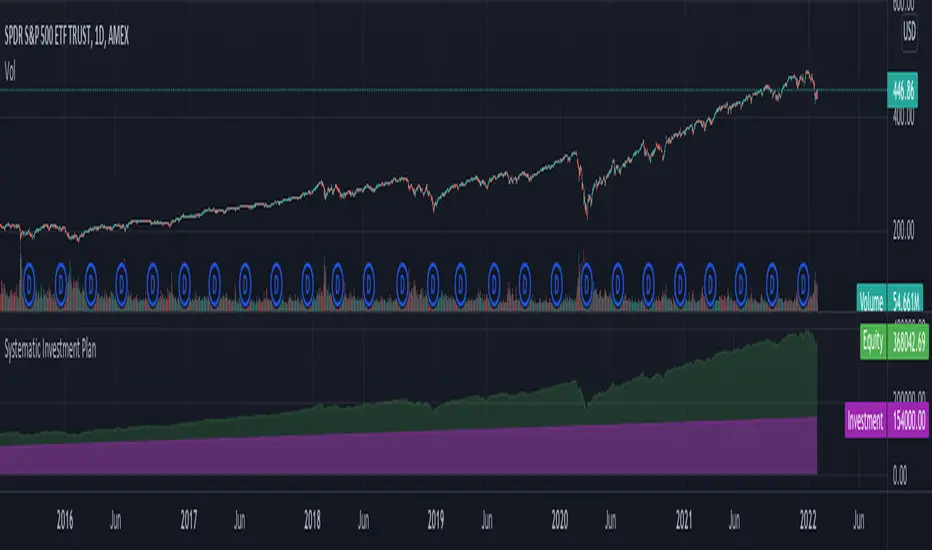
This is also built on top of the Systematic Investment Plan script published here
⬜ Strategy testing framework
Strategy testing framework is different from tradingview default strategy testing from few ways to suit the needs of systematic investments.
▶ Supports recurring investment on top of initial investment to emulate adding further funds to the investment bucket on regular basis.
▶ Better calculation of drawdowns based on daily equity rather than drawdown calculated only on close of trade.
▶ Provides better control over how much strategy can reduce and reload
Having said that, this framework is not intended as replacement for tradingview strategy framework. It is not as comprehensive as tradingview strategy framework. But, created to address few specific styles of strategy.
▶ No detailed trade stats on individual trades. But, this can be implemented in future versions
▶ At present only facilitates long positions.
▶ UI features such as plotting trades on chart are not available.
▶ Does not take into consideration of slippage and brokerage - this is not an issue because the framework is not meant for short term trades. It is only made for daily timeframes.
▶ No pyramiding or leverage possible.
And many more...
Framework can be used for similar strategies based on market timing with few small changes.
⬜ Historical Range Strategy
Concept here is, instead of taking indicators such as oscillators as is, use historical percentile to derive better oversold and overbought conditions. Strategy provides different options to base historical range. This can either be based on
▶ Band percent
▶ Oscillator
Different choices of bands and oscillators are also available to chose. However, have not done extensive testing on all the combinations.
⬜ Settings
▶ Initial and recurring investment settings (As confirm inputs)
▶ Buy and hold and strategy specific settings to be used for stat calculation
▶ Band and oscillator parameters
These are straightforward parameters which is used for defining the base of either bands or oscillators.
▶ Percentile moving average parameter
Percentile MA is used with Percentile to find entry and exit signals based on crossover and crossunder.
Feedbacks and suggestions welcome.
Chỉ báo Pine Script®