Average Range LinesThis Average Range Lines indicator identifies high and low price levels based on a chosen time period (day, week, month, etc.) and then uses a simple moving average over the length of the lookback period chosen to project support and resistance levels, otherwise referred to as average range. The calculation of these levels are slightly different than Average True Range and I have found this to be more accurate for intraday price bounces.
Lines are plotted and labeled on the chart based on the following methodology:
+3.0: 3x the average high over the chosen timeframe and lookback period.
+2.5: 2.5x the average high over the chosen timeframe and lookback period.
+2.0: 2x the average high over the chosen timeframe and lookback period.
+1.5: 1.5x the average high over the chosen timeframe and lookback period.
+1.0: The average high over the chosen timeframe and lookback period.
+0.5: One-half the average high over the chosen timeframe and lookback period.
Open: Opening price for the chosen time period.
-0.5: One-half the average low over the chosen timeframe and lookback period.
-1.0: The average low over the chosen timeframe and lookback period.
-1.5: 1.5x the average low over the chosen timeframe and lookback period.
-2.0: 2x the average low over the chosen timeframe and lookback period.
-2.5: 2.5x the average low over the chosen timeframe and lookback period.
-3.0: 3x the average low over the chosen timeframe and lookback period.
Look for price to find support or resistance at these levels for either entries or to take profit. When price crosses the +/- 2.0 or beyond, the likelihood of a reversal is very high, especially if set to weekly and monthly levels.
This indicator can be used/viewed on any timeframe. For intraday trading and viewing on a 15 minute or less timeframe, I recommend using the 4 hour, 1 day, and/or 1 week levels. For swing trading and viewing on a 30 minute or higher timeframe, I recommend using the 1 week, 1 month, or longer timeframes. I don’t believe this would be useful on a 1 hour or less timeframe, but let me know if the comments if you find otherwise.
Based on my testing, recommended lookback periods by timeframe include:
Timeframe: 4 hour; Lookback period: 60 (recommend viewing on a 5 minute or less timeframe)
Timeframe: 1 day; Lookback period: 10 (also check out 25 if your chart doesn’t show good support/resistance at 10 days lookback – I have found 25 to be useful on charts like SPX)
Timeframe: 1 week; Lookback period: 14
Timeframe: 1 month; Lookback period: 10
The line style and colors are all editable. You can apply a global coloring scheme in the event you want to add this indicator to your chart multiple times with different time frames like I do for the weekly and monthly.
I appreciate your comments/feedback on this indicator to improve. Also let me know if you find this useful, and what settings/ticker you find it works best with!
Also check out my profile for more indicators!
Simplemovingaverages

MultiMovesCombines 3 different moving averages together with the linear regression. The moving averages are the HMA, EMA, and SMA. The script makes use of two different lengths to allow the end user to utilize common crossovers in order to determine entry into a trade. The edge of each "cloud" is where each of the moving averages actually are. The bar color is the average of the shorter length combined moving averages.
-The Hull Moving Average (HMA), developed by Alan Hull, is an extremely fast and smooth moving average. In fact, the HMA almost eliminates lag altogether and manages to improve smoothing at the same time. A longer period HMA may be used to identify trend.
-The exponential moving average (EMA) is a technical chart indicator that tracks the price of an investment (like a stock or commodity) over time. The EMA is a type of weighted moving average (WMA) that gives more weighting or importance to recent price data.
-A simple moving average (SMA) is an arithmetic moving average calculated by adding recent prices and then dividing that figure by the number of time periods in the calculation average.
-The Linear Regression Indicator plots the ending value of a Linear Regression Line for a specified number of bars; showing, statistically, where the price is expected to be. Instead of plotting an average of past price action, it is plotting where a Linear Regression Line would expect the price to be, making the Linear Regression Indicator more responsive than a moving average.
The lighter colors = default 50 MA
The darker colors = default 200 MA

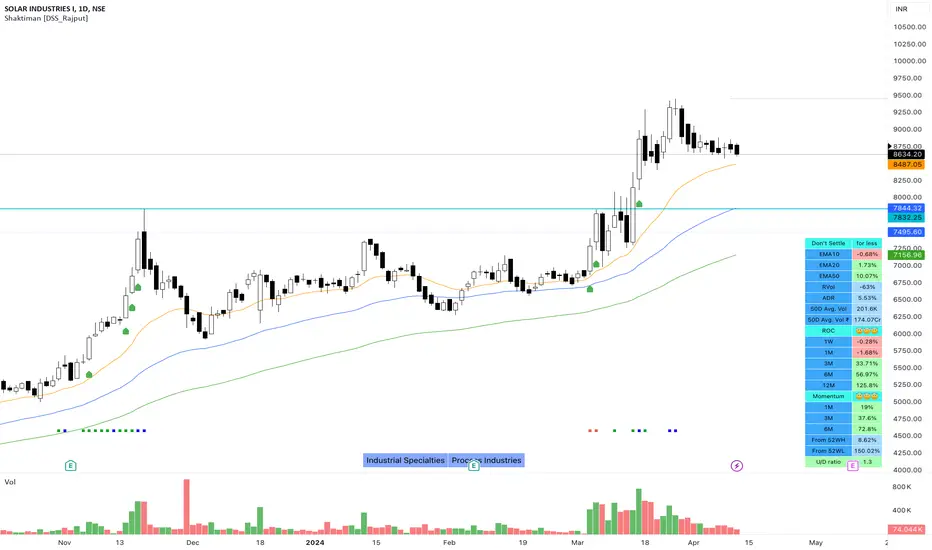
Shaktiman [DSS_Rajput]I'm a Momentum Trader, following the Indian markets, Mark Minervini and William O'Neil follower.
User Settings
Inputs tab
EMA option for Table - It compares the current price of the symbol to its key EMA's and calculates the rate of return to make it easier to track the performance of the symbol. It Helps you to identify how far the price is from its Key EMA's
ADDITIONAL TABLE DATA - It will allow you to use multiple performance data sets with your set of customizable inputs (You can change periods as per your requirements)
Show Inside Bar (IB): Allows you to add Inside Bar on your chart
Show NR4 (Narrow Range): Allows you to add an NR4 bar on your chart
Show INR7(Narrow Range): Allows you to add NR7 Bar on your chart
Distance_From_EMA_Table: Allows you to enable/disable the price difference with its key EMA's table.
ROC_Table: It compares the current price of the symbol to its past price and calculates the rate of return to make it easier to track the performance of the symbol.
Note that the Performance sidebar is not updated in real-time, while this indicator is, so on real-time charts.
The formula of the calculation is (Current value - Past value) * 100 / Past value, where Past value is: 1W, 1M, 3M, 6M, 1Y
Momentum_Table: It compares the current price of the symbol to its past lowest price of that period and calculates the %Gain of the symbol from the low of that period
Power_Play_Candidate: It will show the power play candidate, similar to IBD, It merely qualifies for Power_Play.
You need to wait for the Right Entry point. It will give you 8 Week Range.
According to IBD, it should move 100%+ in less than 8 weeks. You can modify your criteria by changing the percentage gain.
U/D Ratio: IBD defines the U/D ratio as "A 50-day ratio that is derived by dividing total volume on up days by the total volume on down days.
A ratio greater than 1.0 implies positive demand for a stock"
UpVol criteria: close>open and vice versa for DownVol
Rvol (Relative Vol): Percentage volume change (compared to daily average volume)
ADR : It allows you to add the Average Daily Range to the table.
Show 50D Avg. Vol & Avg. Vol rupee: It allows you to add 50-Day Avg. Vol and 50-Day Avg. Vol rupee.
Show_Bull_Snort: Allows you to add bull snort to your chart and style the bar.
Bull Snort is the work of Oliver Kell. For more info about Oliver kell, check youtube videos of Oliver Kell.
Normal Moving Average: Plot 4 Simple, Exponential, and Weighted Moving Averages. (You can choose an option between EMA/SMA/WMA)
Fixed Moving Average : Plot 4 Simple, Exponential, and Weighted Moving Averages. (You can choose an option between EMA/SMA/WMA)
Plus Point: It will not change its value when you switch to a different timeframe. Let's say you applied Fixed Daily 20MA, on the intraday chart.
It will not change its value and It will give you much more clarity that, from where the price is bouncing from 20MA. Explore it (You will definitely love it!)
Fixed Moving Average : Plot 2 Simple, Exponential, and Weighted Moving Averages. (You can choose an option between EMA/SMA/WMA)
Plus Point: It will not change its value when you switch to a different timeframe. (It's like Plotting 10 Week Line on Daily Chart & Intraday Charts)
Numbers of weeks to show High & Low: It will add data to the tables and also add 52 weeks of High & Low lines on the charts.
(Number of weeks is customizable, you can change as per your requirements.)
Style tab
You can modify the style and color of any of the inputs except table color.
Conclusion
If you like this script, click on Add to favorite indicators, so that you can easily add this indicator from your favorites tab right away.
Hope you find this useful. Please leave any questions you have in the comment section and I'll be happy to answer them.
Thanks!
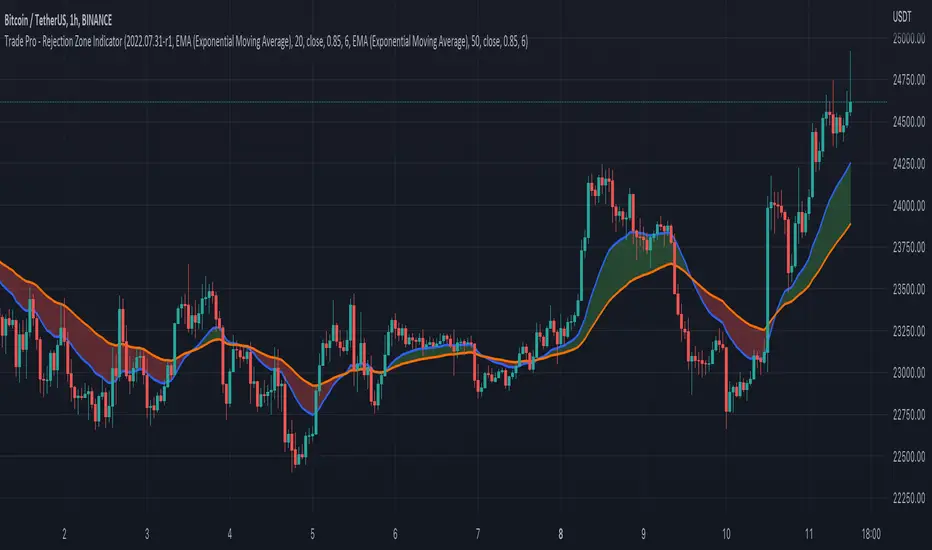
Trade Pro - Rejection Zone IndicatorThe Rejection Zone Indicator can be used to help trend following traders know when to buy dips in up trends, and when to sell pull backs in down trends.
The Rejection Zone Indicator is made up of the 20 and 50 period Exponential Moving Averages. This indicator has colored shading in between these two EMAs, which acts as a nice visual. When the 20 period Exponential Moving Average is below the 50 period Exponential Moving Average, the shaded cloud will be red, and when the 20 EMA is over the 50 EMA the cloud will be green. It is called the Rejection Zone indicator, because often in trends when price pulls back to the colored cloud, it will act as an area of support or resistance.
The suggested use of the Rejection Zone Indicator is to look for long trades when the cloud is green, and once price has pulled back into the green cloud. If the cloud is red one can look for short trading opportunity when price pulls back into the red cloud.
EMA ON MA SETSOORY FOR MY EINGLISH
ITS NOT MY NATIVE AND IM NOT GOING TO GOOGLE TRANSLATE THIS
this is a beuaitful indicator that plot EMA that gat is calc from another ma and length for your choise so you will get an = 'ema on ma '
it can plot you more beautiful results and more smoothing results
i added golden/death cross for all ma
enjoy !
היי חברים זה בעצם אינדיקטור של ממוצע נע על ממוצע נע לנוחיכותכם
הפלט הראשי הוא EMA
הוא לוקח את החישוב שלו ממוצע אחר והאורך שתגדירו
נותן תוצאה יותר חלקה של ממוצעים נעים
הוספתי חתיוכים בין ההמוצעים
תהנו.

Chirag Strategy SMA with StopLossThe Moving Average Crossover trading strategy is possibly the most popular trading strategy in the world of trading. This strategy is a good example of so-called traditional strategies. Traditional strategies are always long or short. That means they are never out of the market. The concept of having a strategy that is always long or short may be scary, particularly in today’s market where you don’t know what is going to happen as far as risk on any one market. But a lot of traders believe that the concept is still valid, especially for those of traders who do their own research or their own discretionary trading.
This version uses crossover of simple moving averages of length 10 and 13. This strategy is best suitable for NIFTY and BANKNIFTY under 15min candlestick for intraday and 1hour candlestick for long-term.

Bogdan Ciocoiu - CoordinatorDescription
The Coordinator is an indicator developed on the back of the RSI algorithm, modified substantially to form a cloud. In addition, the Coordinator uses EMA/SMA to compare the location of the RSI cloud with the chosen moving averages (EMA vs SMA).
This indicator is helpful as it confirms when a trader should enter a position or exit based on the proximity of the RSI cloud to the relevant MA.
Uniqueness
The Coordinator provides unique benefits, including:
It shows the strength of the RSI in the shape of the RSI cloud, using two sets of dimensions (one more long term and one more short-term oriented).
It indicates the positioning of the RSI cloud in conjunction with the relevant moving averages to help traders remain in positions for longer.
It shows the RSI 14 (useful when spotting divergences aligned with the price action).
Open-source
The Coordinator uses the following open-source scripts:
www.tradingview.com

Multiple Moving AveragesThis script plots up to five Moving Averages , either Simple or Exponential (9, 20, 50, 100 and 200 days period by default).

