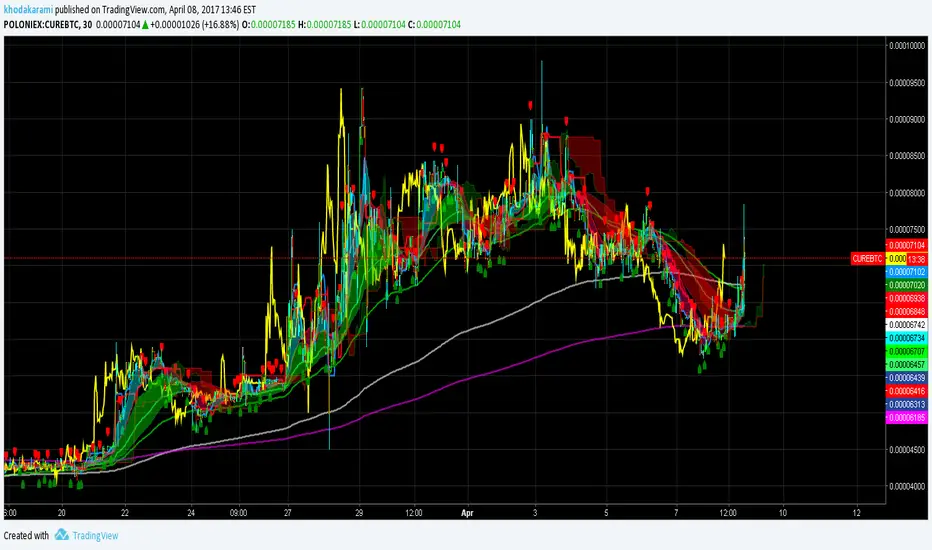
X-LinesИндикатор X-lines давно известен для пользователей торговой платформы Metatrader 4 & 5. Он показывает интересные рынку цены (уровни поддержки и сопротивления). Индикатор работает без опоздания и как только бар будет закрыт по интересующей рынок цене, тут же над ним появится символ "X" и начнется прорисовка уровня до следующего важного значения . Уровни (цены) которые указывает индикатор являются истинно важными для рыночного процесса (по ним отрабатывается или отрабатывался в прошлом крупный объем сделок). Соответственно подобные цены в будущем могут быть целью торгового процесса и могут выступать, как поддержкой так и сопротивлением.
Настройка индикатора предельно проста, имеется возможность менять значение только одного параметра: Levels Power (сила уровней), по умолчанию значение равно 9-ти. Чем выше значение тем более слабые уровни показывает индикатор (соответственно уровней становится больше). В случае низких цифр индикатор показывает сильные и более важные цены (соответственно уровней становится меньше). Работу индикатора обеспечивает авторский алгоритм. Индикатор не строит уровни по вершинам цен или по краевым барам он автоматически и своевременно определяет отработку объема по цене закрытия бара тем самым обеспечивая практически 100% точность уровня.
Важно отметить, что в силу особенностей облачного языка PINE индикатор кое что потерял, а кое что приобрел. Для более удобной разметки уровней, просто расставите горизонтальные ценовые уровни соответственно показаниям индикатора.
English
The X-lines indicator has been long time known by users of the Metatrader 4 & 5 trading platform. It shows interesting market prices (support and resistance levels). The indicator works without delay and as soon as the bar is closed at the interesting price, immediately after that the symbol "X" will appear above bar and the level will be drawn to the next important value . The levels (prices) that the indicator showing are truly important for the market process (according to them, a large volume of transactions is processed or was working out in the past). Accordingly, such prices in the future can be the goal of the trading process and can act as support and resistance.
The adjustment of the indicator is extremely simple, it is possible to change the value of only one parameter: Levels Power, which default value is 9. The higher the value, the weaker the levels, the indicator (correspondingly, the levels becomes larger). In the case of low figures, the indicator shows stronger and more important prices (correspondingly, the levels are getting smaller). The work of the indicator is provided by the author's algorithm. The indicator does not build levels at the tops of prices or on edge bars, it automatically and in a timely manner determines the amount of work to be done at the closing price of the bar, thereby providing a nearly 100% level accuracy.
It is important to note that, due to the peculiarities of the cloud-based PINE language, the indicator has lost something, and has acquired something. For a more convenient level markup, simply place the horizontal price levels according to the indicator readings.
Support

VWAP Anomaly V1I made some late reading yesterday and discovered the importance of the VWAP indicator, above all the idea that when the current price exits it it will always bounce back. Therefore I decided to build an indicator which detects when the current price escapes the VWAP margin. The indicator shows this three things:
1) When the current price exits the VWAP margin.
2) The strength of a VWAP trend
3) VWAP bounce point (Blue dots which can be used as support or resistance)
By using the VWAP Anomaly V1 indicator, you can know if you find yourself in a reversal zone, and get a great entry point. Please, do have in mind no indicator is perfect, by using other indicator with the VWAP Anomaly Indicator your chances of success increase by a significant level. NOTE: Follow my predictions under your own risk

MavilimWThis Indicator plots smoothed weighted moving average combinations of various Fibonacci numbers
a great support and resistance for long term trading and confirmation

Support & Resistance LevelsBasic Visualisation of key support and resistance levels.
This script works best on periods of 15minutes or greater.
The strength of the support/resistance are shown through line thickness, and support levels are shown as green and resistance levels red.

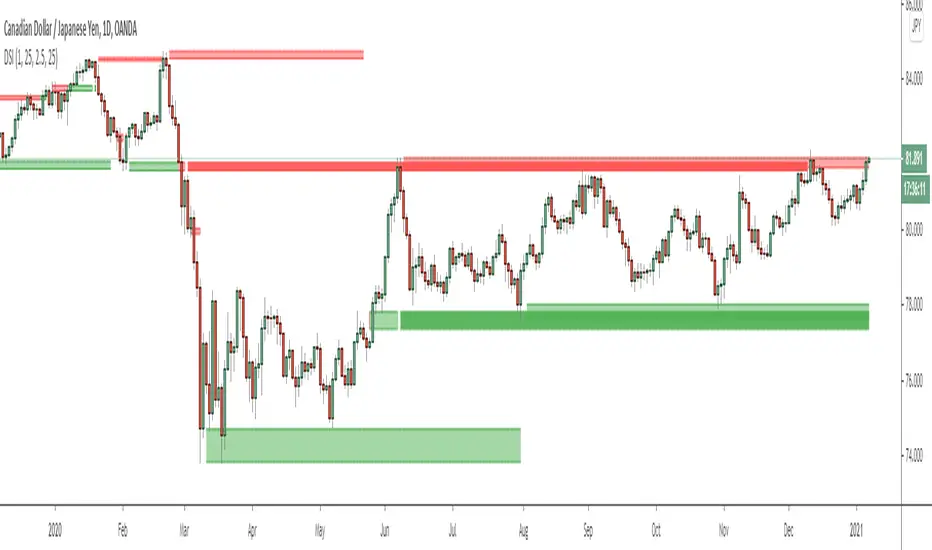
Dynamic Structure IndicatorThis is a dynamic structure indicator designed to map potential support and resistance zones (in all markets). It does this by looking back x amount of candles to identify major swing highs and lows on the specified reference timeframe, and then it draws a zone between the highest/lowest wick and the highest/lowest candle close across the chart until a new zone is created.
The settings are important because it gathers data from a separate reference timeframe, so sometimes it will map zones that aren’t really appropriate for lower timeframes. On lower timeframes (1Hr and under) I’d recommend setting the reference timeframe to your actual trading timeframe and increasing the lookback period to fine-tune the zone mapping. The script is set for 4 Hour forex charts by default.
Please note: the max zone option is disabled by default because it is different for every instrument, but this is a useful feature that I recommend using. Sometimes the indicator picks up huge gaps that aren’t really considered support or resistance zones. If this happens to you, use the zone size settings to invalidate huge (or tiny) zones. The zone size is in pips.
To be honest I didn’t get this indicator to be quite as accurate as I envisioned and it’s still a work in progress as I learn pine script, but this is the best I’ve been able to get it to function and with the right settings it works fairly well so I figured I might as well release this first version. Maybe someone with better skills than me can help refine it to more accurately identify major fractals and levels - if so, please get in touch! All traders should be able to identify their own major levels by eye anyway, but this script is intended to be a building block for future signal indicators I wish to develop.
Last of all - please don’t use this indicator to trade blindly! Often price will blast right through these zones and the zones aren’t always accurate. Remember that structure levels only work if they’re obvious to other traders, and always wait for confirmation signals that meet your trade plan rules before entering trades – especially reversals or counter-trend trades.
If you have any questions or tips to improve the script, feel free to leave a comment or private message me.
Enjoy, and good luck out there :)
- Matt.
Pivots High/Low 3bar No Period w/ Signals -Tom1traderwww.tradingview.com
This price action indicator calculated on the relationship of 3 adjacent bars/candles adds an extra dimension to my indicator mix and with
a different perspective can help confirm or question an opinion formed by other indications (volume related, momentum, the chart itself and etc.).
Further, I have traded with it a bit now and like it. So much for comfort - I have seen no clear evidence that the movement of the next bar is paying any
attention to indicators, lines or patterns on charts. They are all based on the same historical data whether that data is run through an indicator algorithm
or used to draw (chart style) on a chart. But they make me feel better about my trades and I prefer them to a coin flip. :-)
Pivot High Definition - (Pivot Low is reversed): A three-bar pivot high represents resistance and is formed when sellers turn price from up to down. It is seen where a price bar with a lower high closes below the previous bar's low, where the previous bar's high is higher than the bar that preceded it.
Read more: Price Pivots Circle Big Profits www.investopedia.com
Follow us: Investopedia on Facebook
I see some n period high/low indicators named pivots. This indicator has no period and is based on the relationship of 3 bars usually referred to as Pivots High Low.
Also no relationship to daily calculated "Pivot Points". As such this is a PRICE ACTION indicator. It works the same on ALL TIME FRAMES.
These pivots sometimes do not occur very often and usually are not at tops or bottoms.
This is why I used a combination of most recent PHs and PLs along with
the price to derive the signal.


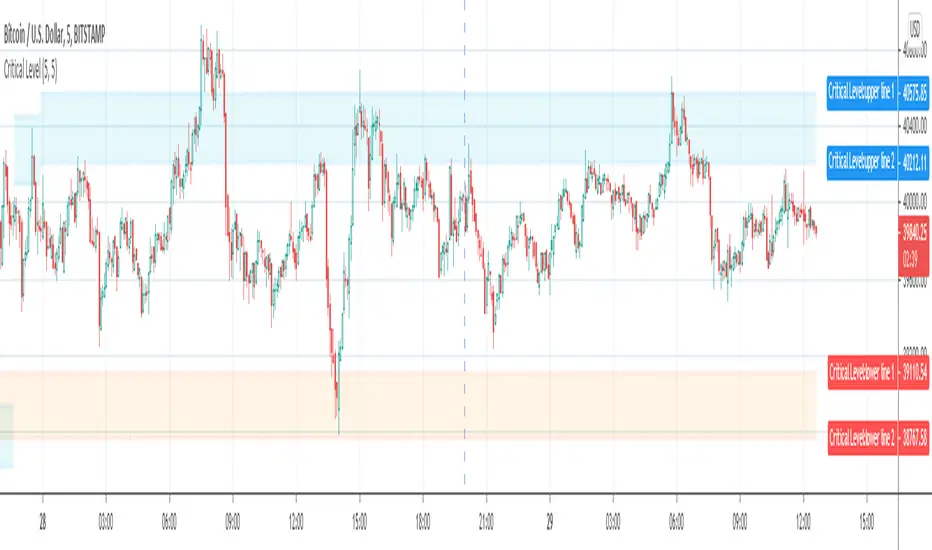
Critical Support & Resistance Level (supply & demand zone)Support & Resistance Level and Supply & Demand Zone are very common and popular jargon in technical analysis.
What is the difference between Support & Resistance Level and Supply & Demand Zone?
In my opinion, Support & Resistance Level is the value of price that tested couple times and hard to break. The zone is formed by two adjacent levels where price may oscillate between those two levels.
Imagine the levels as horizontal lines, and the zones are areas between two horizontal lines.
Why are they important?
In a nutshell, they indicate where the price direction may reverse so you can act accordingly.
There are a couple methods to draw the Support & Resistance Level and Supply & Demand Zone, In most case, people will use swing high or low, or pivot points as the level. But there are too many of them, and not all pivot points will become Support & Resistance Level.
Some of the support or resistance level is hard to break, but after the price break through that level, resistance will become support and vice versa, I define it as Critical Level .
If you draw a critical support or resistance level from the current bar and move backward to where it started, you will notice that some levels are formed by the pivot points from hundreds of bars ago. It's impossible to discover the Critical Levels if you don't have enough bars loaded on chart.
The purpose of this indicator is to plot critical support and resistance level automatically on chart.
It will work on all market, Stock, Forex and Futures. It also works on all timeframes.
Inputs:
The Strength inputs control the intensity of Support & Resistance Level.
The Alert input is the switch of alert function.
By enable Enhanced mode, the indicator will be more critical.
Check Showline input to plot level lines on chart, otherwise, it will plot zones only.
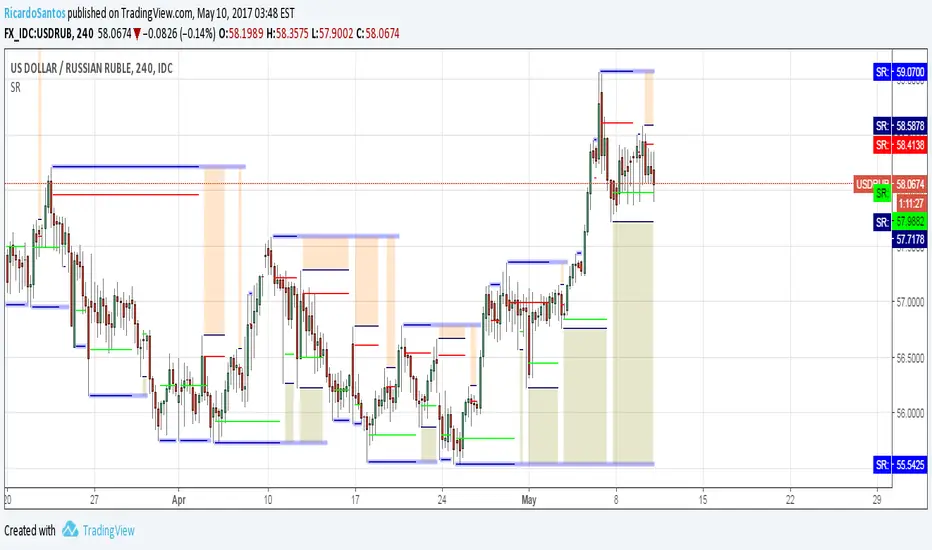
[PW]D/W/M/Y pivots with S/R levelsI could not find a pivots script that was entirely to my liking on TV so I re-worked this from the ' Shifted Pivots V1' script by RicardoSantos.
You can choose which timeframe pivots you would like to display from day, week, month, and year.
You can also choose how many levels of S/R you would like to show.

Hirashima Sugita R/SR/S is a indicator invented by Hirashima Sugita . The purpose of R/S is to provide automatic Support and Resisstance lines.
A short period length adapt the indicator for short terms Supports and Resisstance and long period length to long terms support and resistance. Hirashima Sugita dont recommend to use this indicator for trade channel breakout. I tried to remake this indicator but it can be incomplete, some functions of the original indicator are too complex for me.
I think the indicator work well with all markets and time frames but feel free to modify the indicator if you want.
Hope you find it useful.Good trades :)

Guerrilla AdvancedThis indicator was designed with people without Pro License in mind (Including many of my close friends).
Basically, you will get a combo of few different tools in one box, with ability to turn them on and off with a single check mark, also, you have total control over the input numbers that was used in calculations if you so want to, for example, sometimes when i see a massive bullish up trend, i reduce the short rally from 12 to 8 even 6 to get faster signal for selling the trend.
So, what will you get in this pack?
1- Ichimoko. Yes, you heard it right, although we have it in the default tools but hey, it will use one indicator slot and if you don't have a pro license, you will use that slot
2- Rally. This is an old yet very powerful system for getting buy or sell signals, basically, you get two lines and for making the life easier i draw a cloud between them. when the trend passes above the cloud and it was bellow it in past, right after the very first candle that gets above the cloud you can put the buy order, and vice versa, the moment a candle body enters the cloud, if you want an aggressive signal, you can sell, if not, you may want to wait to see if the candles drop bellow the cloud or not then decide.
3- Resistance Support Cloud. Most of us always heard about resistance and support "lines" but many of us don't know that, in each trend, the trend line itself is a resistance or support line, and when you are going in a bullish or bearish tunnel, the floor and roof of tunnels are again resistance and supports, using this part of the tool, just like rally, you get a cloud that shows you the resistance / support "zone"
4- William Fractals. To be honest, I got this part of the code from another source available around. Why? looking at those fractal indicators, you can easily eyeball the trend line or existence of a tunnel.
5- Different EMA lines. If you are one of those people that use EMA lines for their trading, have fun with them, there are few different standard ones and even a custom one that you can put your desired number for it.
Auto Trendline, Upper Descending Trend line detector with alertThis is a custom Tradingview indicator that automatically plots descending trend lines above price bars. It will alert when the price closes above the trend line.
The concept is straightforward: the trend line is formed by two adjacent peaks when the price is in a downtrend. It will save a lot of time for people (just like me) who uses trendline often.
By deploying this indicator, should the condition meet, you don't need to draw the trend lines by hand anymore. You can also consider it as a trend line reminder.
It's also very easy to use, just load it on chart and set your desired inputs.
Features:
Adjust the strength of the 2 peaks that form the trend line.
Set price difference between two peaks in two variables: amount or percentage.
Turn on/off the cross above alert.
It works on all symbols and all timeframes.
never paint
A detailed instruction will show you how to properly adjust each input.

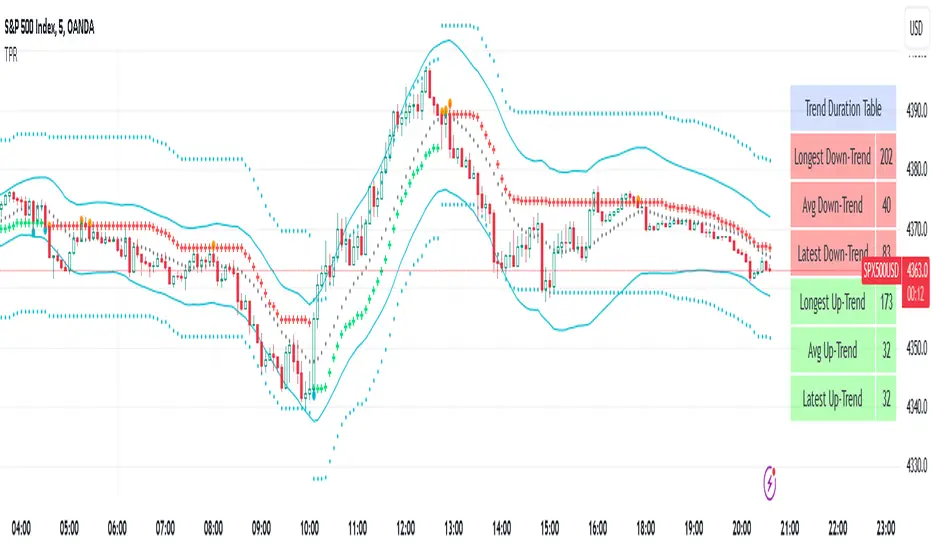
Trend Pullback Reversal TPRThe TPR(Trend Pullback Reversal) indicator forms a possible price trend with support and resistance lines. It also comes with a unqiue band and center line as additional features.
TPR works on all timeframes and all symbols and all type of bar chart.
TPR never repaints.
There are 4 Parameters:
Period: umber of bars used for calculations
Factor: Multiplier factor, small number for short trend, large number for long trend
Source: the input series, default is Close
ShowBand: enable to show band and center line
Most trend indicators have similar plot, the difference is where and when they change the direction. Unlike other trend indicators, TPR will focus on main trend and filter out most minor price movements. The green cross-line represents an uptrend, the red cross-line represents a downtrend.
The additional band and center line may look like bollinger band, but the TPR band algorithm is completely different from bollingerband. There is no standard deviation in TPR band calculation.

RvZ - Reversal Zones Indicator..!Hello Traders...!
Yet another indicator from myself following to my previous indicator "FIRST-5-MINUTES-ZONE-AND-HI-LO-BRKOUTS",
this is TO IDENTIFY INTRADAY REVERSAL ZONES...!!!
- It works on any time frame
- along with those zones i have added two more lines Red and Green which will be used as Intraday Resistance and Support lines .
- Pls donot expect Profit and Stop points, that is upto you.
- If market goes beyond those zones well then consider that market is trading stronger. So..trade with strict stops accordingly. If the market goes beyond those zones then LOOK LEFT for the previous zones and trade.
- 80% of time, the market respects those zones.
- The zones colours are CUSTOMIZABLE
- A simple strategy to use this in confluence with,
RSI (7) Range , EMA (100)
**** If stock trading above 100 EMA, Rsi in overbought, price in upper reversal zones, then voila...get some sack ready to fill the money...!!! same goes for opposite side *****
well then Traders, Enjoy and let's put some money in Bank....!!!!!
--cheers,
Sanjay Ramanathan

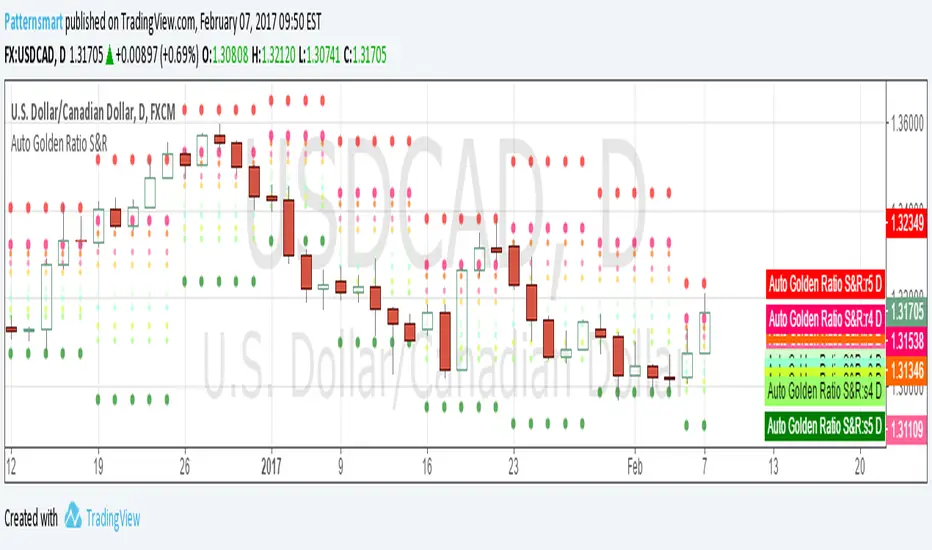
Automatic Golden Ratio Support & ResistanceThe golden ratio is also called the golden mean or golden section.
It has been used to analyze the proportions of natural objects as well as man-made systems such as financial markets.
The mathematics of the golden ratio and of the Fibonacci sequence is intimately interconnected. The Fibonacci sequence is: 1, 1, 2, 3, 5, 8, 13, 21, 34, 55, 89, 144, 233, 377, 610, 987, ....
This Golden Ratio indicator automatically plots 5 support levels and 5 resistance levels based on the golden ratio for current timeframe. It shows a possible price range for current session, you can easily identify the major and minor support/resistance levels from the chart.
The levels of support and resistance are formed at the beginning of a new session
This indicator works on all default time frames.
It will never repaint.
There is no parameter. All you need to do is to load it to your chart.
Click the image links to view it in original size.
3.bp.blogspot.com
2.bp.blogspot.com
2.bp.blogspot.com
3.bp.blogspot.com
2.bp.blogspot.com
2.bp.blogspot.com
1.bp.blogspot.com
////////////////////////////////////////////////////////////
// Technical Analysis & Research Patternsmart
//
// Custom indicators, Strategies, SCAN, Screener, Backtesting, Converting service for:
// Tradingview, NinjaTrader, Thinkorswim, MetaTrader, MetaStock, Multicharts, Prorealtime, etc.
////////////////////////////////////////////////////////////
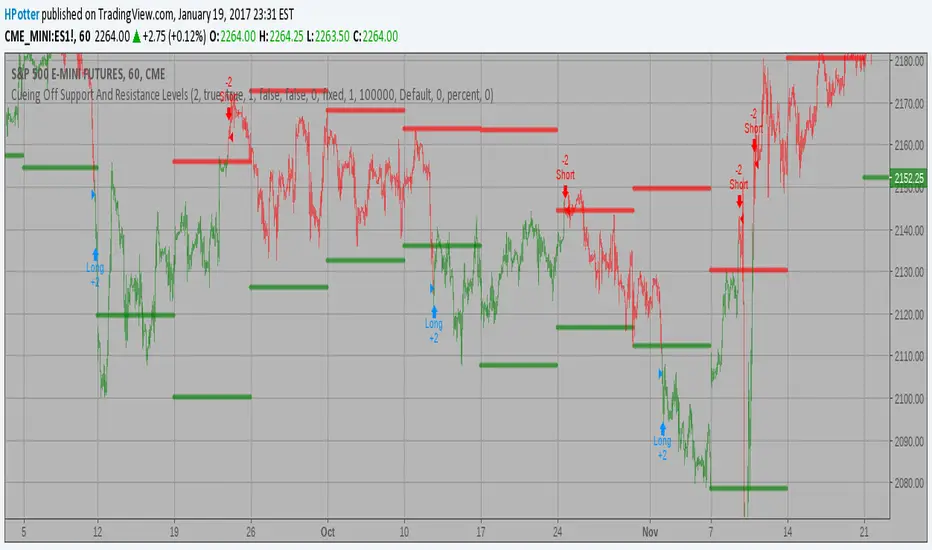
Cueing Off Support And Resistance Levels, by Thom Hartle v 2.0Cueing Off Support And Resistance Levels, by Thom Hartle
The related article is copyrighted material from Stocks & Commodities.
You can change Time Frame in the settings: Monthly, Weekly, Daily

Cueing Off Support And Resistance Levels Backtest Cueing Off Support And Resistance Levels, by Thom Hartle
modified by HPotter for trade signals.
The related article is copyrighted material from Stocks & Commodities.
You can change long to short in the Input Settings
Please, use it only for learning or paper trading. Do not for real trading.
Cueing Off Support And Resistance Levels Cueing Off Support And Resistance Levels, by Thom Hartle
modified by HPotter for trade signals.
The related article is copyrighted material from Stocks & Commodities.

Dynamic Support/Resistance Zones Mono ResolutionThis script is identical to:
but it hasn't the multi-resolution functionality, which sometimes happens to be very glitchy

Dynamic Support/Resistance Zones Multi-ResSimple support and resistance areas. The threshold parameter determines the sensibility. It works better if volume data is good.
Remember to refresh the script once in awhile when applied to lower resolutions.
//std1243cf0

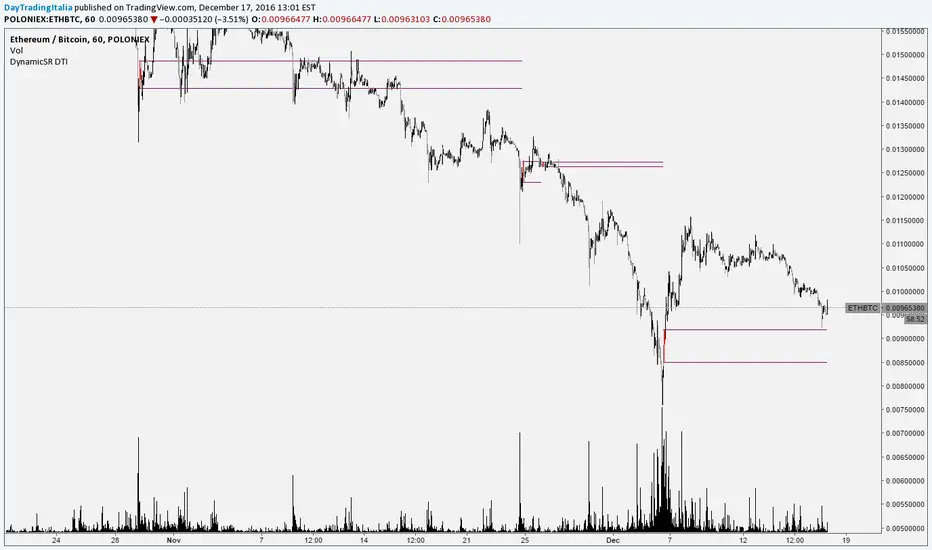
DynamicSR DTI: Auto Support and Resistance AreaThis works only on charts with real volume...if it does work