Crypto EMA Bands - Support and ResistanceEMA Bands for crypto markets shows support and resistance lines. Helps identify bull and bear market trends. SMA200 is white and turns yellow to signal pressure. Can also be useful for identifying Elliot waves and breakouts.
Support

Alchemist Capital Lazy ZonesAlchemist Capital Lazy Zones is a script written to complement the trading style taught by @clover_trading - Chris teaches a zone to zone strategy and this script aids in the technical analysis relating to this.
This indicator has been tested and coded with Forex pairs in mind, as such its functionality and usefulness on other assets cannot be guaranteed.
The best way to use this script is to load it fresh on your chart/given pair, make the adjustment to the initial user/price level for that given pair. The indicator will then draw your lazy zones from this initial price point, showing the levels that have been ticked within the input tab. Use the key levels and zones printed as a template to manually markup your chart. It is important that before switching to another pair you hide the indicator from view, load the new chart and adjust the initial user/price level for this chart before unhiding the indicator and redrawing the key levels and zones. The reason for this is that not doing so can sometimes cause zoom issues as the new chart loads with Auto-zoom enabled as standard and will carry over the user/price level from the previous chart.

Average Band by HarmanUsually, Moving Averages (Simple & Exponential) consider "close" of each candle to form a line for a particular period. In this indicator, we have considered all the parameters (Open, Close, Low & High) of each candle to form a Band or a wave which act as a zone to provide support & resistance. It works well on all the time frames. It perfectly works on lower time frames of 15 min & 5 min for intraday trades and even for scalping. There is a line that moves very near to candles known as "Candle Line" provide support & resistance to each individual candle and a leading line which moves ahead also acts as support & resistance and helps in determining trend direction.
How to use the indicator ?
Indicator consists of 3 components :
1) A Band or wave of 3 lines (upper, middle & lower line)
2) A "Candle Line" which moves along with the candles
3) A Leading line which moves ahead of the candles
Method 1 : When candles are being formed above the candle line (line near to candles) and it crosses the band or wave from below to upside, then long trade can be initiated. Similarly, When candles are being formed below the Candle line and it crosses the band or wave from upside then short trade can be initiated. Stop loss can be maintained below the band for Long trade and above the band for short trade. Candle line can be used to trail the stop loss.
Method 2: If candles moves above and below of the band very often and frequently and candle line is in the middle of candles then it is NO TRADING ZONE. If you still want to trade, then select a higher time frame and check the price movement. If there is a stability in the higher time frame, then take the trade in the higher timeframe with stable movement.
Method 3 : Candle line acts as "First line of Defence". In a uptrend, all the candles are formed above the candle line and in case of down trend, all the candles are formed below the candle line. When a newly formed candle cross the candle line then you can book profit. For Example : In uptrend , candles are being formed above the line, when a new candle started forming below the line and when the complete candle is formed below the line, profit can be booked. Vice-versa in case of downtrend.
Method 4: Direction of leading line, band and candle line helps in determining the trend. If all these three components are in upward direction, price trend is upward and if all these three components are in downward direction, then price trend is downward. When, leading line and band cross each other from opposite direction for consecutive 2-3 times, then price movement is sideways.
Method 5 : Thickness of band play an important role in determining price action. If band is narrow, it means small candles are being formed and no any huge price movement is observed in this period. When band started expanding, it signifies that big candles are begin to form and there is a more price movement than before. Similarly, If contraction of band started, it means that small candles are being formed and there is low price movement as compared to the price movement when Band was expanded. If Band is expanded (wider) and volumes are high, It means the Band will act as strong Support or Resistance than usual. In case, candles and candle line cross the expanded Band, you can enter the Long or Short trade.
Method 6: When the Band, leading line and candle line collides or meet at a single point, then it is either strong support or resistance.
Method 7 : Usage in Scalping : Select the shorter time frame of 1 min or 5 min. If the candles are crossing the band very frequently in 1 min, then select 5 min time frame or wait for few minutes for stability. Now, when candles started forming above the candle line and it crosses the band from below then take a long position and book profit after few candles above the band. Place stop loss below the Band. Similarly, when candles started forming below the candle line and it crosses the band from above, then enter into short trade and book profit after few candles. Place stop loss above the band in the case of short trade.
You can combine above methods to give a sharp edge to your trade and increase the probability of your winning in the trade.
Indicator Settings : Default period selected is 50 for both the Band and leading line. You can change the period to 26 or 100 or 200. Select the period and check the chart, if the indicator looks fine and smooth, then you can use your settings. For most of the time, default settings work perfectly.
Proudly Developed by :
Harmandeep Singh
Graduate in Computer Science with Physics & Mathematics
MBA in Business Marketing and Finance
Experienced Computer programmer & Software developer
Stock Market & Crypto Trader

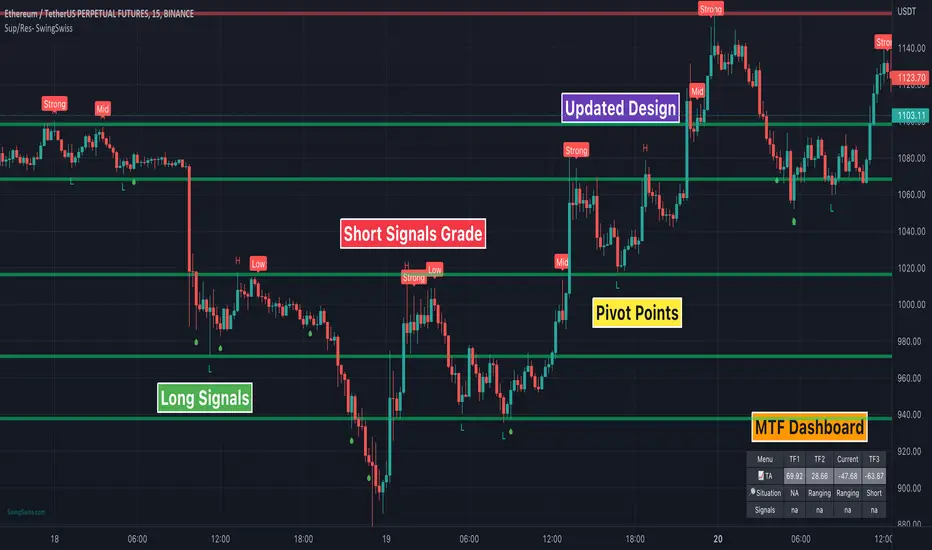
Sup/Res - SwingSwiss SuiteSup/Res can display up to ten different lines of supports and resistance.
It’s super reliable and ultra-customizable. You won’t have to draw them yourself anymore. It’s more accurate and time-saving.
Also, the indicator calculates in real-time the distance in % from the market price to the lines.
The indicator is perfect if you need to define your price limits on a swing trading strategy or for scalping a 5mn chart as a day trader.
Disclaimer:
Trading and investing in the financial markets involves substantial risk of loss and is not suitable for every investor.
All trading strategies are used at your own risk.
Trend Analyzer is part of the SwingSwiss Suite, contact me for more info
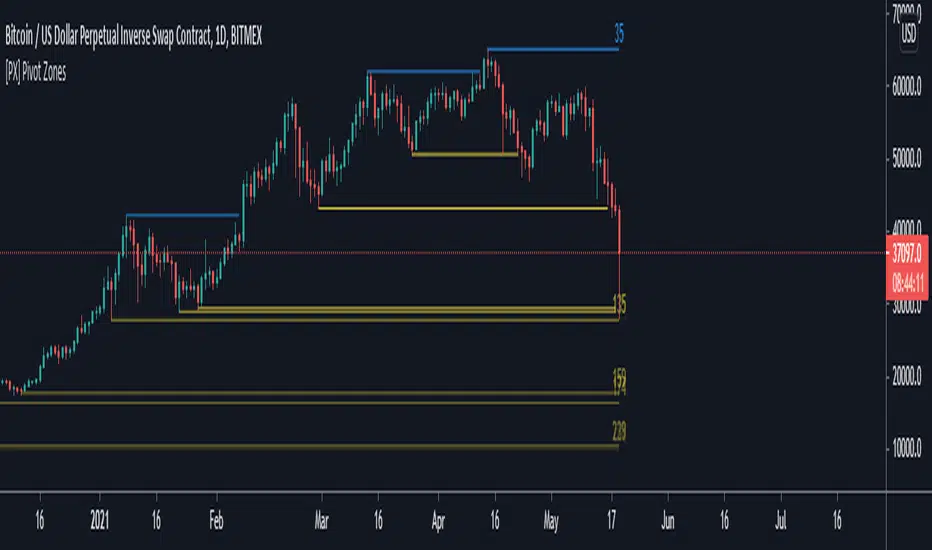
[PX] Pivot ZonesHello everyone,
I was having some fun with the new gradient function, arrays and pivots. Decided that i would publish my little playground :)
This script basically draws lines or zones for detected pivot high and lows and counts the number of candles those levels have been untested.
Tested levels will stop at the candle, which breaks them.
How does it work?
- Define the number of candles that make up the pivot point with the "Pivot Left" and "Pivot Right" parameter (I took more extreme values to showcase the indicator).
- Select your "Layout Type": This can be either a line at the pivot point, a zone between the pivot point and its body or the average of the two.
- You can in-/decrease the number of lines with the "Number of Lines/Zones" parameter.
The older a line becomes the more it will lose of its original transparency.
Hope that might be useful to some of you :)
Please click the "Like"-button and follow me for future open-source script publications.
If you are looking for help with your custom PineScript development, don't hesitate to contact me directly here on Tradingview or through the link in my signature :)
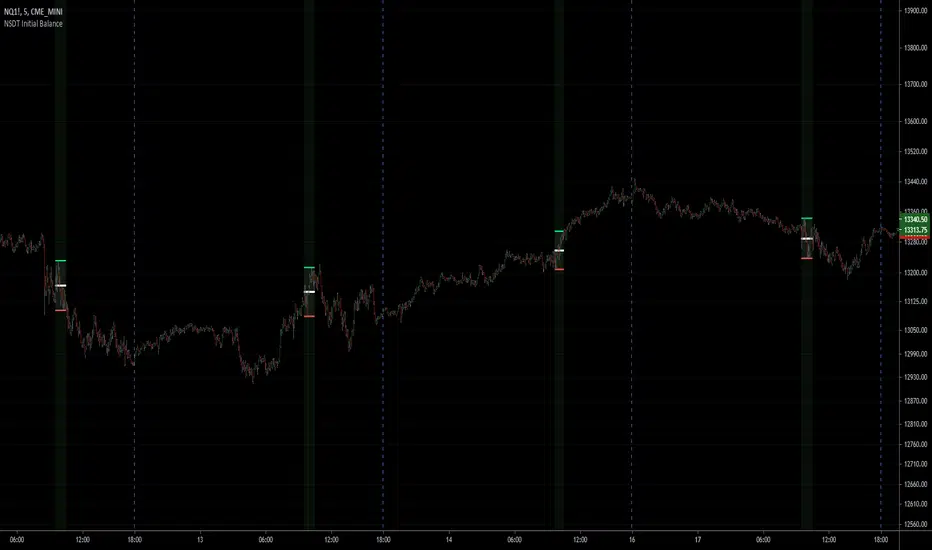
NSDT Initial BalanceInitial Balance indicator plots the high and low of the first hour of US Futures Market session. Very useful for trading breakouts after market open. Also added range midline and background shading to identify first hour. Times are adjustable. All objects can be modified.
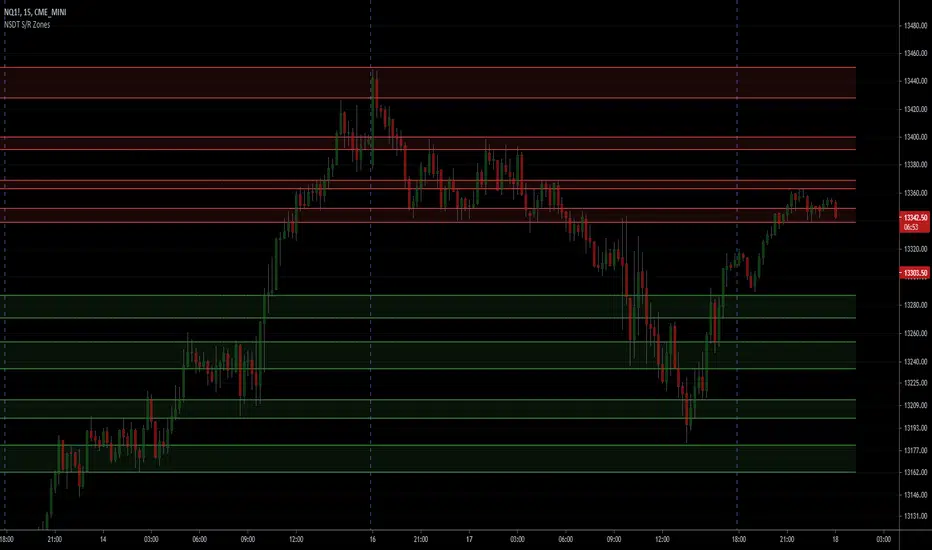
NSDT Support/Resistance ZonesA simple script that allows you to plot 8 different zones of support and resistance. Enter the high and low of a support/resistance zone, and the script will fill the range for easier viewing. Open source and all settings can be customized.
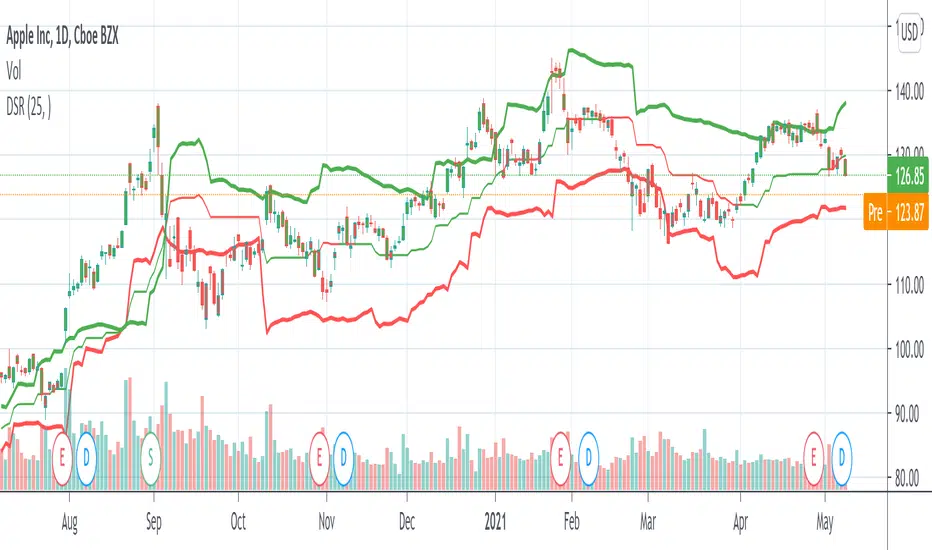
Dynamic Support And Resistance [CC]The Dynamic Support And Resistance Indicator was created by Mike Siroky (Stocks and Commodities pgs 14-18) and this is a handy indicator that will show you useful support and resistance levels no matter how the stock is doing right now. I have color coded the middle line to show buy and sell signals so buy when the line turns green and sell when it turns red.
Let me know if there are any other indicators you want me to publish!
Spyder SRThis script will help you to plot support and resistance for the day at the first min of the opening of the market.
The accuracy of these levels are more than 96% which means you will know the top and bottom well in advance.

Projected Support And Resistance [CC]Projected Support And Resistance is a custom indicator of mine loosely based on the work done by Ketan Asher (Stocks and Commodities Bonus Issue 2021 pgs 12-14) and generally speaking this does a pretty good job of telling you what the future behavior of the stock will be. As the lines widen apart, there will be either upward or downward momentum. Buy when the line turns green and sell when it turns red.
Let me know what other indicators you would like to see me publish!

ORTI Swing High Low / Support Resistance (Static TFM)The "ORTI Swing High Low / Support Resistance (Static Timeframe Multi-Period)" is based into existing studies that shows support and resistance levels taking as reference the highest and lowest points of certain periods, as a redesigned and recalculated set of the common plotted lenght.
The cherry on the top for this version is, when you want to get a predetermined count in (ranges) units of time, as: minutes, hours or days, in any a intraday graph you could get a static lenght, and this count will be automatically respected. For example, an average could be configured to know a high or low levels per hour, day, week or month ... or whatever comes to mind, and at every single chart that you move through (5m, 15m, 1h, 4h, etc), you will see the same lenght to make your own "support and resistance analysis" into a micro / macro market view.
Remember that part of analyzing chart patterns, the support and resistance levels are undoubtedly two of the most highly discussed attributes of technical analysis. Part of analyzing chart patterns, these terms are used by traders to refer to price levels on charts that tend to act as barriers, preventing the price of an asset from getting pushed in a certain direction.
With the new features, you will get a little help to identify in your technical analysis some signals to identify price points on a chart where the probabilities favor a pause or reversal of a prevailing trend. Support and resistance areas can be identified on your charts using this indicator.
For more technical information look at Investopedia.
Note: The previous calculation example is not the default, the parameters can be adjusted according to the criteria of the merchant.

NVME Support & ResistanceNVME Support & Resistance is unique compared to other S/R indicators out there because it provides users with automated analysis that can be done within a second and ours generate a highlight block rather than a solid line or dotted line and a highlight block is useful as it covers a bigger range compared to having dots and flat lines. Also, the zones will update corresponding to its lookback period, so if a new support or resistance is found then the block will move until that area is confirmed.
Best with higher timeframes!
This comes with all NVME scripts!

Order Blocks V2 [MensaTrader]Lines are Strong Support and resistance , Used to help find buy/sell or take profit zones.
When the lines turn green, these prices are suggest good limit entry prices for longs and shorts.
Default settings are left for scalping on short timeframes
Please note that this is experimental and far from perfect. feel free to play about with the variables in the settings.
feel free to comment any suggestions I hope to update this in the near future
The script is written in version 4

(IK) Base Break BuyThis strategy first calculates areas of support (bases), and then enters trades if that support is broken. The idea is to profit off of retracement. Dollar-cost-averaging safety orders are key here. This strategy takes into account a .1% commission, and tests are done with an initial capital of 100.00 USD. This only goes long.
The strategy is highly customizable. I've set the default values to suit ETH/USD 15m. If you're trading this on another ticker or timeframe, make sure to play around with the settings. There is an explanation of each input in the script comments. I found this to be profitable across most 'common sense' values for settings, but tweaking led to some pretty promising results. I leaned more towards high risk/high trade volume.
Always remember though: historical performance is no guarantee of future behavior . Keep settings within your personal risk tolerance, even if it promises better profit. Anyone can write a 100% profitable script if they assume price always eventually goes up.
Check the script comments for more details, but, briefly, you can customize:
-How many bases to keep track of at once
-How those bases are calculated
-What defines a 'base break'
-Order amounts
-Safety order count
-Stop loss
Here's the basic algorithm:
-Identify support.
--Have previous candles found bottoms in the same area of the current candle bottom?
--Is this support unique enough from other areas of support?
-Determine if support is broken.
--Has the price crossed under support quickly and with certainty?
-Enter trade with a percentage of initial capital.
-Execute safety orders if price continues to drop.
-Exit trade at profit target or stop loss.
Take profit is dynamic and calculated on order entry. The bigger the 'break', the higher your take profit percentage. This target percentage is based on average position size, so as safety orders are filled, and average position size comes down, the target profit becomes easier to reach.
Stop loss can be calculated one of two ways, either a static level based on initial entry, or a dynamic level based on average position size. If you use the latter (default), be aware, your real losses will be greater than your stated stop loss percentage . For example:
-stop loss = 15%, capital = 100.00, safety order threshold = 10%
-you buy $50 worth of shares at $1 - price average is $1
-you safety $25 worth of shares at $0.9 - price average is $0.966
-you safety $25 worth of shares at $0.8. - price average is $0.925
-you get stopped out at 0.925 * (1-.15) = $0.78625, and you're left with $78.62.
This is a realized loss of ~21.4% with a stop loss set to 15%. The larger your safety order threshold, the larger your real loss in comparison to your stop loss percentage, and vice versa.
Indicator plots show the calculated bases in white. The closest base below price is yellow. If that base is broken, it turns purple. Once a trade is entered, profit target is shown in silver and stop loss in red.

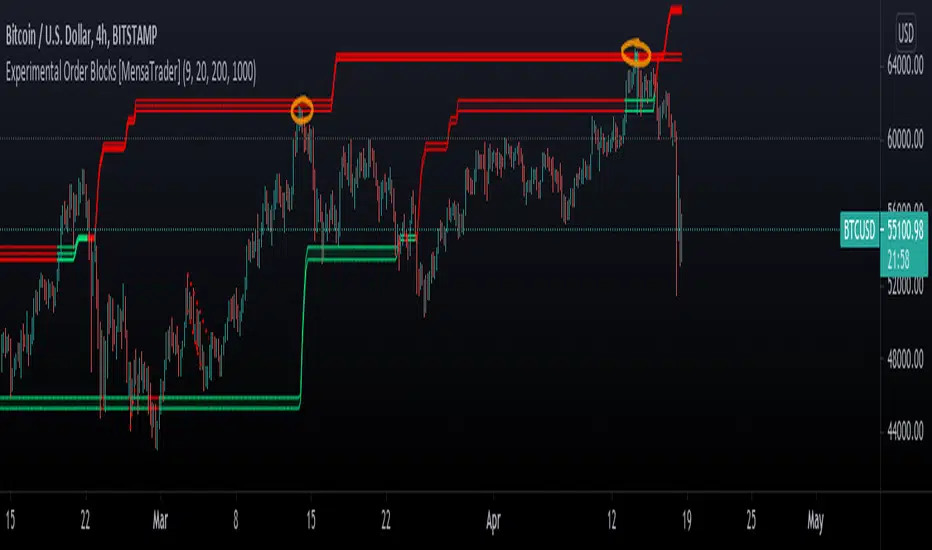
Experimental Order Blocks [MensaTrader]Boxes highlight Strong Support and resistance, Used to help find buy/sell or take profit zones.
Please note that this is experimental and far from perfect. feel free to play about with the variables in the settings, I've Found changing the look back length to 500 or 2000 can give very differnt results.
feel free to comment any suggestions I hope to update this in the near future
The script is written in version 4
Pivot Points by stelmaxFor pivot levels, we use different definitions of the pivot point. In fact, there are three different methods to calculate the reference level using this method.
For these pivot points, we set the variable x, the value of which depends on whether the open is higher or lower than the close.
If the close is less than the open, x = H + 2L + C.
If the close is higher than the open, x = 2H + L + C.
When open equals close, x = H + L + 2C
This final value will be one of the most commonly used designs. This is because, as FX is a 24 hour market, the open is almost always equal to the close.
If you look at the daily chart throughout the week, the close and the open are really just names. This is in contrast to the stock market, where the open and close are very different things, separated by time and price.
Once we have the pivot point and the x-value, we use it to compute the pivot point of the base P.
P = x / 4
Support and resistance levels are also calculated from x (pivot points do not use more than one support and resistance level).
S₁ = x / 2 - H
S₂ = x / 2 - L
Thus, we have seen how to calculate different types of Pivot Points indicator. But how can we now use them in our trade?
First, we can use our anchor point to define the general direction. - If the existing market price is above the key PP level, it suggests a bullish trend.
- If the market is below the key PP level, it suggests a bearish trend.
Pivot levels are set according to the value of the previous trading day.
+ If the price is below the PP pivot level - priority is given to sell deals, if higher - to purchases
+ Confirmatory signals can be candlestick patterns and the Stochastic indicator
+ The SL level can be set either for a signal candle or for the nearest level
+ Target - movement to the nearest support / resistance level
Keep in mind that the Pivot Level Indicator is not a complete trading system!
Remember that there are no indicators in trading that do not make mistakes, Pivot Points, like any others, require confirmation of their signals. When building your own trading system, use several indicators.
Observe Money Management. Never risk more than 2 percent of your capital in one trade. This approach will protect you from ruin and will allow you to consistently make money on Forex using the Pivot Point.
Be clear about your trading strategy. If, according to the pivot point strategy, you need to open a deal - open, if you fix the result - fix it, and it doesn't matter if you are in the black or not. Only following the rules of Pivot Points "from and to" will allow you to earn.

Compressed Volume Levels [DepthHouse]Compressed Volume Levels closely analyzes peak volume along with price action to detect critical levels.
The compression levels generated are often an early indication of possible tops, bottoms, or even a future support or resistance levels.
Warning: Since this is a volume based indicator results will vary based on the asset and volume of the exchange.
The factor & lookback at which it detects these levels can be set by the user. The lower the factor the more levels that will generate.
Built in Alerts (must be set up by user):
Verified Support and Resistance once a level is confirmed.
Upward and Downwards Compression alerts; earliest signal possible for major volume coming in.
To gain access to this indicator please follow the link below.
Feel free to message me with any questions directly here on TradingView.

Support Resistance ChannelsHello All,
For Long time I was planning to make Support/Resistance Channels script, finally I had time and here it is.
How this script works?
- it finds and keeps Pivot Points
- when it found a new Pivot Point it clears older S/R channels then;
- for each pivot point it searches all pivot points in its own channel with dynamic width
- while creating the S/R channel it calculates its strength
- then sorts all S/R channels by strength
- it shows the strongest S/R channels, before doing this it checks old location in the list and adjust them for better visibility
- if any S/R channel was broken on last move then it gives alert and put shape below/above the candle
- The colors of the S/R channels are adjusted automatically
You can set/change following settings:
- Pivot Period
- Source : High/Low or Close/Open can be used
- Maximum Channel Width %: this is the maximum channel width rate, this is calculated using Highest/Lowest levels in last 300 bars
- Number of S/R to show : this is the number of Strongest S/R to show
- Loopback Period: While calculating S/R levels it checks Pivot Points in LoopBack Period
- Show S/R on last # Bars: To see S/R levels only on last N bars
- Start Date: the script starts calculating Pivot Point from this date, the reason I put this option is for visuality. Explained below
- You can set colors/transparency
- and You can enable/disable shapes for broken S/R levels
Examples:
You can change colors as you wish:
here " Show S/R on last # Bars " set 100:
Sometimes visuality may corrupt because of old S/R levels, to solve it you need to set "Start Date" in the options to start the script in visual part (last 292 bars)
here in first screenshot it doesn't look good (shrink), then on second screenshot I set the "Start Date" it looks better, if you change time frame don't forget to set it again :)
Enjoy!

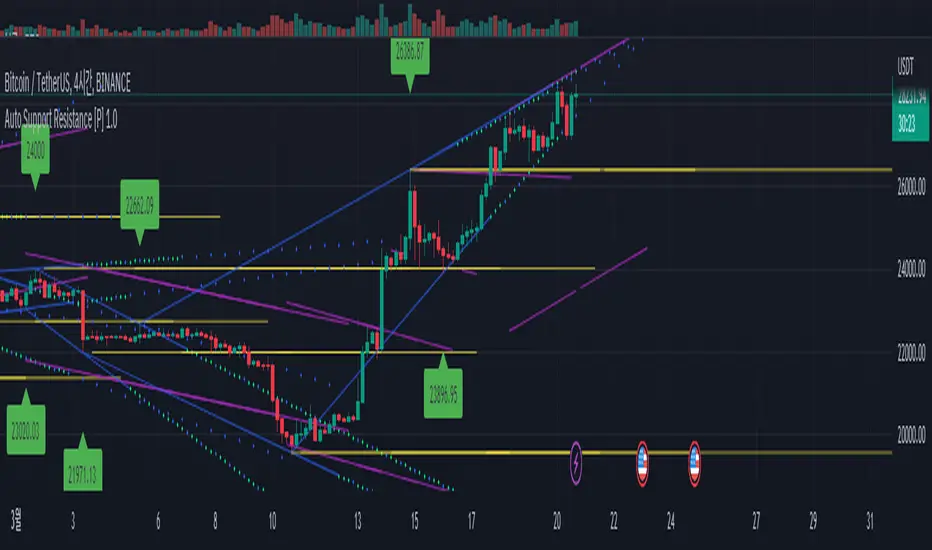
Auto Support Resistance [WS]This is paid version.
If you wanna use free version
This show support line, and resistance line.
moderately! and beautiful way!
also proper trend line .
you cannot see source code, but it doesnt have any secret formula.
It use just pivot function.
( i just wanna keep my design tech. )
it has 3 type line.
1. horizontal. yellow. default pivot size is 15
2. connection of top(peak, blue). pivot size 10
3. connection of bottom(green). pivot size 10
you can change pivot size.
it has one speical option about volume .
if the bottom has too small volume , it cannot be starting point.
if you want every bottom can be starting point, you can turn off the option.
each point has name like H6, G8.
this name help you to talk with someone about the point, sharing the infomation.
that name is base on the time of candle (it mean it is not randome). so in your friend chart(screen), the point has same name.
=========================================
한글 설명.
이 지표는 유료버전입니다.
무료버전은 위의 그림을 누르시면 됩니다.
아름답게 절제된, 그리고 적절한 추세선들을 자동으로 보여줍니다!!!
소스코드를 볼 수 없지만, 추세선을 결정하는 비밀 수식 같은 것은 없습니다.
오직 pivot피봇 함수만을 사용하여 고점과 저점을 찾고 있습니다.
선은 3가지가 있습니다.
1. 고점을 연결한 선. 파란색. 기본 피봇 10
2. 저점을 연결한 선. 녹색. 피봇 10
3. 고점 또는 저점의 수평선. 노란색. 피봇 15
특별한 기능이 하나 있는데, 볼륨이 낮은 저점은 녹색선의 시작점이 되지 못하게 하는 기능입니다.
이 기능은 옵션에서 끄거나, 정도를 조절할 수 있습니다.
각 고점 저점은 H4, G8 같은 이름을 가지고 있습니다.
이 이름은 여러분이 차트분석을 올리거나 친구와 차트에 대해 대화를 나눌 때 유용하게 쓰일 수 있습니다.
이 이름은 캔들의 시간값을 이용하며 (무작위로 지어진게 아니라는 의미), 그래서 친구의(모두의) 화면에서 같은 이름을 보여줍니다.
점선은 확장선이며, 기본은 30, 최대 55까지 늘릴 수 있습니다.
(너무 늘리면 화면이 복잡해집니다.)
가장 최근의 고점과 저점 수평선은 무한대의 길이를 가집니다.
그 외의 수평선은 적당한 길이로 조절되어 출력됩니다.
간혹 3개의 선으로 나뉘어 보이거나 투명도가 변하곤 하는데 이는 특별한 의미를 보이려는 것이 아닙니다. 트레이딩뷰 파인스크립트의 한계로 인한 현상입니다.
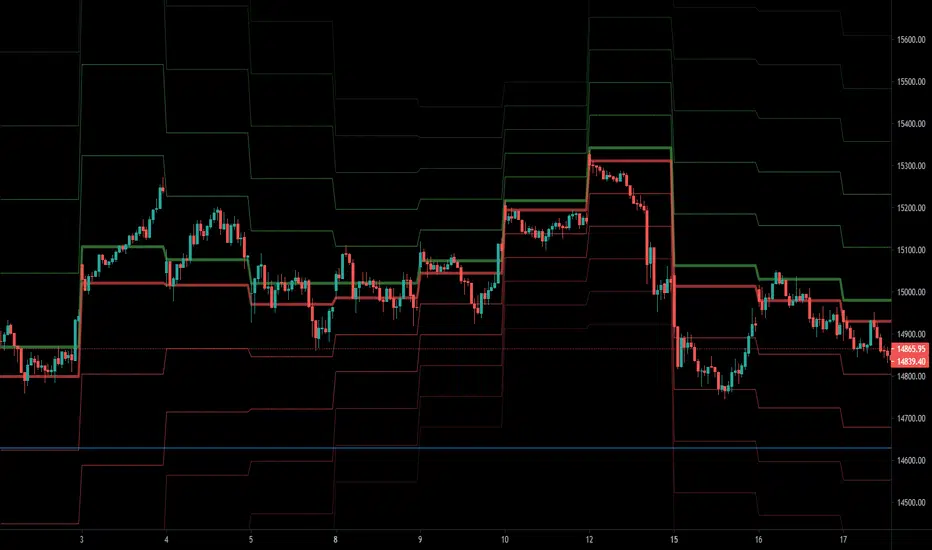
Intraday Zones & Levels - Support & ResistanceI use this indicator to mark levels and mathematically categorize my 15mins chart into smaller trading zones. You can view these as Support and Resistance levels as well, however, the main function is to visually divide the chart on the basis of previous days' price movements.
- Levels are calculated based on the Average % Change per Day for the last 5 Days. Calculations use Daily open Value for the last 5 days & % Change using current open Value.
- Entry Levels ( Bullish and Bearish ) mathematically divide the charts into 2 zones and can be used to determine the nature of the stock movement during that day.
- Weekly and Yearly Open Prices are also plotted on the chart as reference levels.
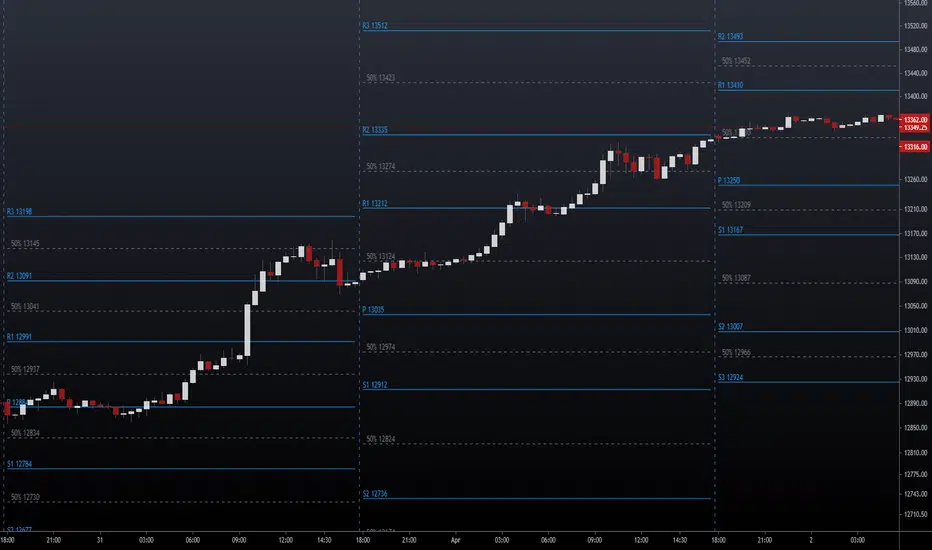
NSDT Pivot Points PlusThis script uses the Traditional Pivot Points but includes the price levels and the 50% line between levels. We added the ability to change the line color of the major levels and the minor levels independently, for better clarity. Added alerts - used code from QuantNomad.
Pivot Points description from TradingView default indicator:
Pivot Point analysis is a technique of determining key levels that price may react to. Pivot points tend to function as support or resistance and can be turning points. This technique is commonly used by day traders, though the concepts are valid on various timeframes. There are several methods of identifying the exact points. Common types of pivot points are Traditional, Fibonacci, Woodie, Classic, Camarilla and DM and each type has its own calculation method.
Most use a variation of significant prices such as established highs, lows, opening and closing prices and then apply a calculation to determine these points. They all calculate additional support and resistance levels alongside the pivot points. They can be used to determine when to enter or exit trades or to determine the range of a market. Conservative traders look for additional confirmation before entering a trade. Whether pivot points are used alone or in combination with other techniques, they are a useful tool in a technical trader's toolbox.
[RickAtw] O1 Opening Market LineThis indicator helps to identify current support and resistance based on the opening of the Asian, London and New York sessions.
Function
You can make good trade entries based on these lines. Shows daily and weekly openings of each session
It will also help you to look at which session you are currently trading)
Purple ----> Asian session
Red ----> London session
Blue ----> New York session
Key Signal
buy ---> A strong buy signal is a bounce from the low and the presence of a weekly or day open line.
sell ---> A strong sell signal is a bounce from the maximum and the presence of a weekly or day open line.
P.S. Be sure to test on your pair!
Remarks
This will help you determine the approximate area of support and resistance.
Since we cannot look into the future, it does not inform you about the exact records, but a possible change in trends.
Readme
In real life, I am a professional investor. And I check each of my indicators on my portfolio and how effective it is. I will not post a non-working method. The main thing is to wait for the beginning of trends and make money!
I would be grateful if you subscribe ❤️

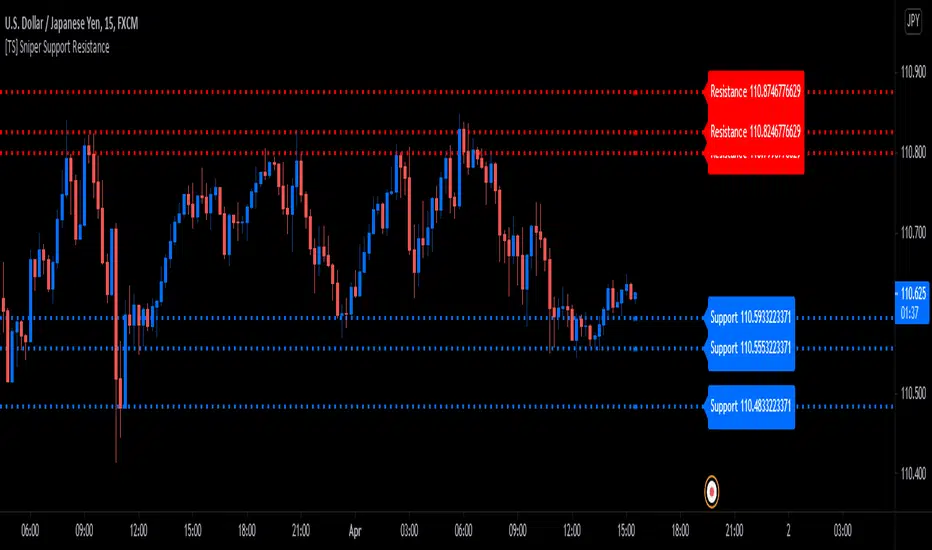
[TS] Sniper Support ResistanceThis script is our Pivot Points and ATR based Support and Resistance indicator
-A Support is a price level where a downtrend can be expected to pause due to a concentration of demand or buying interest. As the price of assets or securities drops, demand for the shares increases, thus forming the support line. Meanwhile, A resistance zone arises due to selling interest when prices have increased.
- By increasing the "S/R Multiplier" input, the user can change the distance from the S/R swing points
- By increasing the "S/R Length" input, the user can adjust the S/R Swing Points lookback length (pivot detection range)