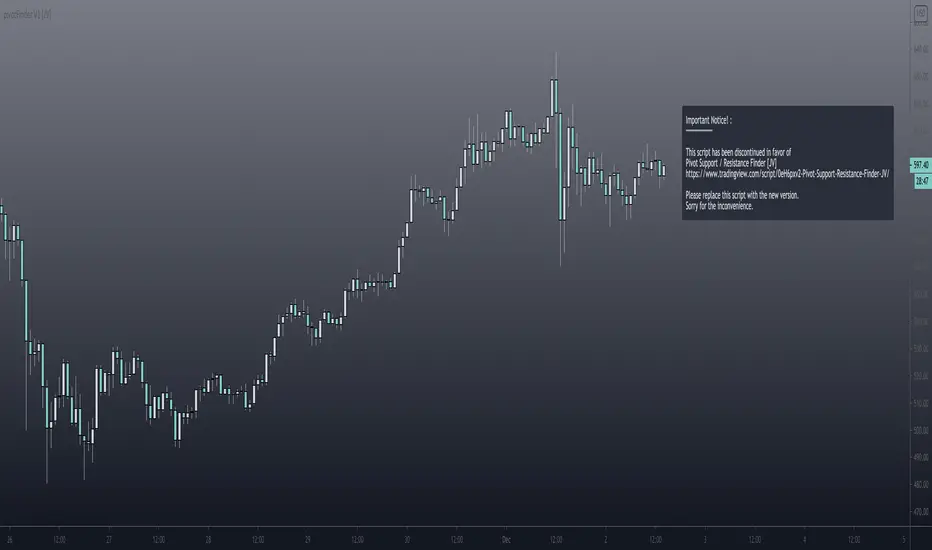
Pivot Support and Resistance Finder [JV] V2Dear Traders,
This script is a follow-up to my previous Pivot Support and Resistance Finder.
After so many positive feedback, for which I thank you all, I started rebuilding it to implement some requested features.
The biggest change is that by default, the indicator now shows zones instead of lines.
Support Zone: from low to close
Resistance Zone: from close to high
I removed the 5 lines, instead showing the most recent levels and the forming (fast) levels.
However, if you change the occurrence in the options, you can still see previous levels:
0 = Current Level
1 = Previous Level
2 = Level before the Previous Level
...
More important configurable options:
Pivot Length
Pivot Quick Length (used to draw forming levels
Option to draw using bar closes, wicks or both (area)
Hide / Display to forming level
Show past levels.
I hope this is clear enough.
For any questions, remarks, suggestions, feel free to contact me.
Happy Trading!
Support

RSI Support and Resistance Finder [JV] V1Hi Traders.
In my never ending obsession with Support and Resistance , I built an indicator to show the last Support and Resistance Lines based on RSI .
The indicator draws a new Support Line when RSI comes out of oversold and a new Resistance Line when RSI comes out of overbought.
It also shows a panel with the current Support and Resistance Levels.
It's a pretty decent indicator to detect Entry / Exit / Take Profit levels.
This indicator is not to be used as a stand-alone indicator. Add your favourite indicator to get confirmations.
RSI length and overbought / oversold levels can be adjusted in Settings.
Any suggestions or remarks are more than welcome!

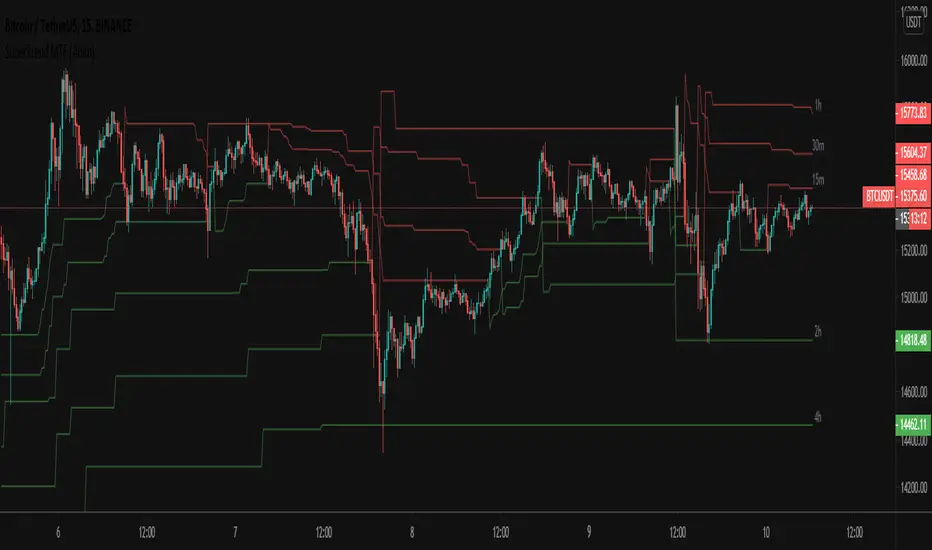
SuperTrend MTF [Anan]Hello friends,
As per many experts, supertrend indicator is best to use in combination with other indicators like MACD and RSI.
The best thing about supertrend it sends out accurate signals on precise time. The indicator offers quickest technical analysis to enable the intraday traders to make faster decisions. It is extremely simple to use and understand.
However, the indicator is not appropriate for all the situations. It works when the market is trending. Hence it is best to use for short-term technical analysis. Supertrend uses only the two parameters of ATR and multiplier which are not sufficient under certain conditions to predict the accurate direction of the market.
Understanding and identifying Bull and Bear signals in supertrend is the main crux for the intraday traders. Both the downtrends as well uptrends are represented by the indicator. The flipping of the indicator over the closing price indicates signal. A Bull signal is indicated in green color whereas Bear signal is given as the indicator turns red.
Options:
- Change calculation source ( default SuperTrend uses: hl2)
- Change calculation method (default SuperTrend uses: RMA)
- Additional six multi-time frames SuperTrends
Pivots High Low (HH/HL/LH/LL)/Trend [Anan] Hello Friends,,
This is pivot points high low with pivot trend to define the trend direction.
Pivot trend is the pivot points average.
Options:
- Pivot Point Period
- Show/hide Pivot Points Labels
- Show/hide Bull/Bear Labels ( depends on pivot trend)
- Show/hide Pivot Center Line (Bull>Center, Bear

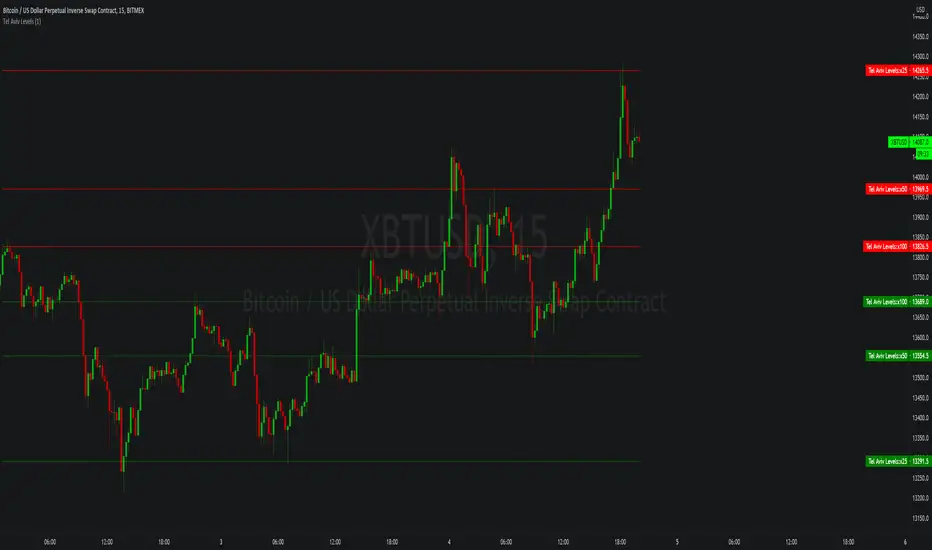
Tel Aviv LevelsSimple script that calculates static support/resistance levels for potential price reversals using a calculation for predicting liquidity from a base price, use in confluence with other technical analysis tools.
DM me on tradingview for access.
Pivot Support and Resistance Finder [JV] V1Hi Traders.
This is my first attempt of writing an indicator.
Let me start by saying I could never have done this without lmatl and WMX_Q_System_Trading who were and are an incredible source of inspiration.
This indicator shows horizontal Pivot Support and Resistance . It draws up to 4 horizontal lines extending to the right from and adds labels to High and Low Pivot Candles . It also draws the Support / Resistance that is currently forming.
You can select the number of lines on the current timeframe.
There are some options in Settings:
Current timeframe pivot settings
Show and hide levels of the current timeframe
Change colors
Extend Lines
Any suggestions are more than welcome!
I also welcome donations, no matter how small ;-)
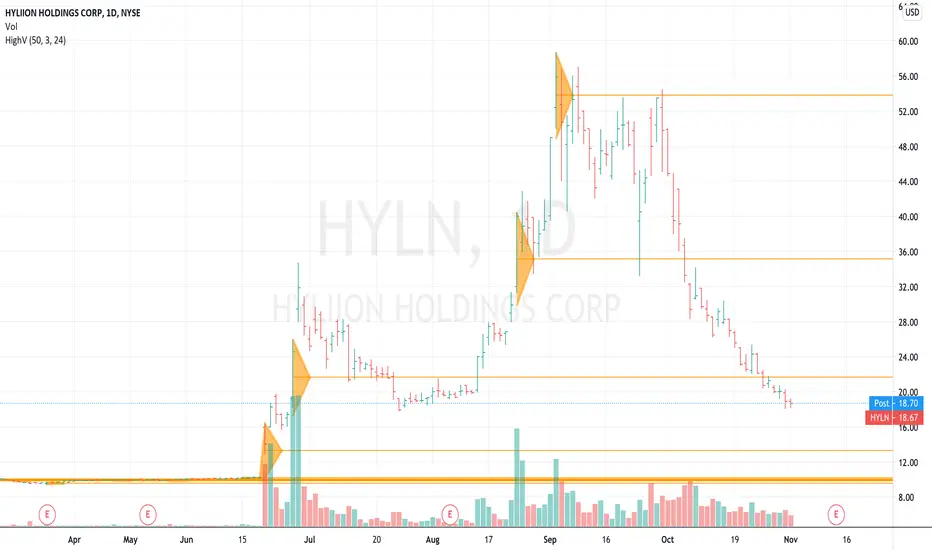
High Volume Key Hidden LevelThere are important price levels in the market that occur when high volumes of trading occur. The indicator is set to look for periods where there is 3x's the 50-period average volume and then it graphs a horizontal line going forward in time for reference as support or resistance.
Generally speaking, if the market rallies into a line then look for the market to stall at the line as it is a level of supply. Likewise, if the market falls down to a high volume level, then it would be logical to assume there is support at that level especially on the first and second revisit.
The indicator is adjustable so you can filter out to whatever multiple of any average. Some markets rarely have 3-times volume events, so you may have to adjust for each symbol.
High volume events indicate that news or an event has occured and should mark an important level where traders and investors may be interested in trading at that level again.
I would consider an uptrend to be in tact when the market is above the latest "high volume bar" and in a downtrend when the market is under the latest "high volume bar".
We use green triangles to plot earnings-release dates and blue triangles for dividends, yellow triangles for range expansion moves and black triangles for emotions (good and bad emotions such has fear and excitement).
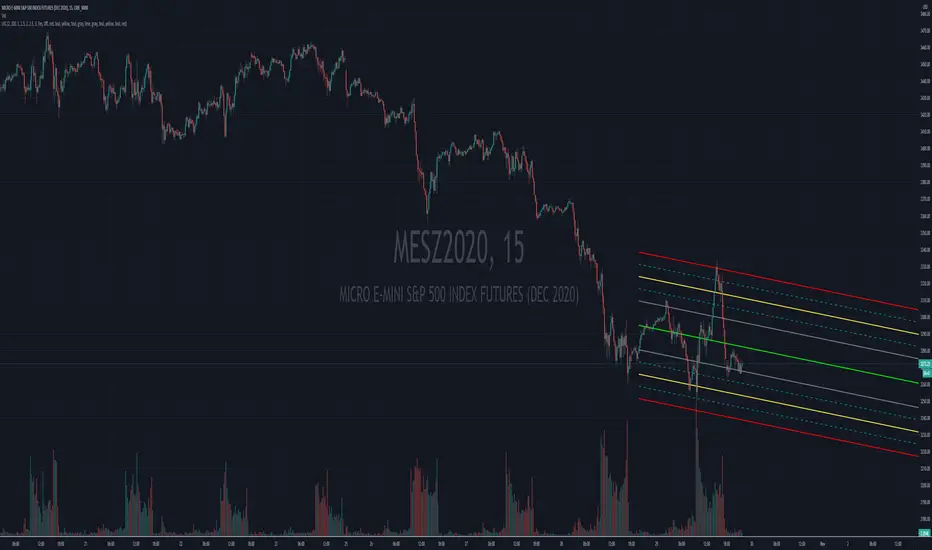
Auto Linear Regression ChannelA Linear Regression Channel gives more objective potential buy and sell signals based on price volatility. It consists of three parts:
Linear Regression Line: A Linear Regression Line is a straight line that best fits the prices between a starting price point and an ending price point. A "best fit" means that a line is constructed where there is the least amount of space between the price points and the actual Linear Regression Line. The Linear Regression Line is mainly used to determine trend direction.
Traders usually view the Linear Regression Line as the fair value price for the stocks. When prices deviate above or below, traders may expect prices to go back towards the Linear Regression Line. As a consequence, when prices are below the Linear Regression Line, this could be viewed by some traders as a good time to buy, and when prices are above the Linear Regression Line, a trader might sell. Of course other technical indicators would be used to confirm these inexact buy and sell signals.
Upper Channel Line: A line that runs parallel to the Linear Regression Line and is usually one to two standard deviations above the Linear Regression Line.
Lower Channel Line: This line runs parallel to the Linear Regression Line and is usually one to two standard deviations below the Linear Regression Line.
The upper and lower channel lines contain between themselves either 68% of all prices (if 1 standard deviation is used) or 95% of all prices (if 2 standard deviations are used). When prices break outside of the channels, either: Buy or sell opportunities are present. Or the prior trend could be ending.
Linear Regression Channel Possible Buy Signal
When price falls below the lower channel line, and a trader expects a continuation of the trend, then a trader might consider it as a buy signal.
Linear Regression Channel Possible Sell Signal
An opportunity for selling might occur when prices break above the upper channel line, but a continuation of the trend is expected by the trader. Other confirmation signs like prices closing back inside the linear regression channel might be used to initiate potential buy or sell orders. Also, other technical indicators might be used to confirm.
Trend Reversals
When price closes outside of the Linear Regression Channel for long periods of time, this is often interpreted as an early signal that the past price trend may be breaking and a significant reversal might be near. Linear Regression Channels are quite useful technical analysis charting tools. In addition to identifying trends and trend direction, the use of standard deviation gives traders ideas as to when prices are becoming overbought or oversold relative to the long term trend.
Default Parameters:
Period: (100) The number of bars to use in the calculation.
This Linear Regression Channel Has 1st, 2nd, and 3rd Deviation lines also the MId Deviation Lines are added for 1.5 and 2.5 area.
LuxAlgo® - Price Action Concepts™Price Action Concepts™ is a first of it's kind all-in-one indicator toolkit which includes various features specifically based on pure price action.
Order Blocks w/ volume data, real-time market structure (BOS, CHoCH, EQH/L) w/ 'CHoCH+' being a more confirmed reversal signal, a MTF dashboard, Trend Line Liquidity Zones (real-time), Chart Pattern Liquidity Zones, Liquidity Grabs, and much more detailed customization to get an edge trading price action automatically.
Many traders argue that trading price action is better than using technical indicators due to lag, complexity, and noisy charts. Popular ideas within the trading space that cater towards price action trading include "trading like the banks" or "Smart Money Concepts trading" (SMC), most prominently known within the forex community.
What differentiates price action trading from others forms of technical analysis is that it's main focus is on raw price data opposed to creating values or plots derived from price history.
Mostly all of the features within this script are generated purely from price action, more specifically; swing highs, swing lows, and market structure... which allows users to automate their analysis of price action for any market / timeframe.
🔶 FEATURES
This script includes many features based on Price Action; these are highlighted below:
Market structure (BOS, CHoCH, CHoCH+, EQH/L) (Internal & Swing) multi-timeframe
Volumetric Order Blocks & mitigation methods (bullish & bearish)
Liquidity Concepts
Trend Line Liquidity Zones
Chart Pattern Liquidity
Liquidity Grabs Feature
Imbalance Concepts MTF w/ multiple mitigation methods
Fair Value Gaps
Balanced Price Range
Activity Asymmetry
Strong/Weak Highs & Lows w/ volume percentages
Premium & Discount Zones included
Candle Coloring based on market structure
Previous Highs/Lows (Daily, Monday's, Weekly, Monthly, Quarterly)
Multi-Timeframe Dashboard (15m, 1h, 4h, 1d)
Built-in alert conditions & Any Alert() Function Call Conditions
Advanced Alerts Creator to create step-by-step alerts with various conditions
+ more (see changelog below for current features)
🔶 BASIC DEMONSTRATION
In the image above we can see a demonstration of the market structure labeling within this indicator. The automatic BOS & CHoCH labels on top of dashed lines give clear indications of breakouts & reversals within the internal market structure (short term price action). The "CHoCH+" label is also demonstrated as it triggers only if price has already made a new higher low, or lower high.
We can also see a solid line with a larger BOS label in the middle of the chart. This label demonstrates a break of structure taking into account the swing market structure (longer term price action). All of these labels are generated in real-time.
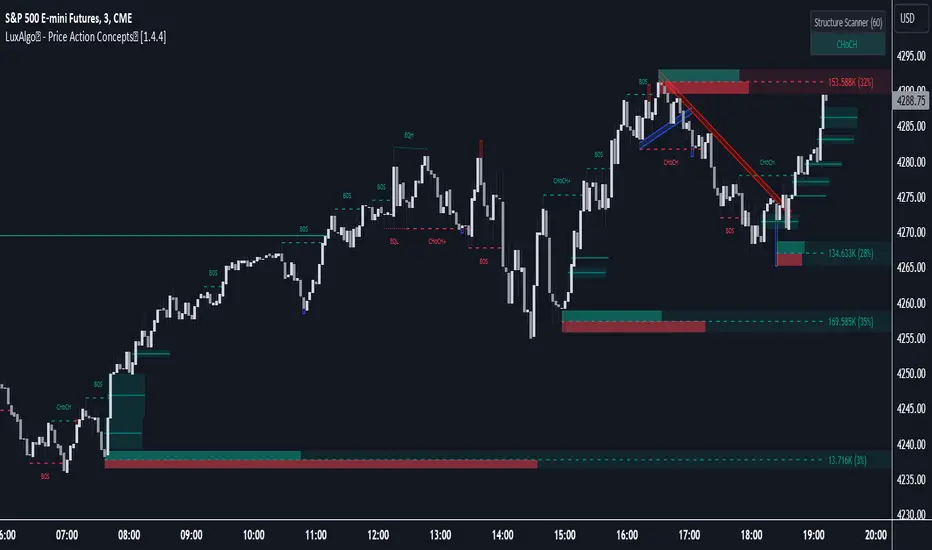
🔶 USAGE & EXAMPLES
In the image below we can see how a trade setup could be created using Order Blocks w/ volume metrics to find points of interest in the market, swing / internal market structure to get indications of longer & shorter term reversals, and trend line liquidity zones to find more likely impulses & breakouts within trends.
We can see in the next image below that price came down to the highest volume order block marked out previously as our point of interest for an entry used in confluence with the overall market structure being bullish (swing CHoCH). Due to price closing below the middle Order Block at (24.77%), we saw it was mitigated, and then price revisited liquidity above the Trend Line zone above, leading us to the first Order Block as a target.
You will notice the % values adjust as Order Blocks are touched & mitigated, aligning with the correct volume detected when the Order Block was established.
In the image below we can see more features from within Price Action Concepts™ indicator, including Chart Pattern Liquidity, Fair Value Gaps (one of many Imbalance Concepts), Liquidity Grabs, as well as the primary market structures & OBs.
By using multiple features as such, users can develop a greater interpretation of where liquidity rests in the market, which allows them to develop trading plans a lot easier. Liquidity Grabs are highlighted as blue/red boxes on the wicks during specific price action that indicates the market has made an impulse specifically to take out resting buy or sell side orders.
We can notice in the trade demonstrated below (hindsight example) how price often moves to the areas of the most liquidity, even if unexpected according to classical technical analysis performed by retail traders such as chart patterns. Wicks to take out orders above & potentially trap traders are much more noticeable with features such as these.
The Chart Patterns which can be detected include:
Ascending/Descending Wedges (Asc/Desc Wedge)
Ascending/Descending Broadening Wedges (Asc/Desc BW)
Ascending/Descending/Symmetrical Triangles (Asc/Desc/Sym Triangle)
Double Tops/Bottoms (Double Top/Double BTM)
Head & Shoulders (H&S)
Inverted Head & Shoulders (IH&S)
General support & resistance during undetected patterns
In the image below we can see more features from within the indicator, including Balanced Price Range (another imbalance method similar to FVG), Market Structure Candle Coloring, Accumulation & Distribution zones, Premium & Discount zones w/ a percentage on each zone, the MTF dashboard, as well as the Previous Daily Highs & Lows (one of many highs/lows) displayed on the chart automatically.
The colored candles use more specific market structure analysis, specifically allowing users to visualize when trends are considered "normal" or "strong". By utilizing other features alongside this market structure analysis, such as noticing price retesting the PDL level + the Equilibrium as resistance, a Balanced Price Range below price, the discount with a high 72% metric, and the MTF dashboard displaying an overall bearish structure...
...users can instantly gain a deeper interpretation of price action, make highly confluent trading plans while avoiding classical technical indicators, and use traditional retail trading concepts such as chart patterns / trend lines to their advantage in finding logical areas of liquidity & points of interest in the market.
The image below shows the previous chart zoomed in with 2 liquidity concepts re-enabled & used alongside a new range targeting the same Discount zone.
🔶 SETTINGS
Market Structure Internal: Allows the user to select which internal structures to display (BOS, CHoCH, or None).
Market Structure Swing: Allows the user to select which swing structures to display (BOS, CHoCH, or None).
MTF Scanner: See market structure on various timeframes & how many labels are active consecutively.
Equal Highs & Lows: Displays EQH / EQL labels on chart for detecting equal highs & lows.
Color Candles: Plots candles based on the internal & swing structures from within the indicator on the chart.
Order Blocks Internal: Enables Internal Order Blocks & allows the user to select how many most recent Internal Order Blocks appear on the chart as well as select a color.
Order Blocks Swing: Enables Swing Order Blocks & allows the user to select how many most recent Swing Order Blocks appear on the chart as well as select a color.
Mitigation Method: Allows the user to select how the script mitigates an Order Block (close, wick, or average).
Internal Buy/Sell Activity: Allows the user to display buy/sell activity within Order Blocks & decide their color.
Show Metrics: Allows the user to display volume % metrics within the Order Blocks.
Trend Line Liquidity Zones: Allows the user to display Trend Line Zones on the chart, select the number of Trend Lines visible, & their colors.
Chart Pattern Liquidity: Allows the user to display Chart Patterns on the chart, select the significance of the pattern detection, & their colors.
Liquidity Grabs: Allows the user to display Liquidity Grabs on the chart.
Imbalance Concepts: Allows the user to select the type of imbalances to display on the chart as well as the styling, mitigation method, & timeframe.
Auto FVG Threshold: Filter out non-significant fair value gaps.
Premium/ Discount Zones: Allows the user to display Premium, Discount , and Equilibrium zones on the chart
Accumulation / Distribution: Allows the user to display accumulation & distribution consolidation zones with an optional Consolidation Zig-Zag setting included.
Highs/Lows MTF: Displays previous highs & lows as levels on the chart for the previous Day, Monday, Week, Month, or quarter (3M).
General Styling: Provides styling options for market structure labels, market structure theme, and dashboard customization.
Any Alert() Function Call Conditions: Allows the user to select multiple conditions to use within 1 alert.
🔶 CONCLUSION
Price action trading is a widely respected method for its simplicity & realistic approach to understanding the market itself. Price Action Concepts™ is an extremely comprehensive product that opens the possibilities for any trader to automatically display useful metrics for trading price action with enhanced details in each. While this script is useful, it's critical to understand that past performance is not necessarily indicative of future results and there are many more factors that go into being a profitable trader.
🔶 HOW TO GET ACCESS
You can see the Author's instructions below to get instant access to this indicator & our premium suite.
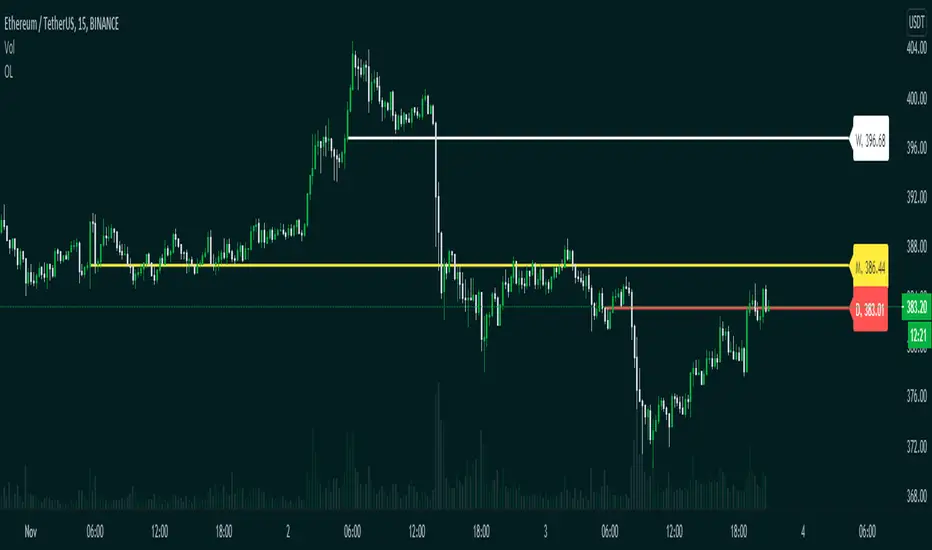
Opening LevelsOpening Levels is an indicator to draw lines on the opening prices of the current day, week, and month.
Inputs:
1. Line Width :- Opening Levels Line width, from 1 to 10
2. Right Offset :- Right offset from current bar, from 0 to 50
3. Line Style :- Select line styles from
4. Show Label :- Show or hide price labels
5. Day Level Color :- Current day opening level color
6. Week Level Color :- Current week opening level color
7. Month Level Color :- Current month opening level color
8. Day Label Text Color :- Current day label text color
9. Week Label Text Color :- Current Week label text color
10. Month Label Text Color :- Current month label text color
Happy trading.
Volatility Support & Resistance [LM]Hello guys,
I would like to introduce you volatility support and resistance horizontals. It draws line horizontal on high and low vhighly volatile candles. You can select lines on this timeframe and/or another one. It's done in the same spirit like my other indicators for horizontals
The colors are dynamic depending whether price is below or above the line:
for the current timeframe green is used for support and blue for resistance
for the other timeframe by default 4h orange is used for support and violet for resistance
There are various sections in setting:
general settings - here you can select ATR length, multiplier and show labels
show and hide section of the current timeframe
other timeframe
show and hide other timeframe horizontals
Any suggestions are welcome

Silen's Pseudo VPVR / Pseudo Volume Profile Custom RangeDisclamer: This indicator does not use actual Volume data and doesn't display any Volume data. It creates a pseudo Volume Profile by counting the high-low-2 values of candles and simulates something that is similar to a Volume Profile without using any Volume data.
Core facts:
Creates a pseudo Volume Profile by counting values of candles and sorting them into a Profile.
Works for charts that don't provide any Volume Information.
Can display up to 5 different Value Levels.
Value level colors are (from largest to smallest level): Red, Orange, Yellow, Green, Blue.
The Value levels can be used as Support and Resistance indicators.
The Custom Range of the Volume Profile can be adjusted from 10 to 1500 bars.
Much faster than the other custom pseudo VPVRs out there.
Shortcomings:
As the chart progresses with bars the line positions will distort to the left side. Refreshing the tradingview page or switching to another time interval fixes this. I might fix this issue in the future.
Does not use actual Volume nor display actual Volume.
Note: For those who wondered what happened to my first version of this indicator: It got taken down by Tradingview because it was misleading as to using the words "Volume Profile" and "Visible Range". I fully support their decision and I hope I could clear any misunderstandings! Give their team a heads up for the hard work they're doing in keeping this place clean and well organized!
Enjoy! :)

Market ProfileHello All,
This is Market Profile script. "Market Profile is an intra-day charting technique (price vertical, time/activity horizontal) devised by J. Peter Steidlmayer. Steidlmayer was seeking a way to determine and to evaluate market value as it developed in the day time frame. The concept was to display price on a vertical axis against time on the horizontal, and the ensuing graphic generally is a bell shape--fatter at the middle prices, with activity trailing off and volume diminished at the extreme higher and lower prices." You better search it on the net for more information, you can find a lot of articles and books about the Market Profile.
You have option to see Value Area, All Channels or only POC line, you can set the colors as you wish.
Also you can choose the Higher Time Frame from the list or the script can choose the HTF for you automatically.
Enjoy!

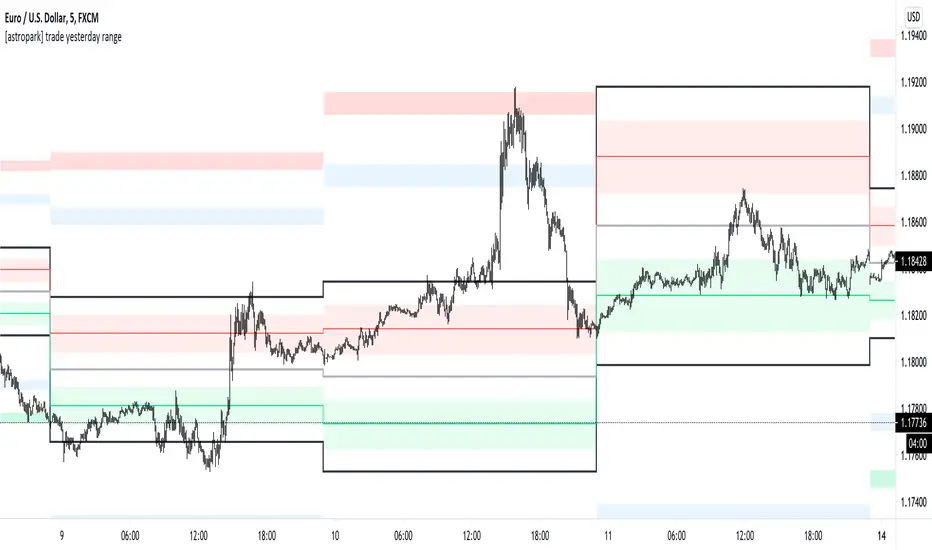
[astropark] trade yesterday rangeDear followers,
today a nice scalping tool for day trading on low time frames (1-3-5 minutes)!
Each day the indicator will print some important levels and ranges related to the trading day before:
yesterday high (black line)
yesterday day range averange (silver line)
yesterday low (black line)
average between yesterday high and yesterday average, together with a resistance range (red)
average between yesterday low and yesterday average, together with a support range (green)
two extension ranges above yesterday high (first is blue, second is red)
two extension ranges below yesterday low (first is blue, second is green)
Trading levels is one of most effective trading tecniques:
once a level is broken upwards, you can long (buy) the bullish retest with stoploss below recent low
once a level is broken downwards, you can short (sell) the bearish retest with stoploss below recent high
consolidation below or at a resistance level is bullish, so long (buy) breakout upwards and long more on a bullish retest of broken level
consolidation above or at a support level is bearish, so short (sell) breakout downwards and short more on a bearish retest of broken level
many times you see a level to be tested 2 or 3 times: short (sell) double and triple top, long (buy) double or triple bottom
Here you can see the levels described above and basic usage in a consolidation trading day:
A trader who wants to be a winner must understand that money and risk management are very important, so manage your position size and always have a stop loss in your trades.
Here you can see many examples on how to use this indicator.
Triple top on yesterday range high: perfect short setup (5 take profits targets in the example)
Resistance levels broken: long setup on bullish retest (2 take profits targets in the example)
Double top and support broken: 2 short setups (2 and 3 take profits targets in the example)
Here some examples how to basically use the indicator in a consolidation trading day: short (sell) resistance levels, long (buy) support levels
This is a premium indicator , so send me a private message in order to get access to this script.
Raygun [MS]Support and resistance indicator for any asset and any time frame that makes it simple to visualize S/R flips as well as bullish and bearish bounces and rejections off these levels.
Simple to use, just add to your chart and choose how often you want the levels to update based on the Size setting.
Lower numbers will update more quickly and show more recent levels.
Bigger numbers will update more slowly and show older levels.
Alerts are available for when price nears or bounces off a level of support or resistance, as visualized on the chart.
Settings
• Set the indicator's size
Use the link below or PM us to obtain access to this indicator.

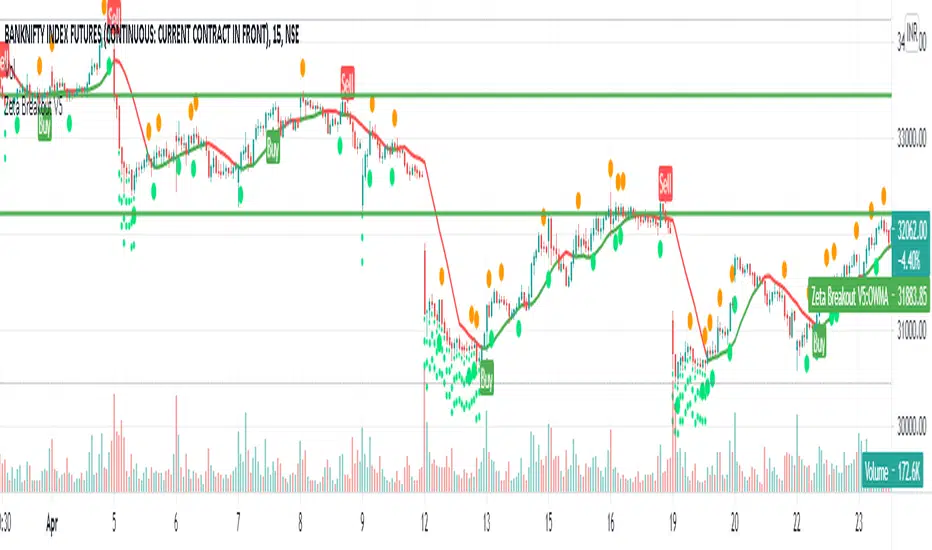
Zeta BreakoutIf I ask you what moves the price, most of you will say the same old answer: Demand & Supply
But who creates Demand & Supply? You or Me, the retailers? No. It is Big Institutions and Mutual Funds and Big Banks which create this demand and supply because the
share of retailers in Stock Market is so little it does not affect the price in a big way.
The Big Institutions, Mutual Funds, Big Banks or in some cases Governments, are collectively called Smart Money.
When Smart Money steps in, the previous levels of Support or Resistance are broken and then the up or down move starts which most probably goes a certain distance.
Now the Support or Resistance levels are not static, they are dynamic in nature and keep changing with the time.
How does this indicator work?
Zeta Breakout dynamically and automatically detects and marks these levels and when the price break-outs or break-downs or bounces up or down from these levels, the Buy or Sell Signals are generated for you to follow.
The indicator keeps watching previous or newly created levels of Support or Resistance and as soon as price crosses these levels or bounces from these levels, the user is alerted in the form of 'Buy' or 'Sell' Signals.
How to use this indicator?
1. When you see a Buy Signal, take Buy Position and hold it till either (a) You see opposite signal or (b) Your Stop Loss is hit which is ideally the low of candle preceding the signal candle or any other user defined SL. If your stop loss is hit and then price again starts moving in the same direction as indicated by the last Buy signal, take a fresh position as soon as the price crosses the level where previous signal is sitting.
2. When you see a Sell Signal, close your Buy Position, take a Sell position and hold it till either (a) You see opposite signal or (b) Your Stop Loss is hit which is ideally the high of candle preceding the signal candle or any user defined SL. If your stop loss is hit and then price again starts moving in the same direction as indicated by the last Sell signal, take a fresh position as soon as the price crosses the level where previous signal is sitting.
What are the target instruments/markets for this indicator?
This indicator can be used on Stocks, Indices, Gold , Silver , Currency Pairs, Crude Oil or anything being trades on any exchange in the world.
This indicator is not limited to any specific time-frame. You may select any time-frame which suits your trading style.
How can you get this indicator?
This is an invite-only paid indicator but we can give you FREE TRIAL for 05 days if you are interested.
For Free Trial, send a message to @jellygill
Multi Time Frame CandlesHello Traders,
This script can show (upto) 3 candles of another time frames without changing chart time frame realtime . You can choose the time frame and number of candles in the options. You have option to change body and wick colors as well.
in this example number of candles is 2:
You can set body and wick colors:
In this example, weekly candles are shown on 1h chart:
Enjoy!

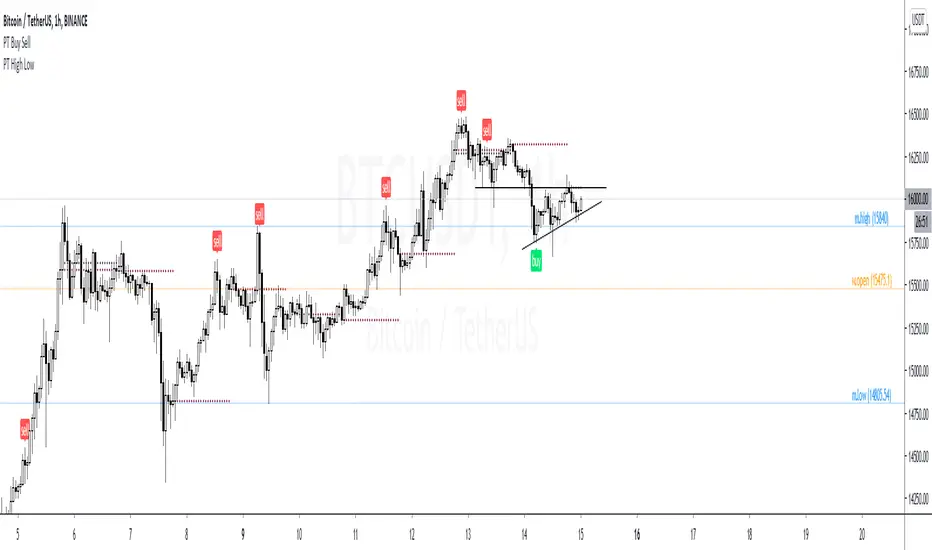
PT High Low Version 1.0 of our PT High Low indicator helps create a visual for the Daily, Weekly, Monthly & Yearly range. These levels will give you an idea of where the price can react if reached. Consider them pivotal areas. We included a toggle that will help you go between the candle's High/Low to the candle's Open/Close. Both features are unique when scalping & swinging. The High/Low will paint a beautiful visual for your day to day trading & the Open/Close will help you determine where price maxed opened & closed for that specified timeframe.
Strategy:
Price tends to gravitate between the Daily level when playing intraday scalps. If playing the weekly, you want to be above the weekly pivot to punt longs & under the weekly level to punt shorts. More likely than not, when the price hits a monthly or yearly level, we get a noticeable reaction off it.
This Oscillator was built around our buy sell indicator & it is used on all time frames for swinging & scalping. It is included as part of the library. Just message us for access!
Automated - Fibs with Market ordersThis script was recently shared for limit only orders here:
This version does not worry about keeping orders in the books and moving them around, instead it will simply market in and out.
I am sharing this to reveal the difference between the 2 setups.

Support and Resistance Levels with Breaks [LuxAlgo]This script provides basic pivot point Support and Resistance Levels to the user whilst displaying Break signal tags. It also has the ability to let the user display more significant breaks by filtering using the Volume Oscillator.
Only more significant breaks of these basic levels are displayed to the user when optimized which avoids noise and messy signals.
It will also display breaks with candles it deems to be bullish (e.g. having a longer upper or lower wick).
Notation
The notation of "B" denotes a break of either a Support or Resistance level with a volume greater than the threshold.
The notation of "Bull or Bear Wick" denotes a bullish or bearish candle on the break.
Settings:
Left Bars - the number of bars left hand side of the pivot.
Right Bars - the number of bars right hand side of the pivot.
Volume Threshold - the threshold value (%) for the Volume Oscillator.
Usage & Details:
Knowing when a pivot S/R level is broken with significance can be of great help to a trader. Many times significant levels may not be broken with significant force and the move is therefore weaker and possibly not worth trading.

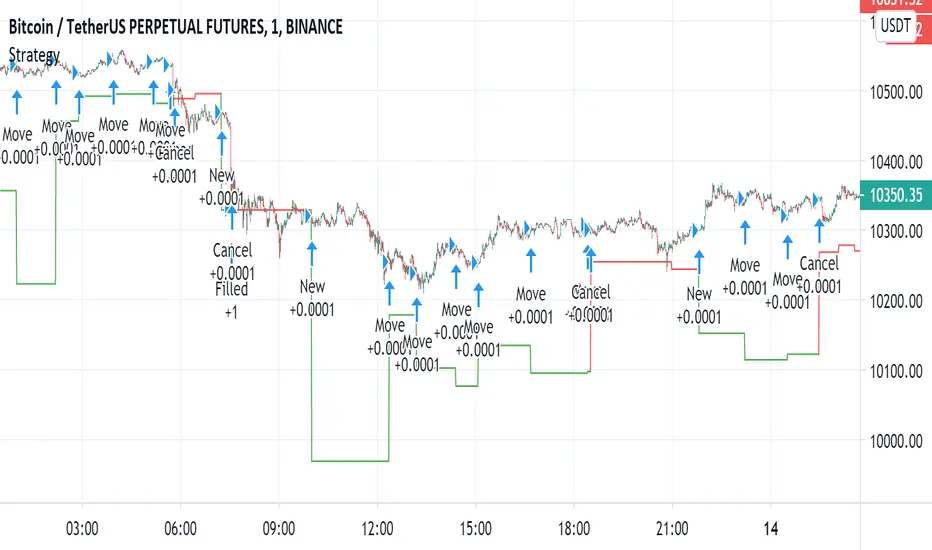
Automated - Fibs with Limit only ordersAutomated - Fibs with Limit only orders
This script was designed to demonstrate how you can use a single alert to move your limit orders around.
It is not meant to be traded live and has been built to work with Binance Futures Testnet.
You will notice a lot of plots with 5 different titles.
New = Place your limit buy at a fixed-price.
Move = Cancel the current limit buy and place it at the new fixed-price.
Filled = Cancel any limit closes and places them anew based on the new average and take profit.
Cancel = Cancels exisiting limit buys.
Cloes All = Limit close filled, no commands necessary.
The default quantity in the command is the minimum order size on Binance.
Settings
Live
- If enabled it will only place trades after the "Stat Timestamp + Start Delay" that you provide.
Start Timestamp
- Use something similar to epochconverter to get the current timestamp.
Start Delay
- Gives you 1 minute by default to start the script and create your alert before it begins looking for a new entry.
Leverage
- Default 1. Affects the "Take Profit and DCA When" Settings.
Take Profit %
- This is the percentage above the current average you'd like to place your position close at.
DCA When %
- The percentage below your last entry that you're willing to buy again.
Note: This strategy has no stop-loss and pyramiding is enabled. It is not built for, or recommended to run live.
I hope this opens some doors and helps advance your personal trading system.
Good luck and happy scripting!
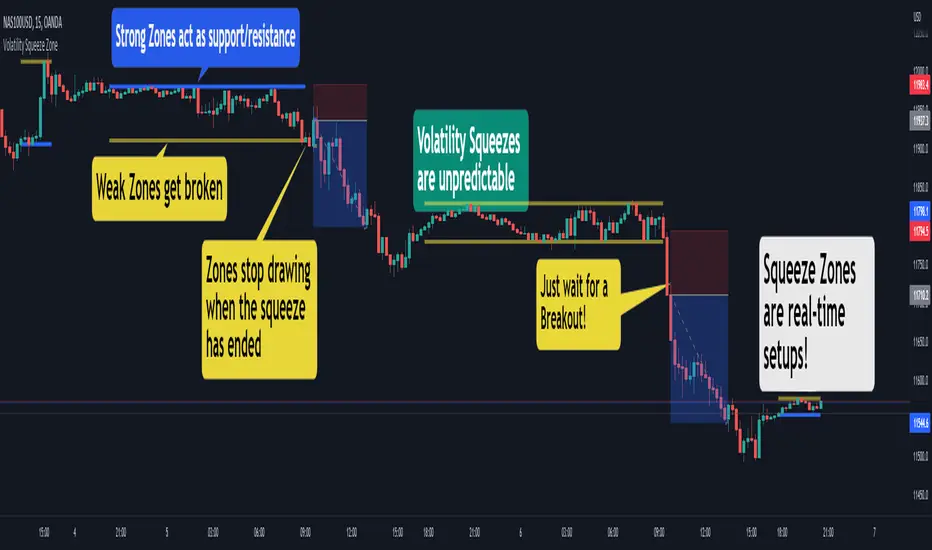
Squeeze ZoneThis script supports my previous post Empirical Suite
It automatically plots Support and Resistance levels on the chart during periods of volatility squeeze.
You have three plotting methods:
From High to Low
From Open to Close
Linear Regression (experimental)
The levels are color-coded:
Red: weak, one-sided volatility squeeze
Orange: typically strong, no volatility issue
You can have a double-red zone, where both buying and selling volatility has dropped.
Combine this with the Empirical Suite or your favorite
analysis tools for extra confirmation.
Cheers,
EFX
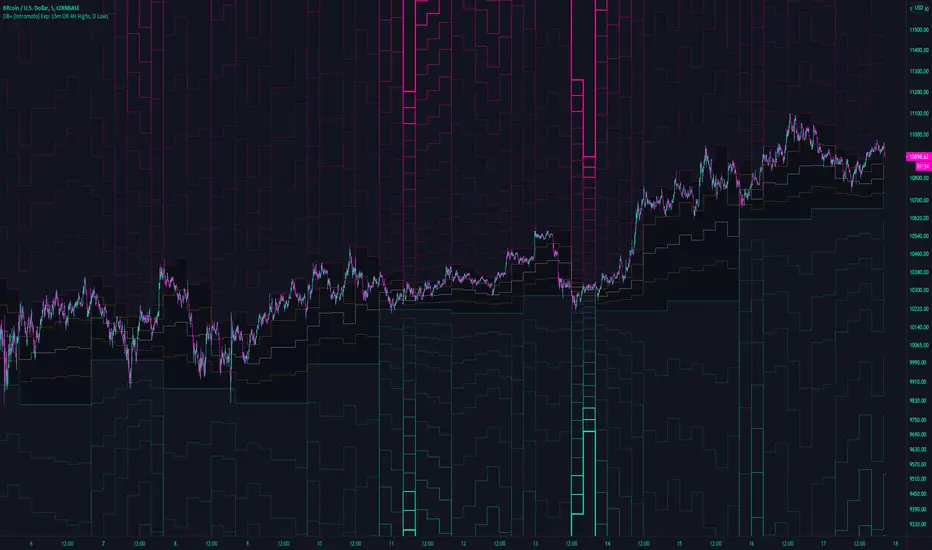
OB+ [Intromoto] Exp: 15m OR 4H Highs, D LowsThis is an experimental script that runs off of the IB
The IB can give directional bias towards the trend and give S/R levels.
I wanted something relevant to IB but for more frequent intraday trading, so this indicator runs on a 15 minute opening range of each trading day, establishing the IB, but where as the highs are set to 4H sessions, while the lows remain on the daily IB time frame.
The extension lines, just as with my IB+ script are 0.5x-12x the relevant IB range of that session, in both directions. Also included are the inside IB 25%, 50%, and 75% levels.
Please PM me for access.