Bjorgum MTF MAScope:
Up to 3 MA's can be applied at the users discretion
Choose between 10 different average types including favorites from the Bjorgum series from HEMA to Reversal T3's
Each MA can be independently set
Go Multi-timeframe! Any MA can be set to any timeframe of reference you choose (ex. using 3 different timeframes of higher resolution to your chart reference to establish a multi-time frame trend)
RSI HEATMAP. Use the bar color or the MA color selection toggle to set your color to reference RSI on a gradient. This helps to establish clear visual reference to momentum on top of trend analysis
Assigning RSI bar color to an MA of a higher time frame can allow you to see visual reference of momentum of the greater trend that may be at play.
Example: trying to get short on a 15min while your 1hr and 4hr RSI Heatmap burns deep in oversold.
RSI color can be assigned to the bar color, the MA (1,2 or 3), or both. Alternatively, bar color can be assigned to a more simple rising/ falling MA color and price above/ below the MA for bar color.
ALL MTF FUNCTIONS ARE NON_REPAINTING.
The Idea
The original inspiration behind the script came from an observation of a constant struggle of Pinecoders of both youth or experience to find accurate multi-timeframe indicators that do not repaint, and appear as should on historical bars, while performing reliably in real time. I encourage you to scroll the Pinecoders FAQ on a recent piece explaining the difficulties and caveats of different approaches, but I would like to reference the elimination of the historical bar offset for THIS purpose. MA's are based on closing prices, that is to say they are confirmed and will not change once the bar has closed. There is no need to offset these for historical reference. The purpose of the historical offset is best exemplified, for example, with an intraday strategy involving daily breakouts. Let's entertain going long on a break to a new daily high. We would not know that in real time so we need to reference the previous bars close for BACKTESTING purposes, otherwise we get "lookahead bias". There is no shortage of strategies unintentionally employing this bias out there (I'm sure you have come across them with their unrealistic results).
There is no worry of repainting with the MTF security function included within this script, nor will it offset for something involving lookahead bias. I encourage those that are playing with the code or perhaps writing strategies of their own to borrow the functions within. There is also a function that will return the 10 MA variable selection - yours to keep.
With all that in mind, I wanted a practical script that is easily deployable in everyday trading for the average trader that gives the user a firm grip on their trading steering wheel equipped with the feel of the road. Incorporating several MA's of differing times with the RSI heatmap gives a good visual reference and feel to your trading environment, while offering a level of customization that will fit an individuals personal trading style. The RSI heatmap gradient is per percentage between 30 and 70 and your 2 colors - anything outside of those levels gives you the vibrant bias color
Below I walk through 2 examples of live trades scenarios I made using the mindset the script offers.
The Trade
LONG IZEA
Timeframe: 4hr chart
- 3 Tilson MA's of varying length are deployed at varying intraday time frames
- A bullish pattern in an uptrend offers a possible trade allowing entry from a low risk point from the pattern low
- See the chart for notes and observations using the script
- Notice how the heatmap brightens up as price extends far away from the averages - your risk has elevated for a new position
- Notice the heatmap cool off while price action consolidates sideways
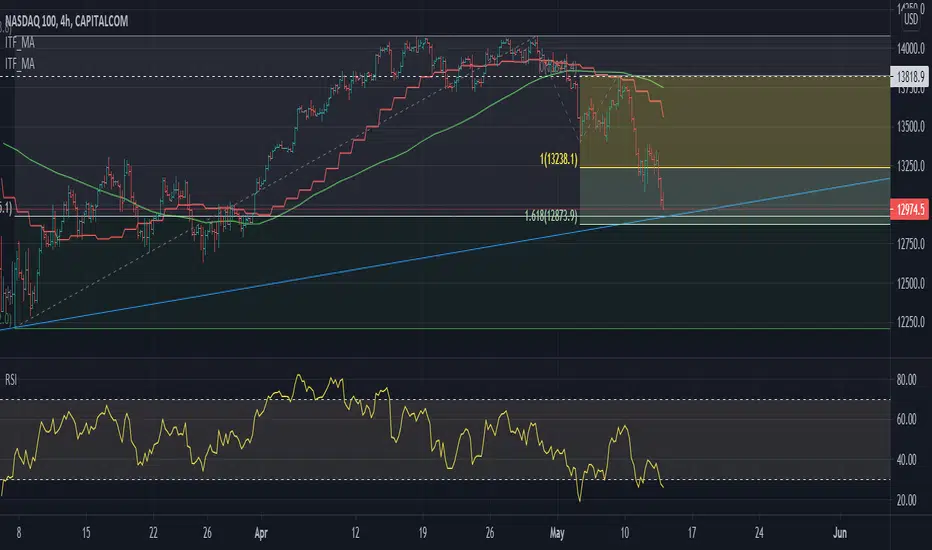
The Trade
SHORT BTCUSDT
Timeframe: 4hr chart
- 3 EMAs are employed - same length (50), with 3 successive timeframe resolutions
- A downtrend is formed with a sharp move to stack the EMAs into layers
- A pull back opportunity presents itself in bearish consolidation
- Notice a Doji star at resistance establishing a swing high as RSI cools off into the EMA dynamic resistance for entry
- An '"equal legs" measured move can be used for a trade target with a stop out above the swing high.
- Again, take note of distance from EMA's, the heatmap in combination with trend development surrounding the MA's
These were just two ideas to show you an example of how to implement some strategy into your trading and to get some interesting use from the indicator. Hope you enjoyed the read and happy trading.
Timeframe

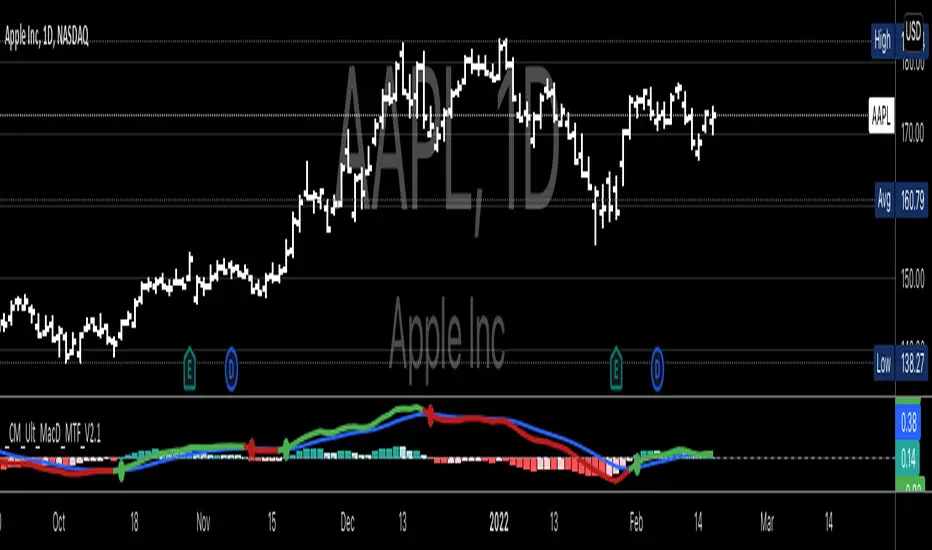
CM MACD Custom Indicator - Multiple Time Frame - V2***For a Detailed Video Overview Showing all of the Settings...
Click HERE to View Video
New _CM_MacD_Ult_MTF _V2 Update 07-28-2021
Thanks to @SKTennis for help in Updating code to V2
Added Groups to Settings Pane.
Added Color Plots to Settings Pane
Switched MTF Logic to turn ON/OFF automatically w/ TradingView's Built in Feature
Updated Color Transparency plots to work in future update
Added Ability to Turn ON/OFF Show MacD & Signal Line
Added Ability to Turn ON/OFF Show Histogram
Added Ability to Change MACD Line Colors Based on Trend
Added Ability to Highlight Price Bars Based on Trend
Added Alerts to Settings Pane.
Customized how Alerts work. Must keep Checked in Settings Pane, and When you go to Alerts Panel, Change Symbol to Indicator (CM_Ult_MacD_MTF_V2)
Customized Alerts to Show Symbol, TimeFrame, Closing Price, MACD Crosses Up & MACD Crosses Down Signals in Alert
Alerts are Pre-Set to only Alert on Bar Close
See Video for Detailed Overview
New Updates Coming Soon!!!
***Please Post Feedback and Any Feature Requests in the Comments Section Below***
Timeweighted Colored VWAP with SlopeHey, traders!
This script calculates the VWAP's change rate against ATR in a number of k-lines. It controls the VWAP line's color based on the average change rate, and it changes its color in a time-weighted way.
1. Calculating vwapValue's rate of change
2. Controlling Line's color based on the average change rate against ATR
3. Calculating average change rate in the past k-lines
K线的数量:计算多少根K线的VWAP值的变化率的平均值,相当于用K线的数量来时间加权
变化率阈值:线条颜色变化的阈值,VWAP值的变化率比这个大或者小时改变颜色,否则延续原来的颜色
Good luck with your trading!

Moving Average Ribbon [TheBearFighter]
This code was written using:
•Pine Script Coding Conventions.
This script provides a very useful tool for new community users and professionals. It puts at your disposal a Moving Average Ribbon by hand to graph and easily find the ones with the highest performance. The creation of this script was motivated because in free TradingView accounts there is a limit of 3 indicators by chart, and with this tool you can draw up to 32 MA's at the same time!
Choose one of 10 types of MA´s:
•KAMA Kaufman's moving average.
•HULL Hull moving average.
•TEMA Triple exponencial moving average.
•LSMA Least square moving average.
•DEMA Double exponencial moving average.
•ALMA Arnaud Legoux moving average.
•WMA Weighted moving average
•EMA Exponencial moving average.
•VWMA Volume Weighted moving average.
•SMA Simple moving average.
Use the tooltips to know the lengths of MA´s.
A main characteristic of the script is that the lengths are in days but when changing the lowest timeframes, the same daily resolution is maintained. This gives us extreme precision in intraday timeframes, e.g 30 minutes.
Once this is understood, we can turning the MA´s on/off, and changing the timeframe to our liking.
Available timeframes: M, W, D, 4H, 1H, 30m, 15m, 5m.
Also the MA´s are colored for easy visualization and know if they grow or decrease.
Thank´s to @midtownsk8rguy to let me know more about HEX colors.
Thank´s to @HPotter for his KAMA.

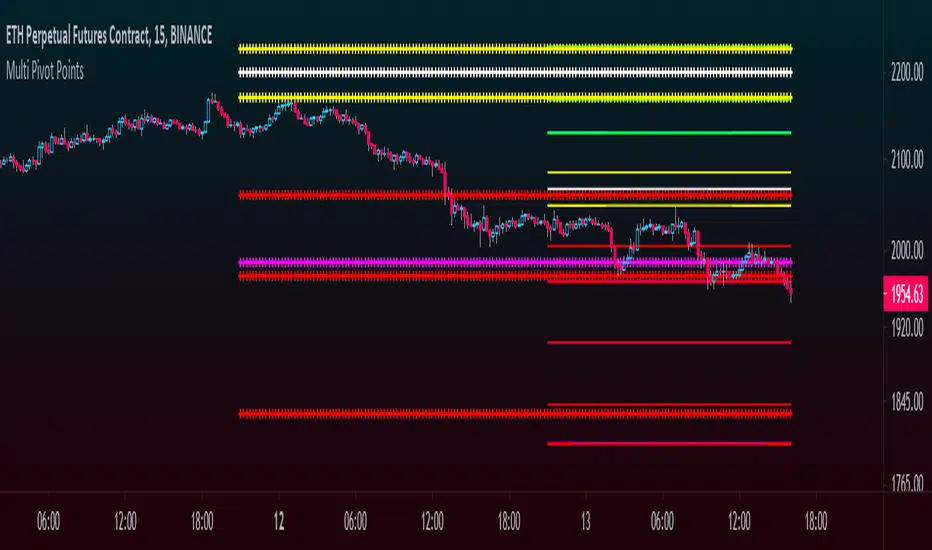
Multi Pivot Points - All in One IndicatorThis multi pivot indicator allows you to plot and overlay different types of pivot points:
-Fibonacci
-Floor Traders
-Camarilla
In addition to this, you can plot pivots from two different timeframes of your choice, for example the daily & weekly pivots, monthly & yearly, etc.
-You can select the linestyle, width and color of each pivot type for easy recognition of levels.
-You can choose to show only the current set of pivots or you can show the historical levels too.
This indicator allows traders to search for high probability targets or support and resistance zones via the confluence of both different pivot types and timeframes. These levels can work for either day traders or longer terms traders.
In the case of Fibonacci levels these can be chosen in the menu.
Enjoy!!
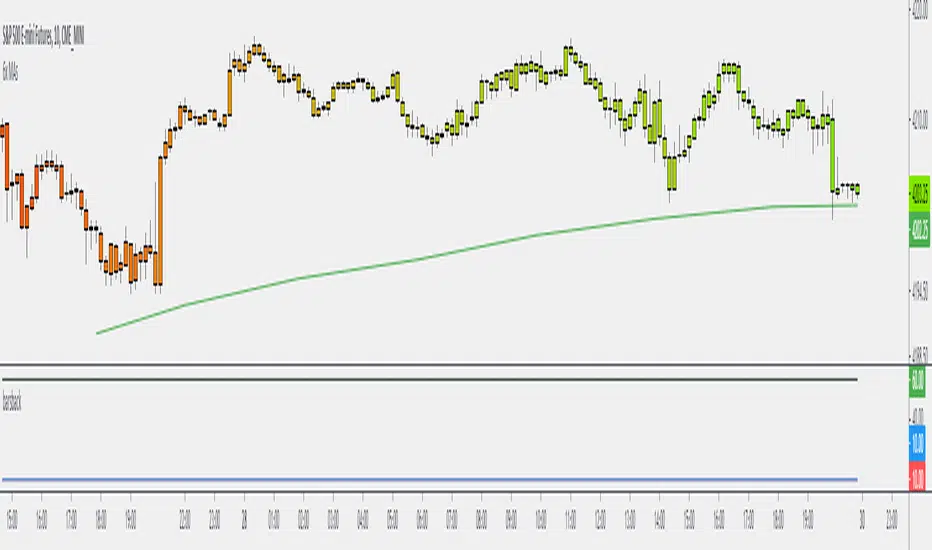
Example - Custom Defined Dual-State SessionThis script example aims to cover the following:
defining custom timeframe / session windows
gather a price range from the custom period ( high/low values )
create a secondary "holding" period through which to display the data collected from the initial session
simple method to shift times to re-align to preferred timezone
Articles and further reading:
www.investopedia.com - trading session
Reason for Study:
Educational purposes only.
Before considering writing this example I had seen multiple similar questions
asking how to go about creating custom timeframes or sessions, so it seemed
this might be a good topic to attempt to create a relatively generic example.

MTF Trend WidgetThis indicator identifies trends in multiple higher timeframes (D, W, M) and shows them in a widget off to the right of the chart.
It's meant to be used as an alternative filter for "trading with the trend." Typically people use moving averages of varying lengths for this (i.e. if over 200 MA it's an uptrend, etc.), but I wanted to see if it might be more effective to see if the higher timeframes were actually trending or not in a certain direction.
For the purposes of this indicator, an uptrend is defined as higher highs and higher lows. So if currently in a downtrend and the highs are broken, the indicator will flip to an uptrend because now we have a higher high. Vice versa for downtrends.
The user can choose the lookback period for defining these highs/lows (the pivot points). A smaller lookback number will give you more frequent pivot points.
The user can toggle on visibility of all historical pivot points to make sure the frequency and placement of the swing highs/lows is to their liking.
The user can show the support/resistance lines of those most recent swing high/low points on the multiple timeframes as well.
When these lines are breached, that is when the trends change, so you can see if you are close to changing any longer term trends.
My hope is that this gives people a quick glance at the overall trend without having to cycle through different timeframes.

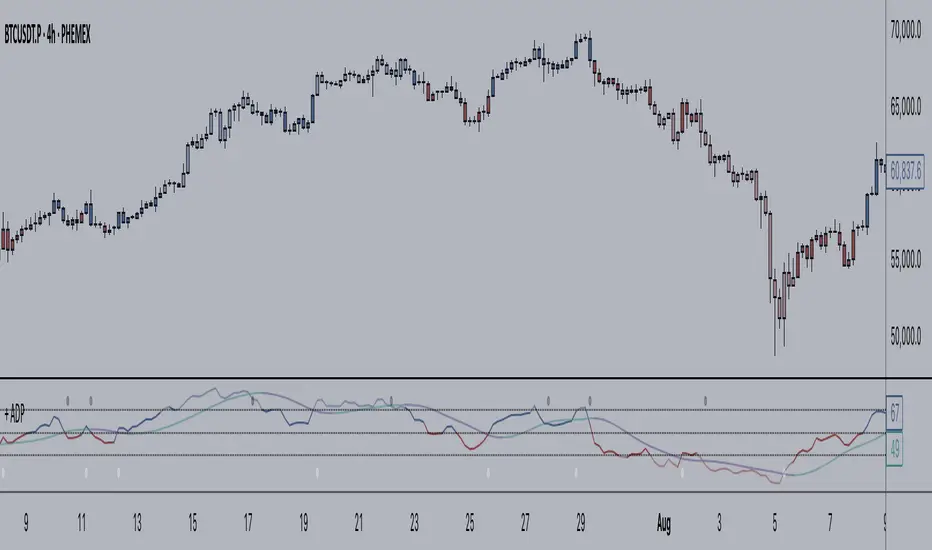
+ Accumulation/DistributionThis is an updated version (with lots of extras added) of the Accumulation/Distribution indicator coded by @Cl8DH.
You can read about what he says about his indicator, and how to use it, here:
So, from that, what have I done?
I added a moving average (of which there are many types to choose from) so that you can use this as a "two lines cross" indicator, as well as a "mid-line cross" indicator.
I added Bollinger Bands (primarily for when "range" is turned off, but if you want to use the Bands with it in fixed range mode too, that's fine. You do you.).
I added candle coloring for both ways of using this indicator:
In rangebound mode there is overbought and oversold coloring, as well as bullish (ADP above the MA and median) and bearish (ADP below the MA and median), and neutral (ADP is above the MA but below the median, or below the MA and above the median). With range turned off there is no overbought or oversold of course. Above the MA and median is bullish, below both is bearish, and neutral covers that grey area where it's neither one nor the other.
The indicator itself is also colored in the same way the candles are. The MA and BBands are biased colored as well (green/red).
Alerts for pretty much every condition imaginable.
Please note in the image above the indicator is pretty gaudy. I don't use it like that, and you can turn a lot of that stuff off (lines, shading, etc.). That is just the default settings.
Like I said, I think Bollinger Bands make most sense if you have it set to range off, but they could be useful either way. Depends on you, the trader.
The candle color is 100% based on the moving average, so if you are using the BBands, set your MA to the default 20 SMA because that's what BBands use for the basis. If you just turn off the MA, whatever it is set to the indicator will still see that and use it (unless you turn off candle colors) to color the candles.
Above is the same image, but just with range turned off, and the Bollinger Bands turned off.
That's all. Hope you like this! It's becoming a favorite of mine, and a lot of what I've implemented here will be added to my previously released indicators, as well as any new ones.
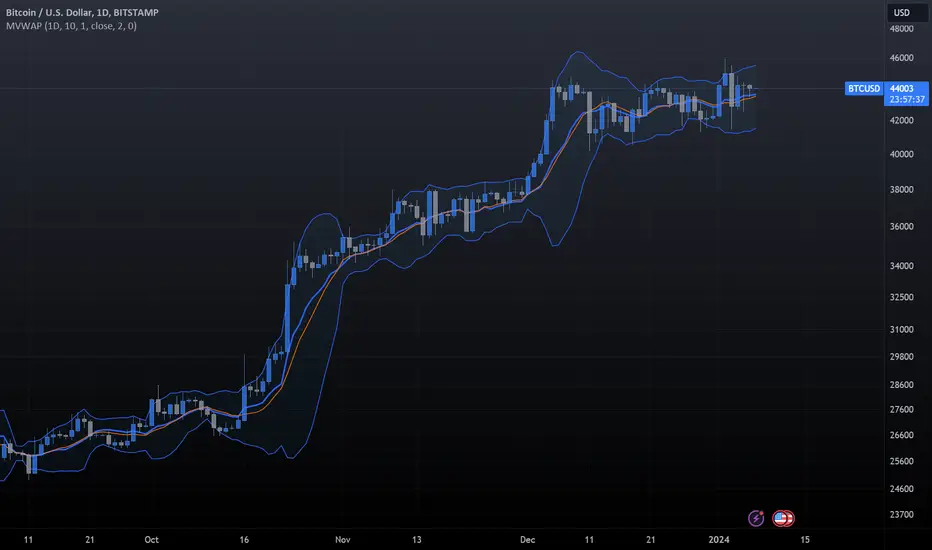
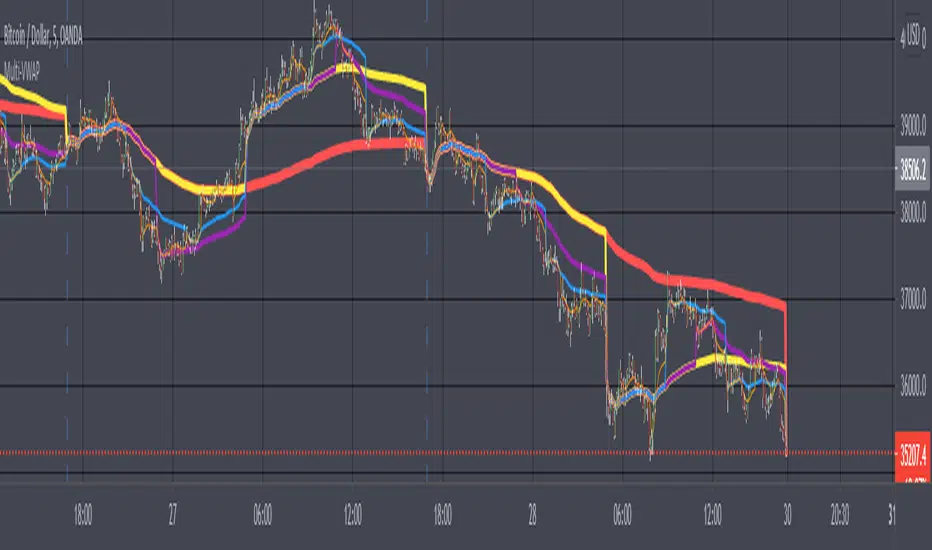
Multi-VWAPVolume Weighted Average Price (VWAP) Definition
What is the Volume Weighted Average Price (VWAP)?
The volume weighted average price (VWAP) is a trading benchmark used by traders that gives the average price a security has traded at throughout the day,
based on both volume and price. It is important because it provides traders with insight into both the trend and value of a security.
-Investopedia By JASON FERNANDO Reviewed by SOMER ANDERSON Updated Feb 24, 2021
-Choose from 5 different Timeframes (lower or higher)
HTF Candles by DGThigher timeframe (multi timeframe) candles
a simple study introducing new pine function box.new

MTF Bars Back FunctionDesigning higher timeframe tools is challenging. Particularly when you want to apply the higher timeframe lookback to the viewing timeframe.
Here are the problems you run into when you want to use a higher timeframe input:
The output is a string.
On the daily, weekly, or monthly timeframes, the output of the input.resolution variable is "1D", "1W", and "1M".
The 1 minute, 1 day, 1 week, and 1 month timeframes all have an output of 1. Same for the 2m, 2d, 2w, 2m and so on.
I designed this function to automatically calculate the number of candles back that you would need to go back on the timeframe you're viewing to cover the lookback distance on the higher.
It checks if there's a letter on the end of the string and cuts it off, leaving just the number, then converts it from a string to a number.
From there it converts the viewing timeframe and higher timeframe into minutes, divides the two to determine their relationship to one another, then it multiplies the lookback distance of the higher timeframe with the factor and the output is the higher timeframe lookback distance converted into the equivalent bar count on the lower timeframe.
I tried to write it in a way that would make what the function does clear to coders and non-coders so it can be modified to suit your purpose. My initial use case was to us this as way of determining a lower timeframe offset for lines that were cast based on previous high timeframe bars. You could use it for any kind of MTF indicator where you want to know how many bars back you need on the low timeframe to achieve the higher timeframe equivalent. For example, if you wanted to create a multi-timeframe moving average, you would use the output as the length of the moving average.
I used a tuple output for the purpose of demonstration, but this can be reduced to a single relevant output.
Hope you find it useful. It's nice when you don't have to fight against multiple resolutions.
Let me know what you think. Is there a better way to go about it?
Trade well.
Multiple Timeframe RSI with 2 MA by GodtrixHi guys, how ya doing!
I know sometimes you'll need multiple timeframe RSI to study your chart, so do I, therefore I'll share my multi RSI tool for you.
There are total 3 RSI for you to use, you can turn each ON or OFF
I've added more colored value lines for your better view
Also provided a choice for smooth line or step line where there's no gap for higher timeframe RSI on a smaller timeframe chart
MA (SMA) is provided for smoother, less noise lines
Indicator Tips:
Bullish - When it is above 50, this is where you might want to decide whether to close your short order or new short order at top
Bearish - When it is below 50, this is where you might want to decide whether to close your long order or new long order at low


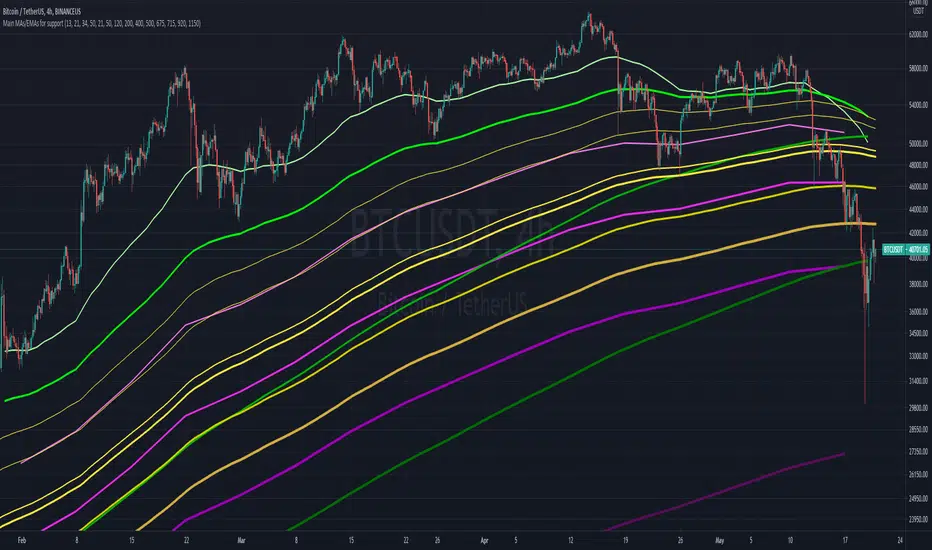
Main MAs and EMAs multi-timeframe for supportObjective is to map out different multi-timeframe support/resistance , all at once. Includes weekly, daily and 4H EMAs and MAs, as per the follow (allowing customization)
WEEKLY (in pink/purple variations):
- 13 EMA
- 21 EMA
- 34 EMA
- 50 M.A
DAILY (in green variations):
- 21 EMA
- 50 EMA
- 120 M.A.
- 200 M.A.
4H (in yellow/golden colors):
- 400 EMA
- 500 EMA
- 675 EMA
- 715 EMA
- 920 EMA
- 1150 EMA
Notes:
- Quite useful to all types of assets; crypto, commodities , stocks, etc...
- Ideally not to be visible all the time, as it can "pollute" the charts. But very helpful in moments of great volatility
ITF_MASimple script to plot inter-time frame moving averages on a chart. ie: plotting a daily MA on a 1 hour chart. Any questions on the parameters, don't hesitate to ask.
Squeeze Momentum Indicator MTF with alerts [lazy bear]MTF version of the popular squeeze momentum indicator, created and shared by Lazy Bear

Stepping MAInput desired timeframe and etc
Ex: Timeframe Daily
Input 100
Will display daily moving of 100 on every timeframe

NSDT Heiken-Ashi Direction Bar MTFA simple script that places a bar at the bottom of the chart to indicate the direction of Heiken-Ashi candles - while still using traditional candles on the main chart. Try setting the bar on a higher timeframe to see the overall direction of the trend, while using traditional candles for entries/exits.
Multi Resolution RSIThis is a Multi resolution or multi Time frame RSI.
This indicator is made to see 3 different time frames RSI in a single Band.
User can input all 3 timeframes on input section.
The Highest time RSI is denoted in BLACK color.
The Medium time RSI is denoted in BLUE color.
The Smaller time RSI is denoted in GREEN color.
The overbought and oversold region is 70 and 30.
The best way to trade using this indicator is when Higher and medium RSI is above 60 and lower is below 40.

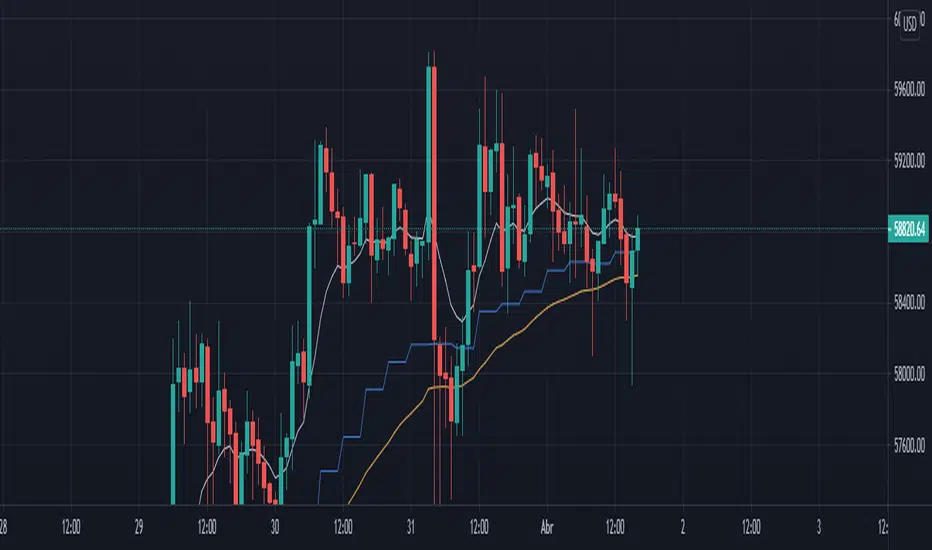
RK's 15 ∴ Timeframed Multiple MA Types RibbonI developed this indicator focusing on the KISS (Keep It Simple, Stupid) to help me in a more direct and visual way when enteringand exiting my market position.
The idea is to configure the indicator with your favorite Moving Averages and Lengths and Enter Long when the price is above and Short when the price is below.
I put the setup that I am testing now in the tooltips to give an example.
NSDT MTF Moving AverageThis script allows you to choose a movingaverage type and length, and then choose two different chart time frames. It will plot a movingaverage line for each time frame you select (total of 2). Choose between EMA, SMA, and WMA.
For example:
You can be looking at a 5-min chart, but have an EMA for a 1-min timeframe and a 10-min timeframe be displayed.

Multi_TF_EMAMultiple TimeFrame EMA
In a single indicator, up to 6 EMAs can be displayed in 6 different time frames.
En un solo indicador se puede visualizar hasta 6 EMAs en diferentes TImeFrames.