Trading Monster - XAUUSD Trend ValidatorTrading Monster – XAUUSD Trend Validator is an invite-only confluence and market condition filter designed for intraday analysis of XAUUSD on the 15-minute timeframe.
This indicator does not generate trade entries by itself. Instead, it validates trade setups by analyzing trend alignment and market conditions, helping traders decide when to participate and when to stay out.
The Trend Validator is intended to be used alongside a primary signal or trend-following system to improve discipline and avoid unfavorable market phases.
How to Use
• Recommended symbol: XAUUSD
• Recommended timeframe: 15 minutes
• Use this indicator as a confirmation layer, not as a standalone signal
• If market conditions are unfavorable, traders are advised to wait or avoid entries
Important Notes
• This script is for educational and analytical purposes only
• It does not execute trades or provide financial advice
• All trading involves risk; users must apply proper risk management
• Past performance does not guarantee future results
Trendfilter

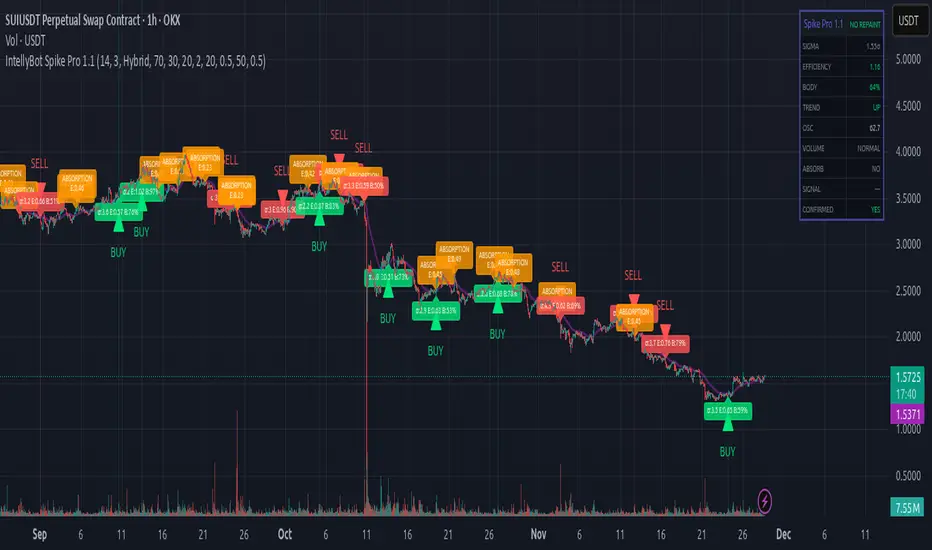
IntellyBot Spike ProIntellyBot Spike Pro
IntellyBot Spike Pro helps you quickly spot unusual market activity and highlights only the signals that truly matter. It cuts out the noise and marks candles where something “big” is happening – whether it's strong buying, strong selling, or a possible trend reversal.
What the script does for you
Detects real volume spikes:
It identifies moments when trading activity suddenly increases, often caused by large market orders or the start of a new move.
Generates clean Buy and Sell signals:
A signal is only shown when multiple conditions line up (trend direction, candle strength, momentum, etc.). This reduces false alerts and keeps things simple.
Spots absorption (hidden strength or weakness):
The script highlights candles where volume is high but price barely moves.
This can be a sign that big players are absorbing orders before a potential reversal.
No repainting:
All signals are based on confirmed candles and will not change later.
Includes a visual dashboard:
A small on-chart panel shows key information at a glance, such as trend, volume strength, efficiency, oscillator reading, and active signals.
Perfect for traders who want to…
use volume as an early indicator
catch real breakouts and avoid fake moves
identify trend shifts sooner
get clean, visual signals without combining many tools
Smart RSI Composite [DotGain]Summary
Do you want to know the "True Direction" of the market without getting distracted by noise on a single timeframe?
The Smart RSI Composite simplifies market analysis by aggregating momentum data from 10 different timeframes (5m to 12M) into a single, easy-to-read Histogram.
Instead of looking at 10 separate charts or dots, this indicator calculates the Average RSI of the entire market structure. It answers one simple question: "Is the market predominantly Bullish or Bearish right now?"
⚙️ Core Components and Logic
This indicator works like a consensus mechanism for momentum:
Data Aggregation: It pulls RSI values from 10 customizable slots (Default: 5m, 15m, 1h, 4h, 1D, 1W, 1M, 3M, 6M, 12M). All slots are enabled by default.
Smart Averaging: It calculates the arithmetic mean of all active timeframes. If the 5m chart is bearish but the Monthly chart is bullish, this indicator balances them out to show you the net result.
Histogram Visualization: The result is plotted as a histogram centered around the 50-line (Neutral).
🚦 How to Read the Histogram
The histogram bars indicate the aggregate strength of the trend based on the Average RSI:
🟩 DARK GREEN (Strong Bullish)
Condition: Average RSI > 60.
Meaning: The market is in a strong uptrend across most timeframes. Momentum is firmly on the buyers' side.
🟢 LIGHT GREEN (Weak Bullish)
Condition: Average RSI between 50 and 60.
Meaning: Slight bullish bias. The bulls are in control, but momentum is not yet extreme.
🔴 LIGHT RED (Weak Bearish)
Condition: Average RSI between 40 and 50.
Meaning: Slight bearish bias. The bears are taking control.
🟥 DARK RED (Strong Bearish)
Condition: Average RSI < 40.
Meaning: The market is in a strong downtrend across most timeframes. Momentum is firmly on the sellers' side.
Visual Elements
Center Line (50): This acts as the Zero-Line. Above 50 is bullish, below 50 is bearish.
Zone Lines (30/70): Dashed lines indicate the traditional Overbought/Oversold levels applied to the aggregate average.
Key Benefit
The Smart RSI Composite acts as a powerful Macro Trend Filter .
Pro Tip: Never go long if the Histogram is Dark Red, and avoid shorting when it is Dark Green. Use this tool to align your trades with the overall market momentum.
Have fun :)
Disclaimer
This "Smart RSI Composite" indicator is provided for informational and educational purposes only. It does not, and should not be construed as, financial, investment, or trading advice.
The signals generated by this tool (both "Buy" and "Sell" indications) are the result of a specific set of algorithmic conditions. They are not a direct recommendation to buy or sell any asset. All trading and investing in financial markets involves substantial risk of loss. You can lose all of your invested capital.
Past performance is not indicative of future results. The signals generated may produce false or losing trades. The creator (© DotGain) assumes no liability for any financial losses or damages you may incur as a result of using this indicator.
You are solely responsible for your own trading and investment decisions. Always conduct your own research (DYOR) and consider your personal risk tolerance before making any trades.

Trend Cross Filter by Pooja⭐ Trend Cross Filter by Pooja
Trend Cross Filter by Pooja is a clean and efficient crossover-based entry tool designed to help traders identify momentum shifts with clarity. This indicator combines a fast RSI and a smoothed RSI-MA baseline with optional trend and volatility filters, allowing users to focus on higher-quality crossover signals.
The goal of this tool is to offer structured, easy-to-read entries without clutter or complexity. All signals appear directly on the chart using markers, making it suitable for intraday and short-term decision-making.
⭐ Key Features
🔶 1. RSI–MA Crossover Signals
Generates BUY/SELL signals when RSI crosses above or below its moving average.
Clean visual markers help highlight potential momentum changes.
🔶 2. Trend Strength Filter (Optional)
Uses a custom ADX calculation to allow signals only when trend strength meets the selected threshold.
🔶 3. Volatility Filter (ATR-Based)
An optional ATR/Price filter helps avoid signals during extremely low-volatility or flat periods.
🔶 4. RSI-MA Slope Filter
Allows users to accept only those signals where the slope of the RSI-MA indicates meaningful directional strength.
🔶 5. Minimum Bars Between Signals
Prevents back-to-back signals in noisy or sideways conditions.
🔶 6. Chart-Based Visual Signals
Signals appear directly on the price chart:
BUY markers for upward crossover
SELL markers for downward crossover
Users can choose between triangle or label-style signals.
🔶 7. Alert + Webhook Compatible
Built-in alert conditions for BUY and SELL signals.
Users can connect alerts to webhooks or automation tools if they wish.
🔶 8. Flexible Customization
All filters, thresholds, colors, and label styles can be adjusted easily based on personal preference.
⭐ How to Use
Add the indicator to your chart.
Choose your preferred signal style (Label / Triangle).
Enable or disable the ADX, ATR, or slope filters as needed.
Create TradingView alerts using the built-in BUY and SELL alert conditions if automation or notifications are required.
Combine signals with your own risk management and market analysis.
⭐ Notes
Works across multiple timeframes and different instruments.
Filtering options help reduce noise, but users should test settings based on their trading approach.
⚠️ Disclaimer
This indicator is a technical analysis tool created for educational and chart-analysis purposes.
It does not provide financial advice, does not guarantee profits, and should not be used as the sole basis for trading decisions.
Market conditions vary, and users are fully responsible for their own trades, risk management, and results.
Always test any tool or strategy on historical data or a demo environment before using in live markets.

EMA HeatmapEMA Heatmap — Indicator Description
The EMA Order Heatmap is a visual trend-structure tool designed to show whether the market is currently trending bullish, trending bearish, or moving through a neutral consolidation phase. It evaluates the alignment of multiple exponential moving averages (EMAs) at three different structural layers: short-term daily, medium-term daily, and weekly macro trend. This creates a quick and intuitive picture of how well price movement is organized across timeframes.
Each layer of the heatmap is scored from bearish to bullish based on how the EMAs are stacked relative to each other. When EMAs are in a fully bullish configuration, the row displays a bright green or lime color. Fully bearish alignment is shown in red. Yellow tones appear when the EMAs are mixed or compressing, indicating uncertainty, trend exhaustion, or a change in market character. The three rows combined offer a concise view of whether strength or weakness is isolated to one timeframe or broad across the market.
This indicator is best used as a trend filter before making trading decisions. Traders may find more consistent setups when the majority of the heatmap supports the direction of their trade. Green-dominant conditions suggest a trending bullish environment where long trades can be favored. Red-dominant conditions indicate bearish momentum and stronger potential for short opportunities. When yellow becomes more prominent, the market may be transitioning, ranging, or gearing up for a breakout, making timing more challenging and risk higher.
• Helps quickly identify directional bias
• Highlights when trends strengthen, weaken, or turn
• Provides insight into whether momentum is supported by higher timeframes
• Encourages traders to avoid fighting market structure
It is important to recognize the limitations. EMAs are lagging indicators, so the heatmap may confirm a trend after the initial move is underway, especially during fast reversals. In sideways or low-volume environments, the structure can shift frequently, reducing clarity. This tool does not generate entry or exit signals on its own and should be paired with price action, momentum studies, or support and resistance analysis for precise trade execution.
The EMA Order Heatmap offers a clean and reliable way to stay aligned with the broader market environment and avoid lower-quality trades in indecisive conditions. It supports more disciplined decision-making by helping traders focus on setups that match the prevailing structural trend.

Adaptive HMA Trendfilter & Profit SpikesShort Description
Adaptive trend-following filter using Hull Moving Average (HMA) slope.
Includes optional Keltner Channel entries/exits and dynamic spike-based take-profit markers (ATR/Z-Score).
Optional Fast HMA for early entry visualization (not included in logic).
USER GUIDE:
1) Quick Overview
Trend Filter: Slow HMA defines Bull / Bear / Sideways (via slope & direction).
Entries / Exits:
Entry: Color change of the slow HMA (red→green = Long, green→red = Short), optionally filtered by the Keltner basis.
Exit: Preferably via Keltner Band (Long: Close under Upper Band; Short: Close above Lower Band).
Fallback: exit on opposite HMA color change.
Take-Profit Spikes: Marks abnormal moves (ATR, Z-Score, or both) as discretionary TP signals.
Fast HMA (optional): Purely visual for early entry opportunities; not part of the core trading logic (see §5).
2) Adding & Basic Setup
Add the indicator to your chart.
Open Settings (gear icon) and configure:
HMA: Slow HMA Length = 55, Slope Lookback = 10, Slope Threshold = 0.20%.
Keltner: KC Length = 20, Multiplier = 1.5.
Spike-TP: Mode = ATR+Z, ATR Length = 14, Z Length = 20, Cooldown = 5.
Optionally: enable Fast HMA (e.g., length = 20).
3) Input Parameters – Key Controls
Slow HMA Length: Higher = smoother, fewer but cleaner signals.
Slope Lookback: How far back HMA slope is compared against.
Slope Threshold (%): Minimum slope to avoid “Sideways” regime.
KC Length / Multiplier: Width and reactivity of Keltner Channels.
Exits via KC Bands: Toggle on/off (recommended: on).
Entries only above/below KC Basis: Helps filter out chop.
Spike Mode: Choose ATR, Z, or ATR+Z (stricter, fewer signals).
Spikes only when in position: TP markers show only when you’re in a trade.
4) Entry & Exit Logic
Entries
Long: Slow HMA turns from red → green, and (if filter enabled) Close > KC Basis.
Short: Slow HMA turns from green → red, and (if filter enabled) Close < KC Basis.
Exits
KC Exit (recommended):
Long → crossunder(close, Upper KC) closes trade.
Short → crossover(close, Lower KC).
Fallback Exit: If KC Exits are off → exit on opposite HMA color change.
Spike-TP (Discretionary)
Marks unusually large deviations from HMA.
Use for partial profits or tightening stops.
⚠️ Not auto-traded — only marker/alert.
5) Early Entry Opportunities (Fast HMA Cross – visual only)
The script can optionally display a Fast HMA (e.g., 20) alongside the Slow HMA (e.g., 55).
Bullish early hint: Fast HMA crosses above Slow HMA, or stays above, before the Slow HMA officially turns green.
Bearish early hint: opposite.
⚠️ These signals are not part of the built-in logic — they are purely discretionary:
Advantage: Earlier entries, more profit potential.
Risk: Higher chance of whipsaws.
Practical workflow (early long entry):
Fast HMA crosses above Slow HMA AND Close > KC Basis.
Enter small position with tight stop (under KC Basis or HMA swing).
Once Slow HMA confirms green → add to position or trail stop tighter.
6) Recommended Presets
Crypto (1h/2h):
HMA: 55 / 10 / 0.20–0.30%
KC: 20 / 1.5–1.8
Spikes: ATR+Z, ATR=14, Z=20, Cooldown 5
FX (1h/4h):
HMA: 55 / 8–10 / 0.10–0.25%
KC: 20 / 1.2–1.5
Indices (15m/1h):
HMA: 50–60 / 8–12 / 0.15–0.30%
KC: 20 / 1.3–1.6
Fine-tuning:
Too noisy? → Raise slope threshold or increase HMA length.
Too sluggish? → Lower slope threshold or shorten HMA length.
7) Alerts – Best Practice
Long/Short Entry – get notified when trend color switches & KC filter is valid.
Long/Short Exit – for KC exits or fallback exits.
Long/Short Spike TP – for discretionary profit-taking.
Set via TradingView: Create Alert → Select this indicator → choose condition.
8) Common Pitfalls & Tips
Too many false signals?
Raise slope threshold (more “Sideways” filtering).
Enable KC filter for entries.
Entries too late?
Use Fast HMA cross for early discretionary entries.
Or lower slope threshold slightly.
Spikes too rare/frequent?
More frequent → ATR mode or lower ATR multiplier / Z-threshold.
Rarer but stronger → ATR+Z with higher thresholds.
9) Example Playbook (Long Trade)
Regime: Slow HMA still red, Fast HMA crosses upward (early hint).
Filter: Close > KC Basis.
Early Entry: Small size, stop below KC Basis or recent swing low.
Confirmation: Slow HMA turns green → scale up or trail stop.
Management: Partial profits at Spike-TP marker; full exit at KC upper band break.
Hann Window FIR Filter Ribbon [BigBeluga]🔵 OVERVIEW
The Hann Window FIR Filter Ribbon is a trend-following visualization tool based on a family of FIR filters using the Hann window function. It plots a smooth and dynamic ribbon formed by six Hann filters of progressively increasing length. Gradient coloring and filled bands reveal trend direction and compression/expansion behavior. When short-term trend shifts occur (via filter crossover), it automatically anchors visual support/resistance zones at the nearest swing highs or lows.
🔵 CONCEPTS
Hann FIR Filter: A finite impulse response filter that uses a Hann (cosine-based) window for weighting past price values, resulting in a non-lag, ultra-smooth output.
hannFilter(length)=>
var float hann = na // Final filter output
float filt = 0
float coef = 0
for i = 1 to length
weight = 1 - math.cos(2 * math.pi * i / (length + 1))
filt += price * weight
coef += weight
hann := coef != 0 ? filt / coef : na
Ribbon Stack: The indicator plots 6 Hann FIR filters with increasing lengths, creating a smooth "ribbon" that adapts to price shifts and visually encodes volatility.
Gradient Coloring: Line colors and fill opacity between layers are dynamically adjusted based on the distance between the filters, showing momentum expansion or contraction.
Dynamic Swing Zones: When the shortest filter crosses its nearest neighbor, a swing high/low is located, and a triangle-style level is anchored and projected to the right.
Self-Extending Levels: These dynamic levels persist and extend until invalidated or replaced by a new opposite trend break.
🔵 FEATURES
Plots 6 Hann FIR filters with increasing lengths (controlled by Ribbon Size input).
Automatically colors each filter and the fill between them with smooth gradient transitions.
Detects trend shifts via filter crossover and anchors visual resistance (red) or support (green) zones.
Support/resistance zones are triangle-style bands built around recent swing highs/lows.
Levels auto-extend right and adapt in real time until invalidated by price action.
Ribbon responds smoothly to price and shows contraction or expansion behavior clearly.
No lag in crossover detection thanks to FIR architecture.
Adjustable sensitivity via Length and Ribbon Size inputs.
🔵 HOW TO USE
Use the ribbon gradient as a visual trend strength and smooth direction cue.
Watch for crossover of shortest filters as early trend change signals.
Monitor support/resistance zones as potential high-probability reaction points.
Combine with other tools like momentum or volume to confirm trend breaks.
Adjust ribbon thickness and length to suit your trading timeframe and volatility preference.
🔵 CONCLUSION
Hann Window FIR Filter Ribbon blends digital signal processing with trading logic to deliver a visually refined, non-lagging trend tool. The adaptive ribbon offers insight into momentum compression and release, while swing-based levels give structure to potential reversals. Ideal for traders who seek smooth trend detection with intelligent, auto-adaptive zone plotting.

VIX Filter/RSI/EMA Bias/Cum-TICK w/ Exhaustion Zone DashboardThis all-in-one dashboard gives intraday traders a real-time visual read of market conditions, combining volatility regime, trend bias, momentum exhaustion, and internal strength — all in a fully customizable overlay that won’t clutter your chart.
📉 VIX Market Regime Detector
Identifies "Weak", "Normal", "Volatile", or "Danger" market states based on customizable VIX ranges and symbol (e.g., VXN or VIX).
📊 RSI Momentum Readout
Displays real-time RSI from any selected timeframe or symbol, with adjustable length, OB/OS thresholds, and color-coded exhaustion alerts.
📈 EMA Trend Bias Scanner
Compares fast and slow EMAs to define bullish or bearish bias, using your preferred timeframe, symbol, and EMA lengths — ideal for multi-timeframe setups.
🧠 Cumulative TICK Pressure & Exhaustion Engine
Analyzes internal market strength using cumulative TICK data to classify conditions as:
-Strong / Mild Bullish or Bearish Pressure
-Choppy / No Edge
-⚠️ Exhaustion Zones — when raw TICK values hit extreme highs/lows, a separate highlight box appears in the dashboard, warning of potential turning points
All logic is customizable, including TICK symbol, timeframes, thresholds, and lookback periods.
Scalpers and day traders who want fast, visual insight into market internals, exhaustion, and trend bias.

Adaptive Causal Wavelet Trend FilterThe Adaptive Causal Wavelet Trend Filter is a technical indicator implementing causal approximations of wavelet transform properties for better trend detection with adaptive volatility response.
The Adaptive Causal Wavelet Trend Filter (ACWTF) applies mathematical principles derived from wavelet analysis to financial time series, providing robust trend identification with minimal lag. Unlike conventional moving averages, it preserves significant price movements while filtering market noise through signal processing that i describe below.
I was inspired to build this indicator after reading " Wavelet-Based Trend Identification in Financial Time Series " by In, F., & Kim, S. 2013 and reading about Mexican Hat wavelet filters.
The ACWTF maintains optimal performance across varying market regimes without requiring parameter adjustments by adapting filter characteristics to current volatility conditions.
Mathematical Foundation
Inspired by the Mexican Hat wavelet (Ricker wavelet), this indicator implements causal approximations of wavelet filters optimized for real-time financial analysis. The multi-resolution approach identifies features at different scales and the adaptive component dynamically adjusts filtering characteristics based on local volatility measurements.
Key mathematical properties include:
Non-linear frequency response adaptation
Edge-preserving signal extraction
Scale-space analysis through dual filter implementation
Volatility-dependent coefficient adjustment, which I love
Filter Methods
Adaptive: Implements a volatility-weighted combination of multiple filter types to optimize the time-frequency resolution trade-off
Hull: Provides a causal approximation of wavelet edge detection properties with forward-projection characteristics
VWMA: Incorporates volume information into the filtering process for enhanced signal detection
EMA Cascade: Creates a multi-pole filter structure that approximates certain wavelet scaling properties
Suggestion: try all as they will provide slightly different signals. Try also different time-frames.
Practical Applications
Trend Direction Identification: Clear visual trend direction with reduced noise and lag
Regime Change Detection: Early identification of significant trend reversals
Market Condition Analysis: Integrated volatility metrics provide context for current market behavior
Multi-timeframe Confirmation: Alignment between primary and secondary filters offers additional confirmation
Entry/Exit Timing: Filter crossovers and trend changes provide potential trading signals
The comprehensive information panel provides:
Current filter method and trend state
Trend alignment between timeframes
Real-time volatility assessment
Price position relative to filter
Overall trading bias based on multiple factors
Implementation Notes
Log returns option provides improved statistical properties for financial time series
Primary and secondary filter lengths can be adjusted to optimize for specific instruments and timeframes
The indicator performs particularly well during trend transitions and regime changes
The indicator reduces the need for using additional indicators to check trend reversion

Trend Gauge [BullByte]Trend Gauge
Summary
A multi-factor trend detection indicator that aggregates EMA alignment, VWMA momentum scaling, volume spikes, ATR breakout strength, higher-timeframe confirmation, ADX-based regime filtering, and RSI pivot-divergence penalty into one normalized trend score. It also provides a confidence meter, a Δ Score momentum histogram, divergence highlights, and a compact, scalable dashboard for at-a-glance status.
________________________________________
## 1. Purpose of the Indicator
Why this was built
Traders often monitor several indicators in parallel - EMAs, volume signals, volatility breakouts, higher-timeframe trends, ADX readings, divergence alerts, etc., which can be cumbersome and sometimes contradictory. The “Trend Gauge” indicator was created to consolidate these complementary checks into a single, normalized score that reflects the prevailing market bias (bullish, bearish, or neutral) and its strength. By combining multiple inputs with an adaptive regime filter, scaling contributions by magnitude, and penalizing weakening signals (divergence), this tool aims to reduce noise, highlight genuine trend opportunities, and warn when momentum fades.
Key Design Goals
Signal Aggregation
Merged trend-following signals (EMA crossover, ATR breakout, higher-timeframe confirmation) and momentum signals (VWMA thrust, volume spikes) into a unified score that reflects directional bias more holistically.
Market Regime Awareness
Implemented an ADX-style filter to distinguish between trending and ranging markets, reducing the influence of trend signals during sideways phases to avoid false breakouts.
Magnitude-Based Scaling
Replaced binary contributions with scaled inputs: VWMA thrust and ATR breakout are weighted relative to recent averages, allowing for more nuanced score adjustments based on signal strength.
Momentum Divergence Penalty
Integrated pivot-based RSI divergence detection to slightly reduce the overall score when early signs of momentum weakening are detected, improving risk-awareness in entries.
Confidence Transparency
Added a live confidence metric that shows what percentage of enabled sub-indicators currently agree with the overall bias, making the scoring system more interpretable.
Momentum Acceleration Visualization
Plotted the change in score (Δ Score) as a histogram bar-to-bar, highlighting whether momentum is increasing, flattening, or reversing, aiding in more timely decision-making.
Compact Informational Dashboard
Presented a clean, scalable dashboard that displays each component’s status, the final score, confidence %, detected regime (Trending/Ranging), and a labeled strength gauge for quick visual assessment.
________________________________________
## 2. Why a Trader Should Use It
Main benefits and use cases
1. Unified View: Rather than juggling multiple windows or panels, this indicator delivers a single score synthesizing diverse signals.
2. Regime Filtering: In ranging markets, trend signals often generate false entries. The ADX-based regime filter automatically down-weights trend-following components, helping you avoid chasing false breakouts.
3. Nuanced Momentum & Volatility: VWMA and ATR breakout contributions are normalized by recent averages, so strong moves register strongly while smaller fluctuations are de-emphasized.
4. Early Warning of Weakening: Pivot-based RSI divergence is detected and used to slightly reduce the score when price/momentum diverges, giving a cautionary signal before a full reversal.
5. Confidence Meter: See at a glance how many sub-indicators align with the aggregated bias (e.g., “80% confidence” means 4 out of 5 components agree ). This transparency avoids black-box decisions.
6. Trend Acceleration/Deceleration View: The Δ Score histogram visualizes whether the aggregated score is rising (accelerating trend) or falling (momentum fading), supplementing the main oscillator.
7. Compact Dashboard: A corner table lists each check’s status (“Bull”, “Bear”, “Flat” or “Disabled”), plus overall Score, Confidence %, Regime, Trend Strength label, and a gauge bar. Users can scale text size (Normal, Small, Tiny) without removing elements, so the full picture remains visible even in compact layouts.
8. Customizable & Transparent: All components can be enabled/disabled and parameterized (lengths, thresholds, weights). The full Pine code is open and well-commented, letting users inspect or adapt the logic.
9. Alert-ready: Built-in alert conditions fire when the score crosses weak thresholds to bullish/bearish or returns to neutral, enabling timely notifications.
________________________________________
## 3. Component Rationale (“Why These Specific Indicators?”)
Each sub-component was chosen because it adds complementary information about trend or momentum:
1. EMA Cross
o Basic trend measure: compares a faster EMA vs. a slower EMA. Quickly reflects trend shifts but by itself can whipsaw in sideways markets.
2. VWMA Momentum
o Volume-weighted moving average change indicates momentum with volume context. By normalizing (dividing by a recent average absolute change), we capture the strength of momentum relative to recent history. This scaling prevents tiny moves from dominating and highlights genuinely strong momentum.
3. Volume Spikes
o Sudden jumps in volume combined with price movement often accompany stronger moves or reversals. A binary detection (+1 for bullish spike, -1 for bearish spike) flags high-conviction bars.
4. ATR Breakout
o Detects price breaking beyond recent highs/lows by a multiple of ATR. Measures breakout strength by how far beyond the threshold price moves relative to ATR, capped to avoid extreme outliers. This gives a volatility-contextual trend signal.
5. Higher-Timeframe EMA Alignment
o Confirms whether the shorter-term trend aligns with a higher timeframe trend. Uses request.security with lookahead_off to avoid future data. When multiple timeframes agree, confidence in direction increases.
6. ADX Regime Filter (Manual Calculation)
o Computes directional movement (+DM/–DM), smoothes via RMA, computes DI+ and DI–, then a DX and ADX-like value. If ADX ≥ threshold, market is “Trending” and trend components carry full weight; if ADX < threshold, “Ranging” mode applies a configurable weight multiplier (e.g., 0.5) to trend-based contributions, reducing false signals in sideways conditions. Volume spikes remain binary (optional behavior; can be adjusted if desired).
7. RSI Pivot-Divergence Penalty
o Uses ta.pivothigh / ta.pivotlow with a lookback to detect pivot highs/lows on price and corresponding RSI values. When price makes a higher high but RSI makes a lower high (bearish divergence), or price makes a lower low but RSI makes a higher low (bullish divergence), a divergence signal is set. Rather than flipping the trend outright, the indicator subtracts (or adds) a small penalty (configurable) from the aggregated score if it would weaken the current bias. This subtle adjustment warns of weakening momentum without overreacting to noise.
8. Confidence Meter
o Counts how many enabled components currently agree in direction with the aggregated score (i.e., component sign × score sign > 0). Displays this as a percentage. A high percentage indicates strong corroboration; a low percentage warns of mixed signals.
9. Δ Score Momentum View
o Plots the bar-to-bar change in the aggregated score (delta_score = score - score ) as a histogram. When positive, bars are drawn in green above zero; when negative, bars are drawn in red below zero. This reveals acceleration (rising Δ) or deceleration (falling Δ), supplementing the main oscillator.
10. Dashboard
• A table in the indicator pane’s top-right with 11 rows:
1. EMA Cross status
2. VWMA Momentum status
3. Volume Spike status
4. ATR Breakout status
5. Higher-Timeframe Trend status
6. Score (numeric)
7. Confidence %
8. Regime (“Trending” or “Ranging”)
9. Trend Strength label (e.g., “Weak Bullish Trend”, “Strong Bearish Trend”)
10. Gauge bar visually representing score magnitude
• All rows always present; size_opt (Normal, Small, Tiny) only changes text size via text_size, not which elements appear. This ensures full transparency.
________________________________________
## 4. What Makes This Indicator Stand Out
• Regime-Weighted Multi-Factor Score: Trend and momentum signals are adaptively weighted by market regime (trending vs. ranging) , reducing false signals.
• Magnitude Scaling: VWMA and ATR breakout contributions are normalized by recent average momentum or ATR, giving finer gradation compared to simple ±1.
• Integrated Divergence Penalty: Divergence directly adjusts the aggregated score rather than appearing as a separate subplot; this influences alerts and trend labeling in real time.
• Confidence Meter: Shows the percentage of sub-signals in agreement, providing transparency and preventing blind trust in a single metric.
• Δ Score Histogram Momentum View: A histogram highlights acceleration or deceleration of the aggregated trend score, helping detect shifts early.
• Flexible Dashboard: Always-visible component statuses and summary metrics in one place; text size scaling keeps the full picture available in cramped layouts.
• Lookahead-Safe HTF Confirmation: Uses lookahead_off so no future data is accessed from higher timeframes, avoiding repaint bias.
• Repaint Transparency: Divergence detection uses pivot functions that inherently confirm only after lookback bars; description documents this lag so users understand how and when divergence labels appear.
• Open-Source & Educational: Full, well-commented Pine v6 code is provided; users can learn from its structure: manual ADX computation, conditional plotting with series = show ? value : na, efficient use of table.new in barstate.islast, and grouped inputs with tooltips.
• Compliance-Conscious: All plots have descriptive titles; inputs use clear names; no unnamed generic “Plot” entries; manual ADX uses RMA; all request.security calls use lookahead_off. Code comments mention repaint behavior and limitations.
________________________________________
## 5. Recommended Timeframes & Tuning
• Any Timeframe: The indicator works on small (e.g., 1m) to large (daily, weekly) timeframes. However:
o On very low timeframes (<1m or tick charts), noise may produce frequent whipsaws. Consider increasing smoothing lengths, disabling certain components (e.g., volume spike if volume data noisy), or using a larger pivot lookback for divergence.
o On higher timeframes (daily, weekly), consider longer lookbacks for ATR breakout or divergence, and set Higher-Timeframe trend appropriately (e.g., 4H HTF when on 5 Min chart).
• Defaults & Experimentation: Default input values are chosen to be balanced for many liquid markets. Users should test with replay or historical analysis on their symbol/timeframe and adjust:
o ADX threshold (e.g., 20–30) based on instrument volatility.
o VWMA and ATR scaling lengths to match average volatility cycles.
o Pivot lookback for divergence: shorter for faster markets, longer for slower ones.
• Combining with Other Analysis: Use in conjunction with price action, support/resistance, candlestick patterns, order flow, or other tools as desired. The aggregated score and alerts can guide attention but should not be the sole decision-factor.
________________________________________
## 6. How Scoring and Logic Works (Step-by-Step)
1. Compute Sub-Scores
o EMA Cross: Evaluate fast EMA > slow EMA ? +1 : fast EMA < slow EMA ? -1 : 0.
o VWMA Momentum: Calculate vwma = ta.vwma(close, length), then vwma_mom = vwma - vwma . Normalize: divide by recent average absolute momentum (e.g., ta.sma(abs(vwma_mom), lookback)), clip to .
o Volume Spike: Compute vol_SMA = ta.sma(volume, len). If volume > vol_SMA * multiplier AND price moved up ≥ threshold%, assign +1; if moved down ≥ threshold%, assign -1; else 0.
o ATR Breakout: Determine recent high/low over lookback. If close > high + ATR*mult, compute distance = close - (high + ATR*mult), normalize by ATR, cap at a configured maximum. Assign positive contribution. Similarly for bearish breakout below low.
o Higher-Timeframe Trend: Use request.security(..., lookahead=barmerge.lookahead_off) to fetch HTF EMAs; assign +1 or -1 based on alignment.
2. ADX Regime Weighting
o Compute manual ADX: directional movements (+DM, –DM), smoothed via RMA, DI+ and DI–, then DX and ADX via RMA. If ADX ≥ threshold, market is considered “Trending”; otherwise “Ranging.”
o If trending, trend-based contributions (EMA, VWMA, ATR, HTF) use full weight = 1.0. If ranging, use weight = ranging_weight (e.g., 0.5) to down-weight them. Volume spike stays binary ±1 (optional to change if desired).
3. Aggregate Raw Score
o Sum weighted contributions of all enabled components. Count the number of enabled components; if zero, default count = 1 to avoid division by zero.
4. Divergence Penalty
o Detect pivot highs/lows on price and corresponding RSI values, using a lookback. When price and RSI diverge (bearish or bullish divergence), check if current raw score is in the opposing direction:
If bearish divergence (price higher high, RSI lower high) and raw score currently positive, subtract a penalty (e.g., 0.5).
If bullish divergence (price lower low, RSI higher low) and raw score currently negative, add a penalty.
o This reduces score magnitude to reflect weakening momentum, without flipping the trend outright.
5. Normalize and Smooth
o Normalized score = (raw_score / number_of_enabled_components) * 100. This yields a roughly range.
o Optional EMA smoothing of this normalized score to reduce noise.
6. Interpretation
o Sign: >0 = net bullish bias; <0 = net bearish bias; near zero = neutral.
o Magnitude Zones: Compare |score| to thresholds (Weak, Medium, Strong) to label trend strength (e.g., “Weak Bullish Trend”, “Medium Bearish Trend”, “Strong Bullish Trend”).
o Δ Score Histogram: The histogram bars from zero show change from previous bar’s score; positive bars indicate acceleration, negative bars indicate deceleration.
o Confidence: Percentage of sub-indicators aligned with the score’s sign.
o Regime: Indicates whether trend-based signals are fully weighted or down-weighted.
________________________________________
## 7. Oscillator Plot & Visualization: How to Read It
Main Score Line & Area
The oscillator plots the aggregated score as a line, with colored fill: green above zero for bullish area, red below zero for bearish area. Horizontal reference lines at ±Weak, ±Medium, and ±Strong thresholds mark zones: crossing above +Weak suggests beginning of bullish bias, above +Medium for moderate strength, above +Strong for strong trend; similarly for bearish below negative thresholds.
Δ Score Histogram
If enabled, a histogram shows score - score . When positive, bars appear in green above zero, indicating accelerating bullish momentum; when negative, bars appear in red below zero, indicating decelerating or reversing momentum. The height of each bar reflects the magnitude of change in the aggregated score from the prior bar.
Divergence Highlight Fill
If enabled, when a pivot-based divergence is confirmed:
• Bullish Divergence : fill the area below zero down to –Weak threshold in green, signaling potential reversal from bearish to bullish.
• Bearish Divergence : fill the area above zero up to +Weak threshold in red, signaling potential reversal from bullish to bearish.
These fills appear with a lag equal to pivot lookback (the number of bars needed to confirm the pivot). They do not repaint after confirmation, but users must understand this lag.
Trend Direction Label
When score crosses above or below the Weak threshold, a small label appears near the score line reading “Bullish” or “Bearish.” If the score returns within ±Weak, the label “Neutral” appears. This helps quickly identify shifts at the moment they occur.
Dashboard Panel
In the indicator pane’s top-right, a table shows:
1. EMA Cross status: “Bull”, “Bear”, “Flat”, or “Disabled”
2. VWMA Momentum status: similarly
3. Volume Spike status: “Bull”, “Bear”, “No”, or “Disabled”
4. ATR Breakout status: “Bull”, “Bear”, “No”, or “Disabled”
5. Higher-Timeframe Trend status: “Bull”, “Bear”, “Flat”, or “Disabled”
6. Score: numeric value (rounded)
7. Confidence: e.g., “80%” (colored: green for high, amber for medium, red for low)
8. Regime: “Trending” or “Ranging” (colored accordingly)
9. Trend Strength: textual label based on magnitude (e.g., “Medium Bullish Trend”)
10. Gauge: a bar of blocks representing |score|/100
All rows remain visible at all times; changing Dashboard Size only scales text size (Normal, Small, Tiny).
________________________________________
## 8. Example Usage (Illustrative Scenario)
Example: BTCUSD 5 Min
1. Setup: Add “Trend Gauge ” to your BTCUSD 5 Min chart. Defaults: EMAs (8/21), VWMA 14 with lookback 3, volume spike settings, ATR breakout 14/5, HTF = 5m (or adjust to 4H if preferred), ADX threshold 25, ranging weight 0.5, divergence RSI length 14 pivot lookback 5, penalty 0.5, smoothing length 3, thresholds Weak=20, Medium=50, Strong=80. Dashboard Size = Small.
2. Trend Onset: At some point, price breaks above recent high by ATR multiple, volume spikes upward, faster EMA crosses above slower EMA, HTF EMA also bullish, and ADX (manual) ≥ threshold → aggregated score rises above +20 (Weak threshold) into +Medium zone. Dashboard shows “Bull” for EMA, VWMA, Vol Spike, ATR, HTF; Score ~+60–+70; Confidence ~100%; Regime “Trending”; Trend Strength “Medium Bullish Trend”; Gauge ~6–7 blocks. Δ Score histogram bars are green and rising, indicating accelerating bullish momentum. Trader notes the alignment.
3. Divergence Warning: Later, price makes a slightly higher high but RSI fails to confirm (lower RSI high). Pivot lookback completes; the indicator highlights a bearish divergence fill above zero and subtracts a small penalty from the score, causing score to stall or retrace slightly. Dashboard still bullish but score dips toward +Weak. This warns the trader to tighten stops or take partial profits.
4. Trend Weakens: Score eventually crosses below +Weak back into neutral; a “Neutral” label appears, and a “Neutral Trend” alert fires if enabled. Trader exits or avoids new long entries. If score subsequently crosses below –Weak, a “Bearish” label and alert occur.
5. Customization: If the trader finds VWMA noise too frequent on this instrument, they may disable VWMA or increase lookback. If ATR breakouts are too rare, adjust ATR length or multiplier. If ADX threshold seems off, tune threshold. All these adjustments are explained in Inputs section.
6. Visualization: The screenshot shows the main score oscillator with colored areas, reference lines at ±20/50/80, Δ Score histogram bars below/above zero, divergence fill highlighting potential reversal, and the dashboard table in the top-right.
________________________________________
## 9. Inputs Explanation
A concise yet clear summary of inputs helps users understand and adjust:
1. General Settings
• Theme (Dark/Light): Choose background-appropriate colors for the indicator pane.
• Dashboard Size (Normal/Small/Tiny): Scales text size only; all dashboard elements remain visible.
2. Indicator Settings
• Enable EMA Cross: Toggle on/off basic EMA alignment check.
o Fast EMA Length and Slow EMA Length: Periods for EMAs.
• Enable VWMA Momentum: Toggle VWMA momentum check.
o VWMA Length: Period for VWMA.
o VWMA Momentum Lookback: Bars to compare VWMA to measure momentum.
• Enable Volume Spike: Toggle volume spike detection.
o Volume SMA Length: Period to compute average volume.
o Volume Spike Multiplier: How many times above average volume qualifies as spike.
o Min Price Move (%): Minimum percent change in price during spike to qualify as bullish or bearish.
• Enable ATR Breakout: Toggle ATR breakout detection.
o ATR Length: Period for ATR.
o Breakout Lookback: Bars to look back for recent highs/lows.
o ATR Multiplier: Multiplier for breakout threshold.
• Enable Higher Timeframe Trend: Toggle HTF EMA alignment.
o Higher Timeframe: E.g., “5” for 5-minute when on 1-minute chart, or “60” for 5 Min when on 15m, etc. Uses lookahead_off.
• Enable ADX Regime Filter: Toggles regime-based weighting.
o ADX Length: Period for manual ADX calculation.
o ADX Threshold: Value above which market considered trending.
o Ranging Weight Multiplier: Weight applied to trend components when ADX < threshold (e.g., 0.5).
• Scale VWMA Momentum: Toggle normalization of VWMA momentum magnitude.
o VWMA Mom Scale Lookback: Period for average absolute VWMA momentum.
• Scale ATR Breakout Strength: Toggle normalization of breakout distance by ATR.
o ATR Scale Cap: Maximum multiple of ATR used for breakout strength.
• Enable Price-RSI Divergence: Toggle divergence detection.
o RSI Length for Divergence: Period for RSI.
o Pivot Lookback for Divergence: Bars on each side to identify pivot high/low.
o Divergence Penalty: Amount to subtract/add to score when divergence detected (e.g., 0.5).
3. Score Settings
• Smooth Score: Toggle EMA smoothing of normalized score.
• Score Smoothing Length: Period for smoothing EMA.
• Weak Threshold: Absolute score value under which trend is considered weak or neutral.
• Medium Threshold: Score above Weak but below Medium is moderate.
• Strong Threshold: Score above this indicates strong trend.
4. Visualization Settings
• Show Δ Score Histogram: Toggle display of the bar-to-bar change in score as a histogram. Default true.
• Show Divergence Fill: Toggle background fill highlighting confirmed divergences. Default true.
Each input has a tooltip in the code.
________________________________________
## 10. Limitations, Repaint Notes, and Disclaimers
10.1. Repaint & Lag Considerations
• Pivot-Based Divergence Lag: The divergence detection uses ta.pivothigh / ta.pivotlow with a specified lookback. By design, a pivot is only confirmed after the lookback number of bars. As a result:
o Divergence labels or fills appear with a delay equal to the pivot lookback.
o Once the pivot is confirmed and the divergence is detected, the fill/label does not repaint thereafter, but you must understand and accept this lag.
o Users should not treat divergence highlights as predictive signals without additional confirmation, because they appear after the pivot has fully formed.
• Higher-Timeframe EMA Alignment: Uses request.security(..., lookahead=barmerge.lookahead_off), so no future data from the higher timeframe is used. This avoids lookahead bias and ensures signals are based only on completed higher-timeframe bars.
• No Future Data: All calculations are designed to avoid using future information. For example, manual ADX uses RMA on past data; security calls use lookahead_off.
10.2. Market & Noise Considerations
• In very choppy or low-liquidity markets, some components (e.g., volume spikes or VWMA momentum) may be noisy. Users can disable or adjust those components’ parameters.
• On extremely low timeframes, noise may dominate; consider smoothing lengths or disabling certain features.
• On very high timeframes, pivots and breakouts occur less frequently; adjust lookbacks accordingly to avoid sparse signals.
10.3. Not a Standalone Trading System
• This is an indicator, not a complete trading strategy. It provides signals and context but does not manage entries, exits, position sizing, or risk management.
• Users must combine it with their own analysis, money management, and confirmations (e.g., price patterns, support/resistance, fundamental context).
• No guarantees: past behavior does not guarantee future performance.
10.4. Disclaimers
• Educational Purposes Only: The script is provided as-is for educational and informational purposes. It does not constitute financial, investment, or trading advice.
• Use at Your Own Risk: Trading involves risk of loss. Users should thoroughly test and use proper risk management.
• No Guarantees: The author is not responsible for trading outcomes based on this indicator.
• License: Published under Mozilla Public License 2.0; code is open for viewing and modification under MPL terms.
________________________________________
## 11. Alerts
• The indicator defines three alert conditions:
1. Bullish Trend: when the aggregated score crosses above the Weak threshold.
2. Bearish Trend: when the score crosses below the negative Weak threshold.
3. Neutral Trend: when the score returns within ±Weak after being outside.
Good luck
– BullByte

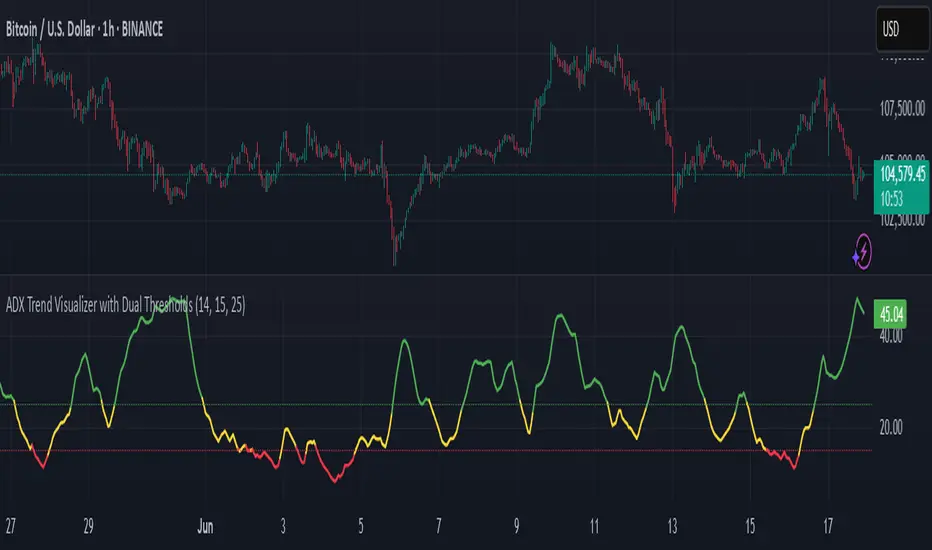
ADX Trend Visualizer with Dual ThresholdsADX Trend Visualizer with Dual Thresholds
A minimal, color coded ADX indicator designed to filter market conditions into weak, moderate, or strong trend phases.
Uses a dual threshold system for separating weak, moderate, and strong trend conditions.
Color coded ADX line:
Green– Strong trend (above upper threshold)
Yellow – Moderate trend (between thresholds)
Red – Weak or no trend (below lower threshold)
Two horizontal reference lines plotted at threshold levels
Optional +DI and -DI lines (Style tab)
Recommended Use:
Use on higher time frames (1h and above) as a trend filter
Combine with entry/exit signals from other indicators or strategies
Avoid possible false entries when ADX is below the weak threshold
This trend validator helps highlight strong directional moves and avoid weak market conditions
Range Filtered Trend Signals [AlgoAlpha]Introducing the Range Filtered Trend Signals , a cutting-edge trading indicator designed to detect market trends and ranging conditions with high accuracy. This indicator leverages a combination of Kalman filtering and Supertrend analysis to smooth out price fluctuations while maintaining responsiveness to trend shifts. By incorporating volatility-based range filtering, it ensures traders can differentiate between trending and ranging conditions effectively, reducing false signals and enhancing trade decision-making.
:key: Key Features
:white_check_mark: Kalman Filter Smoothing – Minimizes market noise while preserving trend clarity.
:bar_chart: Supertrend Integration – A dynamic trend-following mechanism for spotting reversals.
:fire: Volatility-Based Range Detection – Detects trending vs. ranging conditions with precision.
:art: Color-Coded Trend Signals – Instantly recognize bullish, bearish, and ranging market states.
:gear: Customizable Inputs – Fine-tune Kalman parameters, Supertrend settings, and color themes to match your strategy.
:bell: Alerts for Trend Shifts – Get real-time notifications when market conditions change!
:tools: How to Use
Add the Indicator – Click the star icon to add it to your TradingView favorites.
Analyze Market Conditions – Observe the color-coded signals and range boundaries to identify trend strength and direction.
Use Alerts for Trade Execution – Set alerts for trend shifts and market conditions to stay ahead without constantly monitoring charts.
:mag: How It Works
The Kalman filter smooths price fluctuations by dynamically adjusting its weighting based on market volatility. It helps remove noise while keeping the signal reactive to trend changes. The Supertrend calculation is then applied to the filtered price data, providing a robust trend-following mechanism. To enhance signal accuracy, a volatility-weighted range filter is incorporated, creating upper and lower boundaries that define trend conditions. When price breaks out of these boundaries, the indicator confirms trend continuation, while signals within the range indicate market consolidation. Traders can leverage this tool to enhance trade timing, filter false breakouts, and identify optimal entry/exit zones.

Trend Filter (2-pole) [BigBeluga]Trend Filter (2-pole)
The Trend Filter (2-pole) is an advanced trend-following indicator based on a two-pole filter, which smooths out market noise while effectively highlighting trends and their strength. It incorporates color gradients and support/resistance dots to enhance trend visualization and decision-making for traders.
SP500:
🔵What is a Two-Pole Filter?
A two-pole filter is a digital signal processing technique widely used in electronics, control systems, and time series data analysis to smooth data and reduce noise.
//@function Two-pole filter
//@param src (series float) Source data (e.g., price)
//@param length (float) Length of the filter (higher value means smoother output)
//@param damping (float) Damping factor for the filter
//@returns (series float) Filtered value
method two_pole_filter(float src, int length, float damping) =>
// Calculate filter coefficients
float omega = 2.0 * math.pi / length
float alpha = damping * omega
float beta = math.pow(omega, 2)
// Initialize the filter variables
var float f1 = na
var float f2 = na
// Update the filter
f1 := nz(f1 ) + alpha * (src - nz(f1 ))
f2 := nz(f2 ) + beta * (f1 - nz(f2 ))
f2
It operates using two cascaded smoothing stages (poles), allowing for a more refined and responsive output compared to simple moving averages or other basic filters.
Two-pole filters are particularly valued for their ability to maintain smooth transitions while reducing lag, making them ideal for applications where precision and responsiveness are critical.
In trading, this filter helps detect trends by smoothing price data while preserving significant directional changes.
🔵Key Features of the Indicator:
Gradient-Colored Trend Filter Line: The main filter line dynamically changes color based on trend strength and direction:
- Green: Strong uptrend.
- Red: Strong downtrend.
- Yellow: Indicates a transition phase, signaling potential trend shifts.
Support and Resistance Dots with Signals:
- Dots are plotted below the filter line during uptrends and above it during downtrends.
- These dots represent consecutive rising or falling conditions of the filter line, which traders can set in the settings (e.g., the number of consecutive rises or falls required).
- The dots often act as dynamic support or resistance levels, providing valuable guidance during trends.
- Trend Signals:
Customizable Sensitivity: The indicator allows traders to adjust the filter length, damping factor, and the threshold for rising/falling conditions, enabling it to adapt to different trading styles and timeframes.
Bar Color Option: The indicator can optionally color bars to match the gradient of the filter line, enhancing visual clarity of trends directly on the price chart.
🔵How It Works:
The Trend Filter (2-pole) smooths price data using a two-pole filter, which reduces noise and highlights the underlying trend.
The gradient coloring of the filter line helps traders visually assess the strength and direction of trends.
Rising and falling conditions of the filter line are tracked, and dots are plotted when consecutive conditions meet the threshold, acting as potential support or resistance levels during trends.
The yellow transition color signals periods of indecision, helping traders anticipate potential reversals or consolidations.
🔵Use Cases:
Identify and follow strong uptrends and downtrends with gradient-based visual cues.
Use the yellow transition color to anticipate trend shifts or consolidation zones.
Leverage the plotted dots as dynamic support and resistance levels to refine entry and exit strategies.
Combine with other indicators for confirmation of trends and reversals.
This indicator is perfect for traders who want a visually intuitive and highly customizable tool to spot trends, gauge their strength, and make informed trading decisions.

TSF 20What kind of traders/investors are we?
We are trend followers. We look for assets that are outperforming the market. Our scripts are designed to be used on the higher timeframes (weekly/daily) to catch the large moves/trends in the market.
Our scripts have been designed to help you follow the trend in an asset.
What does this script do?
This script is designed to colour candles on a chart based on their position relative to two sets of Bollinger Bands. Here's a breakdown of how it functions:
Bollinger Bands Setup:
The script uses two sets of Bollinger Bands, both with a length of 20 and based on the closing prices of candles.
The first set of Bollinger Bands uses a standard deviation (StdDev) of 1.
The second set uses a standard deviation of 2.
Neither set of bands is displayed on the chart.
Coloring Candles:
Green Candle: A candle is coloured green if its close is above the upper Bollinger Band with StdDev 1 but below the upper Bollinger Band with StdDev 2. This indicates a moderately bullish sentiment.
Dark Green Candle: A candle is colored dark green when its close is above the upper Bollinger Band with StdDev 2. This implies a stronger bullish sentiment.
Red Candle: A candle is coloured red if its close is below the lower Bollinger Band with StdDev 1 but above the lower Bollinger Band with StdDev 2. This indicates a moderately bearish sentiment.
Dark Red Candle: A candle is colored dark red if its close is below the lower Bollinger Band with StdDev 2, indicating a stronger bearish sentiment.
Grey Candle: A candle is coloured grey if it closes between the upper and lower Bollinger Bands with StdDev 1. This usually signifies a neutral market condition or periods of consolidation.
In summary, this script is an analytical tool that visually represents the market's bullishness or bearishness relative to the Bollinger Bands, without displaying the bands themselves. It's designed to help investors quickly assess market conditions and sentiment based on the colour-coded representation of price action in relation to these volatility bands.
What makes this script unique?
Innovative Color-Coding System: Candles are colored in varying shades of green and red, providing an immediate visual cue about the market's bullish or bearish tendencies. A neutral grey is also used, offering a quick assessment of market indecision or consolidation phases.
Dual Bollinger Band Analysis: Utilizes two sets of Bollinger Bands (StdDev 1 and StdDev 2) to gauge market volatility and sentiment. This dual-band approach enhances the precision of sentiment analysis compared to using a single standard deviation.
Customizable and Non-Obtrusive: Designed to keep your charts clean and readable. The Bollinger Bands themselves are not displayed, reducing visual clutter and allowing for a focus on price action.
Versatile and Adaptable: Suitable for various trading styles and timeframes. Whether you are a short-term or long-term investor, this indicator can be seamlessly integrated into your analysis toolkit.
Valuable Addition to Market Analysis: Enhances traditional candlestick analysis and complements other technical indicators and strategies. It offers an additional layer of understanding market dynamics and can be used to confirm or question other signals.
How It Adds Value:
Enhanced Visual Analysis: By colour-coding candles based on Bollinger Band positioning, it simplifies the interpretation of market sentiment and volatility, making it easier to spot trends and reversals.
Strategic Decision Making: Helps traders make more informed decisions by clearly highlighting bullish and bearish strength, or lack thereof, in the market.
Time Efficiency: Reduces the time spent analyzing charts by providing an immediate visual representation of market conditions.
Originality: Offers a fresh perspective and an innovative approach to using Bollinger Bands, making it a unique addition to the community's toolbox.

PB wTF50What kind of traders/investors are we?
We are trend followers, always on the lookout for the next big move in the market. Our scripts are meticulously crafted for higher timeframes (daily, weekly, monthly) aiming to capture the large market trends.
What does this script do?
The Pb wTF50 script simplifies the complex world of investing by colour-coding bars to indicate the trend direction. Green bars signify a bullish trend, red indicates a bearish trend, and a combination of both signifies a sideways market. This visual representation ensures investors can quickly gauge the market's direction and act accordingly.
How is the PB wTF50 produced?
The PB wTF50 script employs the simple moving averages (SMAs) as its backbone. Bars positioned above both the SMAs turn green, indicating a bullish trend. Conversely, bars below these SMAs turn red, signalling a bearish trend.
What is the best timeframe to use the script?
The PB wTF50 script is designed for the weekly timeframe. This ensures that traders and investors are aligned with the long-term market trend, filtering out the noise of shorter timeframes.
What makes this script unique?
The challenges of identifying the onset, progression, and culmination of trends are well-known in the investing community. The PbF script addresses these challenges head-on.
The PB wTF50 is not a lagging indicator. It is aligned with price movement, which helps investors and traders focus on what the asset’s price is doing. The asset’s price is the primary indicator of its direction.
Lagging indicators can be used alongside the PB wTF50 to confirm the asset’s direction.
The PBwTF50 continues to remain green during extended periods of bullish pullbacks and red during extended periods of bearish pullbacks. This helps investors and traders hold positions during corrections in the market.
When interacting with OB/OS zones, investors and traders are positioned to align with the trend and ignore short-term fluctuations against the trend.
The PB wTF50 can be used to enter additional positions, also known as compounding, when an asset’s price has pulled back into an OS zone, but the trend filter has remained green in a bull trend/OB zone, but the trend filter has remained red in a bear trend.
In essence, the PB wTF50 script is a trend filter that gives investors and traders the ability to apply discretion with the start and end of long-term trends as they develop.

Extreme Entry with Mean Reversion and Trend FilterThis non-repainting indicator is an improved version of my previous work, a more versatile tool designed to provide traders with dynamic and adaptive entry signals while incorporating a mean reversion and trend filtering mechanism. By combining RSI overbought/oversold, regular divergence and confirmatory momentum oscillator such as CCI or MOM, this indicator generates more precise and timely signals for entering trades.
The indicator offers a comprehensive set of entry conditions for both Buy and Sell entries:
• For Buy entries, it checks for oversold conditions based on RSI levels, and detects bullish divergence patterns while oversold and it identifies upward crossovers in the selected entry signal source (CCI or Momentum).
• Similarly, for Sell entries, it identifies downward crossovers of the CCI or Mom, after the recent overbought conditions, and bearish divergence patterns inside the overbought RSI.
To refine the entry signals even further, the indicator utilizes a mean reversion filter. Traders can choose to display signals that occur inside or outside the upper and lower mean reversion bands:
• Range Entries are indicating potential buying opportunities near the lower band and selling opportunities near the upper band. This is based on the concept of mean reversion, which suggests that prices tend to return to the average when they reach the upper or lower bands. By focusing on these signals, traders can take advantage of price movements that have a higher probability of reversing towards the mean.
• Extreme Entries, on the other hand, represent signals that occur outside of the bands, signaling potential pullbacks during strong trends. By entering positions only at extreme highs or lows, traders can avoid getting caught in the middle of the trend. This approach helps traders capitalize more favorable trading opportunities which have a high reward-risk ratio.
Trend Filter acts as a directional bias for the entry signals. When enabled, long and short entry conditions are filtered based on the relationship between the closing price and the EMA.
Traders have the flexibility to customize, tweak the indicator filter and values in the settings according to their preferences strategies and traded assets, tailoring the signals to their specific needs. The script sets alert conditions to trigger alerts for buy, sell, or both entry signals. This indicator can be used in conjunction with price action or other technical analysis tools for confirmation and better trading decisions.
I created this indicator for my own use, and I share this for informational purposes only. It does not constitute financial advice so use at your own risk and consider your financial situation before making any trading decisions. The indicator's accuracy is not guaranteed, and past performance is not indicative of future results.
I appreciate your feedback on this indicator. As I am new to script development, I am open to comments and suggestions to improve it. If you encounter any issues while using this indicator, please let me know in the comments section. If you find it helpful, I kindly ask for your support in boosting it. Thank you for your cooperation.

Sublime Trading | Trend Strength FilterWhat kind of traders/investors are we?
We are trend followers. Our scripts are designed to be used on the higher timeframes (weekly/daily) to catch the large moves/trends in the market.
Most have heard of long-term trend following. Few know how to execute the strategy.
Our scripts are designed specifically to identify and invest in long-term market trends.
What does this script do?
Identifying trends is at the heart of sound investing.
This script is colour coded to help identify long-term trends and environments where you will want to consider taking positions.
It is also designed to identify sideways/consolidating markets, environments where you will want to consider standing aside.
How is the trailing stoploss produced?
The script uses two sets of Bollinger Bands, one with setting Standard Deviation 1 and the other with Standard Deviation 2.
These settings help to create 3 zones - Buy, Sell and Stand Aside.
The bars will change colour according to which zone they are in.
The Buy zone is colour-coded green, and when a bull market or the start of a bull trend is in play. The green switches from light green to dark green as the asset’s price moves above the Buy zone.
This switch in colour serves as a warning that a reversal/pullback may occur next from bullish to bearish.
The Sell zone is colour-coded red and when a bear market or the start of a bear trend is in play. The red switches from light red to dark red as the asset’s price moves below the Sell zone.
This switch in colour serves as a warning that a reversal/pullback may occur next from bearish to bullish.
The Stand Aside is confirmed when the colour-code changes to grey. This may not necessarily mean a trend reversal but simply a time to apply patience before a trend continuation.
A sustained mixture of red, green and grey bars confirms a consolidation or sideways market and when investors/traders will want to stand aside and consider another asset.
What is the best timeframe to use the script?
Long-term trends are identified on the daily and weekly timeframes where traders and investors take fewer positions but hold for longer time periods.
We recommend using the script in unison on the weekly and daily timeframes.
When both timeframes fall into the Buy zone and colour-coded green, it signifies a strong bull market.
When both timeframes fall into the Sell zone and colour-coded red, it signifies a strong bear market.
When there is a mixture of green, red and grey bars across the two timeframes, it signifies a sideways market and when investors stand aside and protect their capital.
The weekly timeframe will also help mask the noise on the daily timeframe, allowing you to hold positions longer.
The Trailing Strength Filter script is for investors who want to identify and invest in long-term trends whilst simultaneously eliminating intraday swings.
What makes this script unique?
Identifying the start of long-term trends and then riding out established trends are among the main struggles budding investors face. This script has been coded specifically for the daily and weekly timeframe to:
Seamlessly identify the start, middle and end of trends
Align with the market and remove social media noise calling market tops and bottoms
Allow for discretion when entering but particularly exiting of positions if a market trend has not ended
This trend filter script ensures alignment with long-term market trends.

Moving Average-TREND POWER v2.0-(AS)HELLO:
-This indicator is a waaaay simpler version of my other script - Moving Average-TREND POWER v1.1-(AS).
HOW DOES IT WORK:
-Script counts number of bars below or above selected Moving Average (u can se them by turning PLOT BARS on). Then multiplies number of bars by 0.01 and adds previous value. So in the uptrend indicator will be growing faster with every bar when price is above MA. When MA crosess price Value goes to zero so it shows when the market is ranging.
If Cross happens when number of bars is higher than Upper threshold or below Lower threshold indicator will go back to zero only if MA crosses with high in UPtrend and low in DNtrend. If cross happens inside THSs Value will be zero when MA crosses with any type of price source like for example (close,high,low,ohlc4,hl etc.....).This helps to get more crosess in side trend and less resets during a visible trend
HOW TO SET:
Just select what type of MA you want to use and Length. Then based on your preference set values of THSs'
OTHER INFORMATIONS:
-Script was created and tested on EURUSD 5M.
-For bigger trends choose slowerMAs and bigger periods and the other way around for short trends (FasterMAs/shorter periods)
-Below script code you can find not used formulas for calculating indicator value(thanks chat GPT), If you know some pinescript I encourage you to try try them or maybe bulid better ones. Script uses most basic one.
-Pls give me some feedback/ideas to improve and check out first version. Its way more complicated for no real reason but still worth to take a look'
-Also let me know if you find some logical errors in the code.
Enjoy and till we meet again.

Moving Average - TREND POWER v1.1- (AS)0)NOTE:
This is first version of this indicator. It's way more complicated than it should be. Check out Moving Average-TREND POWER v2.1-(AS), its waaaaay less complicated and might be better.Enjoy...
1)INTRODUCTION/MAIN IDEA:
In simpliest form this script is a trend indicator that rises if Moving average if below price or falling if above and going back to zero if there is a crossover with a price. To use this indicator you will have to adjust settings of MAs and choose conditions for calculation.
While using the indicator we might have to define CROSS types or which MAs to use. List of what cross types are defined in the script and Conditiones to choose from.The list will be below.
2) COMPOSITION:
-MA1 can be defined by user in settings, possible types: SMA, EMA, RMA, HMA, TEMA, DEMA, LSMA, WMA.
-MA2 is always ALMA
3) OVERLAY:
Default is false but if you want to see MA1/2 on chart you can change code to true and then turn on overlay in settings. Most plot settings are avalible only in OV=false.
if OV=true possible plots ->MA1/2, plotshape when choosen cross type
if OV=false -> main indicator,TSHs,Cross counter
4)PRESETS :
Indicator has three modes that can be selected in settings. First two are presets and do not require selecting conditions as they set be default.
-SIMPLE - most basic
-ABSOLUTE - shows only positive values when market is trending or zero when in range
-CUSTOM - main and the most advanced form that will require setting conditions to use in calculating trend
4.1)SIMPLE – this is the most basic form of conditions that uses only First MA. If MA1 is below selected source (High/Low(High for Uptrend and Low for DNtrend or OHLC4) on every bar value rises by 0.02. if it above Low or OHLC4 it falls by 0.02 with every bar. If there is a cross of MA with price value is zero. This preset uses CROSS_1_ULT(list of all cross types below)
4.2) ABSOLUTE – does not show direction of the trend unlike others and uses both MA1 and MA2. Uses CROSS type 123_ULT
4.3) CUSTOM – here we define conditions manually. This mode is defined in parts (5-8 of description)
5)SETTINGS:
SOURCE/OVERLAY(line1) – select source of calculation form MA1/MA2, select for overlay true (look point 3)
TRESHOLDS(line2). – set upper and lower THS, turn TSHs on/off
MA1(line3) – Length/type of MA/Offset(only if MA type is LSM)
MA2(line4) – length/offset/sigma -(remember to set ma in the way that in Uptrend MA2MA1 in DNtrend)
Use faster MA types for short term trends and slower types / bigger periods for longer term trends, defval MA1/2 settings
are pretty much random so using them is not recomended.
CROSSshape(line5) – choose which cross type you want to plot on chart(only in OV=true) or what type you want to use in counting via for loops,
CROSScount(line6) – set lookback for type of cross choosen above
BOOLs in lines 5 and 6 - plotshape if OV=true/plot CROSScount histogram (if OV=false)
Lines 7 and 8 – PRESET we want to use /SRC for calculation of indicator/are conditions described below/which MAs to use/Condition for
reducing value t 0 - (if PRESET is ABSOLUTE or SIMPLE only SRC should be set(Line 8 does not matter if not CUSTOM))
5)SOURCE for CONDS:
Here you can choose between H/L and OHLC. If H/L value grow when MAlow. If OHLC MAOHLC. H/L is set by default and recommended. This can be selected for all presets not only CUSTOM
6)CROSS types LIST:
“1 means MA1, 2 is MA2 and 3 I cross of MA1/MA2. L stands for low and H for high so for example 2H means cross of MA2 and high”
NAME -DEFINITION Number of possible crosses
1L - cross of MA1 and low 1
1H - cross of MA1 and high 1
1HL - cross of MA1 and low or MA1 and high 2 -1L/1H
2L - cross of MA2 and low 1
2H - cross of MA2 and high 1
2HL - cross of MA2 and low or MA1 and high 2 -2L/2H
12L - cross of MA1 and low or MA2 and low 2 -1L/2L
12H - cross of MA1 and high or MA2 and high 2 -1H/2H
12HL - MA1/2 and high/low 4 -1H/1L/2H/2L
3 -cross of MA1 and MA2 1
123HL -crosses from 12HL or 3 5 -12HL/3
1_ULT - cross of MA1 with any of price sources(close,low,high,ohlc4 etc…)
2_ULT - cross of MA2 with any of price sources(close,low,high,ohlc4 etc…)
123_ULT – all crosses possible of MA1/2 (all of the above so a lot)
7)CRS CONDS:
“conditions to reduce value back to zero”
>/< - 0 if indicator shows Uptrend and there’s a cross with high of selected MA or 0 if in DNtrend and cross with low. Better for UP/DN trend detection
ALL – 0 if cross of MA with high or low no matter the trend, better for detecting consolidation
ULT – if any cross of selected MA, most crosses so goes to 0 most often
8)MA selection and CONDS:
-MA1: only MA1 is used,if MA1 below price value grows and the other way around
MA1price =-0.02
-MA2 – only MA2 is used, same conditions as MA1 but using MA2
MA2price =-0.02
-BOTH – MA1 and MA2 used, grows when MA1 if below, grows faster if MA1 and MA2 are below and fastest when MA1 and MA2 are below and MA2price=-0.02
-MA1 and MA2 >price=-0.03
-MA1 and MA2 ?price and MA2>MA1=-0.04
9)CONDITIONS SELECTION SUMMARRY:
So when CUSTOM we choose :
1)SOURCE – H/L or OHLC
2)MAs – MA1/MA2/BOTH
3)CRS CONDS (>/<,ALL,ULT)
So for example...
if we take MA1 and ALL value will go to zero if 1HL
if MA1 and >/< - 0 if 1L or 1H (depending if value is positive or negative).(1L or 1H)
If ALL and BOTH zero when 12HL
If BOTH and ULT value goes back to zero if Theres any cross of MA1/MA2 with price or cross of MA1 and MA2.(123_ULT)
If >/< and BOTH – 0 if 12L in DNtrend or 12H if UPtrend
10) OTHERS
-script was created on EURUSD 5M and wasn't tested on different markets
-default values of MA1/MA2 aren't optimalized so do not
-There might be a logical error in the script so let me know if you find it (most probably in 'BOTH')
-thanks to @AlifeToMake for help
-if you have any ideas to improve let me know
-there are also tooltips to help

Volume-Weighted Trend Filter CloudThe Volume-Weighted Trend Filter Cloud is a powerful technical analysis tool designed to identify trend directions and potential buy/sell signals in a trading instrument. The indicator combines volume-weighted moving averages, average true range (ATR), and cloud plotting techniques to provide a comprehensive view of the market trend.
Inputs:
Length: Specifies the length of Algo used for trend analysis. Default value is 14.
Multiplier: Adjusts the width of the trend filter bands based on the ATR. Default value is 2.0.
Tenkan-sen Period: Defines the period for calculating the Tenkan-sen line. Default value is 200.
Kijun-sen Period: Sets the period for calculating the Kijun-sen line. Default value is 400.
Senkou Span Period: Determines the period for calculating the Senkou Span A and Senkou Span B lines. Default value is 600.
Calculation:
Average True Range (ATR): The indicator calculates the ATR based on the specified moving average length.
Trend Filter Bands: The basic upper and lower bands are calculated using the highest high and lowest low values, respectively, along with the multiplier and ATR. These bands are then adjusted to create the final upper and lower bands, taking into account the previous values.
Trend Direction: The indicator determines the trend direction by comparing the close price with the lower and upper bands. If the close price is above the lower band, it indicates an upward trend (trendUp = 1). If the close price is below the upper band, it indicates a downward trend (trendDown = 1).
Volume-Weighted Z-Score: The indicator calculates the volume-weighted Z-Score by determining the mean and standard deviation of the close price with volume weighting. The Z-Score represents the deviation of the close price from the mean in terms of standard deviations.
Tenkan-sen, Kijun-sen, Senkou Span A, and Senkou Span B: These lines are calculated using the respective periods and the average of the high and low prices.
Sigmoid Transformation: The indicator applies the sigmoid function to the Z-Score values to obtain sigmoid-transformed values for open, high, low, and close prices. These transformed values help in visualizing the trend strength.
Plotting:
Trend Filter: The trend filter is plotted as a line that changes color based on the trend direction. The lower band is displayed for an upward trend, while the upper band is displayed for a downward trend.
Trend Cloud: The cloud plot represents the Senkou Span A and Senkou Span B lines. The cloud color changes based on the trend direction, providing a visual representation of the market trend.
Buy and Sell Signals: The indicator generates buy and sell signals based on the crossover of fast and slow moving averages, Z-Score values, trend direction, and other conditions. These signals are labeled on the chart, indicating potential entry points for traders.
The indicator generates buy and sell signals based on specific conditions, including the intersection of fast and slow moving averages, Z-Score values, trend direction, and more.
Buy signals are described as a "buy signal" on the chart, which indicates potential entry points for buy trades.
Sell signals are described as a "sell signal", which indicates potential entry points for sell trades. The signals in light color represent that they are signals in the opposite direction of the cloud that can be considered as exit points

Williams %R + Keltner chanells - indicator (AS)1)INDICATOR ---This indicator is a combination of Keltner channels and Williams %R.
It measures trend using these two indicators.
When Williams %R is overbought(above upper line (default=-20)) and Keltner lower line is below price indicator shows uptrend (green).
When Williams %R is oversold(below lower line (default=-80)) and Keltner upper line is above price indicator shows downtrend (red) .
Can be turned into a strategy quickly.
2) CALCULATIONS:
Keltner basis is a choosen type of moving average and upper line is basis + (ATR*multiplier). Same with lower but minus instead of plus so basiss – (ATR*multiplier)
Second indicator
Williams %R reflects the level of the close relative to the highest high for the lookback period
3)PLS-HELP-----Looking for tips, ideas, sets of parameters, markets and timeframes, rules for strategy -------OVERALL -every advice you can have
4) SIGNALS-----buy signal is when price is above upper KC and Williams %R is above OVB(-20). Short is exactly the other way around
5) CUSTOMIZATION:
-%R-------LENGTH/SMOOTHING/TYPE SMOOTHING MA
-%R-------OVS/MID/OVB -(MID-no use for now)
-KC -------LENGTH/TYPE OF MAIN MA
-KC-------MULTIPLIER,ATR LENGTH
-OTHER--LENGTH/TYPE OF MA - (for signal filters, not used for now)
-OTHER--SOURCE -src of calculations
-OTHER--OVERLAY - plots %R values for debugging etc(ON by default)
6)WARNING - do not use this indicator on its own for trading
7)ENJOY
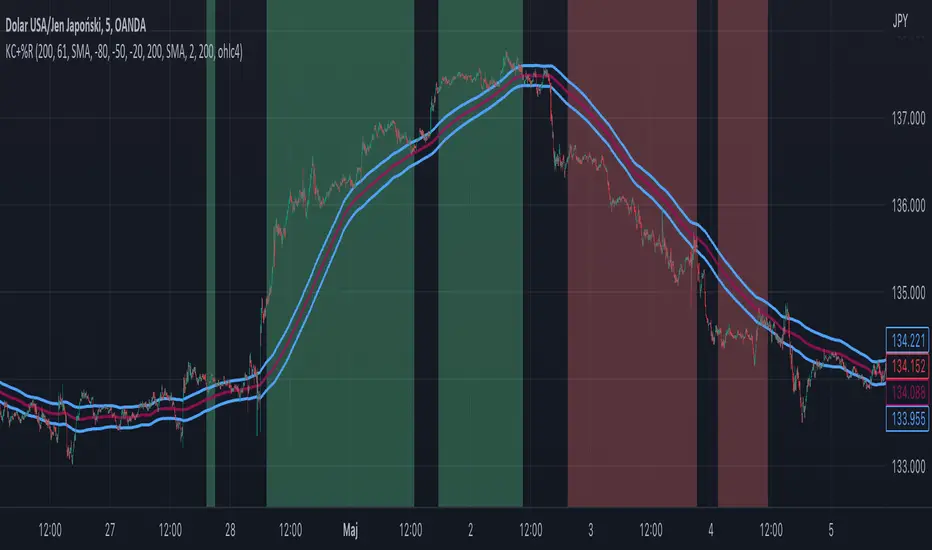
Normalized VolatilityOVERVIEW
The Normalized Volatility indicator is a technical indicator that gauges the amount of volatility currently present in the market, relative to the average volatility in the market. The purpose of this indicator is to filter out with-trend signals during ranging/non-trending/consolidating conditions.
CONCEPTS
This indicator assists traders in capitalizing on the assumption that trends are more likely to start during periods of high volatility compared to periods of low volatility. This is because high volatility indicates that there are bigger players currently in the market, which is necessary to begin a sustained trending move.
So, to determine whether the current volatility is "high", it is compared to an average volatility for however number of candles back the user specifies.
If the current volatility is greater than the average volatility, it is reasonable to assume we are in a high-volatility period. Thus, this is the ideal time to enter a trending trade due to the assumption that trends are more likely to start during these high-volatility periods.
HOW DO I READ THIS INDICATOR
When the column's color is red, don't take any trend trades since the current volatility is less than the average volatility experienced in the market.
When the column's color is green, take all valid with-trend trades since the current volatility is greater than the average volatility experienced in the market.
NLX Trading Bot Framework (+Trend Score & QQE)- Demo of my NLX Modular Trading Framework -
It includes all the common indicators and creates a positive or negative score, which can be used with my Modular Trading Framework and linked to an entry/exit indicator to filter out buy/sell signals if the trend is not favorable.
Combination of:
SuperTrend
VWAP Bands
Relative Strength Index ( RSI )
Commodity Channel Index ( CCI )
William Percent Range (WPR)
Directional Movement Index (DMI)
Elder Force Index ( EFI )
Momentum
Demarker
Parabolic SAR
- Getting Started -
1. Add this Trend Index to your Chart
2. Add one of my Indicator Modules to your Chart, such as the QQE++ Indicator
3. In the QQE Indicator Settings combine it with the Trend Index (and choose L1 Type)
4. Optional: Add the Noise Filter, and in the Noise Filter Settings you select the QQE Indicator as combination (and choose L2 for Type)
5. Add the Backtest Module to your Chart
6. Select the Noise Filter in the Backtest Settings
- Access -
Only as part of the NLX Framework - see my signature below for more info.
