PVSRA Volume Suite with Volume DeltaPVSRA Volume Suite with Volume Delta
🔹 Overview
This indicator is a Volume Suite that enhances PVSRA (Price, Volume, Support, Resistance Analysis) by incorporating Volume Delta and AI-driven predictive alerts. It is designed to help traders analyze volume pressure, market trends, and price movements with color-coded visualizations.
📌 Key Features
PVSRA Volume Color Coding – Highlights vector candles based on extreme volume/spread conditions.
Volume Delta Analysis – Tracks buying/selling pressure using up/down volume data.
AI-Powered Predictive Alerts – Identifies potential trend shifts based on volume and trend context.
Volatility-Adjusted Thresholds – Dynamically adapts volume conditions based on ATR (Average True Range).
Customizable MA & Symbol Overrides – Allows traders to tweak settings for personalized market insights.
Debug & Diagnostic Labels – Shows statistical z-scores, thresholds, and volume dynamics.
How It Works
PVSRA Color Coding – The script classifies candles into four categories based on volume and spread analysis:
🔴 Red Vector → Extreme bearish volume/spread
🟢 Green Vector → Extreme bullish volume/spread
🟣 Violet Vector → Above-average bearish volume
🔵 Blue Vector → Above-average bullish volume
Volume Delta Calculation – Uses lower timeframe volume analysis to estimate up/down volume differentials.
Trend & Predictive Alerts – Combines EMA crossovers with statistical volume analysis to detect potential trend shifts.
Volatility Adaptation – Adjusts volume thresholds based on ATR, making signals more reliable in changing market conditions.
Custom Symbol Override – Fetches PVSRA data from a different instrument, useful for index-based volume analysis.
Customizable Inputs
PVSRA Color Settings – Modify candle color schemes for better visual clarity.
Volume Delta Colors – Customize delta volume body, wick, and border colors.
AI Settings – Tune z-score thresholds, lookback periods, and enable predictive alerts.
Symbol Overrides – Analyze volume from a different market or asset.
Moving Average (MA) Settings – Display a volume-based moving average for trend confirmation.
Important Notes
Works best on intraday timeframes where volume data is reliable.
Lower timeframe volume delta estimates might not be precise for all assets.
No guarantees of accuracy – Use alongside other confluence tools for decision-making.
Credits & Open-Source Notice
This script is based on PVSRA methodologies and integrates Volume Delta analysis. Special thanks to Traders Reality and TradingView for their contributions to volume-based analysis.
Volumeindicator

Volume Width Based Candles
Overview
This indicator reimagines traditional candlestick charts by adjusting the horizontal width of each candle based on the bar’s trading volume. In other words, candles with higher volume appear wider, while those with lower volume are drawn narrower. This extra visual dimension can help traders quickly identify bars with significant volume relative to a defined lookback period.
Key Components
Volume Normalization:
The script calculates the highest volume over a user-defined lookback period (default is 100 bars).
Each bar’s volume is then normalized by dividing it by this maximum value. The result is a value between 0 and 1 that represents how the current volume compares to the maximum over the lookback.
Variable Candle Width Calculation:
A base multiplier (default set to 0.4) is used to control how much the volume influences the candle width.
The normalized volume is multiplied by this multiplier to compute an offset value.
Instead of using timestamps (which could lead to drawing objects too far into the future), the script uses the bar_index (the sequential index of bars) to determine the left and right positions of each candle.
The left and right x–positions are calculated by subtracting and adding the offset from the current bar index, respectively.
Candle Body & Wick Drawing:
Candle Body:
The body is drawn using box.new as a rectangle.
The top and bottom of the box are determined by the higher and lower values of the open and close prices.
The color of the candle is set based on whether the bar is bullish (green) or bearish (red).
Wicks:
The upper wick is drawn from the high of the bar down to the top of the body.
The lower wick is drawn from the low up to the bottom of the body.
These are created using line.new at the current bar index.
Handling Edge Cases:
The indicator includes conditions to avoid drawing errors on the very first bar (or any bar where prior data is unavailable).
It also converts the calculated x–coordinates (which are derived from the bar index plus a floating point offset) to integers since box.new requires integer values for positioning.
What It Tells the Trader
Volume Visualization:
Wider candles indicate bars where trading volume is high relative to recent history, potentially highlighting periods of increased market activity.
Narrower candles suggest lower volume, which can signal less interest or participation during that bar.
Contextual Price Action:
By integrating volume into the visual representation of each candle, traders get an immediate sense of the strength behind price movements.
This can be particularly useful for spotting potential breakouts, reversals, or confirming trends when analyzed alongside traditional price-based indicators.
Customization Options
Volume Lookback Period:
You can adjust the number of bars considered when determining the maximum volume. A shorter period may be more responsive to recent changes, while a longer period provides a broader context.
Base Width Multiplier:
Adjusting this multiplier changes how pronounced the effect of volume is on the candle’s width. Increasing it will make high-volume candles even wider, and decreasing it will reduce the difference between high and low volume candles.
Final Thoughts
This indicator is a creative way to overlay volume information directly onto the price chart without the need for separate volume bars. It provides an at-a-glance understanding of market activity and can be a valuable addition to a trader’s toolkit, especially for those who prefer visual cues integrated with price action. However, due to limitations (like the maximum number of drawn boxes), it’s best used on charts with a moderate amount of historical data or with appropriate adjustments to manage performance.

Liquidity Location Detector [BigBeluga]
This indicator helps traders identify potential liquidity zones by detecting significant volume levels at key highs and lows. By using color intensity and scoring numbers, it visually highlights areas where liquidity concentration may be highest while incorporating trend analysis through EMAs.
🔵Key Features:
Liquidity Zone Detection: Automatically detects and marks areas where significant volume has accumulated at swing highs and lows.
Dynamic Box Plotting: Draws liquidity boxes at key highs and lows, updating based on market conditions.
Volume Strength Scaling: Uses a scoring system to rank liquidity zones, helping traders identify the strongest areas.
Color Intensity for Volume Strength: More transperent color indicate less liquidity, while less transperent represent stronger volume concentrations.
Customizable Display: Users can adjust the number of displayed liquidity zones and modify colors to suit their trading style.
Real-Time Liquidity Adaptation: As price interacts with liquidity zones, the indicator updates dynamically to reflect changing market conditions.
Auto-Stopping Liquidity Zones: Liquidity boxes automatically stop extending to the right once price crosses them, preventing outdated zones from interfering with live market action.
Trend Analysis with EMAs: Includes two optional EMAs (fast and slow) to help traders analyze market trends. Users can enable or disable these EMAs in the settings and use crossover signals for trend confirmation.
🔵Usage:
Identify Key Liquidity Areas: Use color intensity and transparency levels to determine high-impact liquidity zones.
Support & Resistance Confirmation: Liquidity zones can act as potential support and resistance levels, enhancing trade decision-making.
Market Structure Analysis: Observe how price interacts with liquidity to anticipate breakout or reversal points.
Scalping & Swing Trading: Works for both short-term and long-term traders looking for liquidity-based trade setups.
Liquidation Map Insight: A liquidity map highlights areas where large amounts of leveraged positions (both long and short) are likely to get liquidated. Since many traders use leverage, sharp price movements can trigger a cascade of liquidations, leading to rapid price surges or drops. Monitoring these liquidity zones and trends helps traders anticipate where price might react strongly.
Liquidity Location Detector is an essential tool for traders seeking to map out potential liquidity zones, providing deeper insights into market structure and trading volume dynamics.

Synthetic OrderBookHow to Use the Enhanced Synthetic OrderBook Indicator
This indicator creates a synthetic representation of market order book data using price action, volume, and other technical factors. It's designed to help you identify significant market imbalances and potential price reversals, especially useful for crypto trading.
Overview
The Enhanced Synthetic OrderBook provides three different view modes, each offering unique insights into market conditions:
1. **Order Book View** - Shows simulated order book depth at different price levels
2. **Delta View** - Displays the imbalance between buying and selling pressure
3. **Liquidation View** - Highlights potential liquidation events that could drive price movements
How to Use Each View Mode
Order Book View
This view simulates what you would see in an exchange order book, showing bids (buy orders) in green and asks (sell orders) in orange/red.
**How to interpret:**
- **Green bars (bids)**: Represent buying interest at different price levels below the current price
- **Red bars (asks)**: Represent selling interest at different price levels above the current price
- **Bar height**: Taller bars indicate stronger buying/selling interest
- **Threshold lines**: The green line shows the bullish threshold, while the red line shows the bearish threshold
**Trading signals:**
- When green bars (bids) consistently exceed the bullish threshold, consider buying
- When red bars (asks) consistently exceed the bearish threshold, consider selling
- Look for imbalances where bids are significantly larger than asks (or vice versa)
Delta View
This view shows the difference between buying and selling pressure across different price ranges. It's more focused on the imbalance rather than raw order book depth.
**How to interpret:**
- **Green bars**: Positive delta (more buying than selling pressure)
- **Red bars**: Negative delta (more selling than buying pressure)
- **Threshold lines**: Indicate significant levels of imbalance
- **Zero line**: Neutral point between buying and selling pressure
**Trading signals:**
- When delta stays consistently above the bullish threshold, it suggests strong buying pressure
- When delta stays consistently below the bearish threshold, it suggests strong selling pressure
- Changes in direction of the delta can signal potential reversals
- When the bids/asks delta shallows
Liquidation View
This view estimates potential liquidation events in the market, which often lead to sharp price movements.
**How to interpret:**
- **Green bars**: Potential long liquidations (forced selling from leveraged long positions)
- **Red bars**: Potential short liquidations (forced buying from leveraged short positions)
- **Bar height**: Indicates the estimated severity of liquidations
**Trading signals:**
- Large liquidation events often lead to price continuation in that direction
- After a series of liquidations, the market may become exhausted, suggesting a potential reversal
- Short liquidations (red) tend to create faster upward price movements than long liquidations
Tips for Beginners
1. **Start with the Order Book view** to get a feel for buying and selling pressure
2. **Use the Delta view** for confirmation of trends and potential reversals
3. **Check the Liquidation view** when markets are volatile to anticipate sharp moves
4. **Watch for strong buy/sell signals** (green/red arrows) which suggest high-confidence trade opportunities
5. **Customize the threshold levels** in the settings to match the volatility of the asset you're trading
6. **Higher timeframes** (4H, daily) generally provide more reliable signals than lower timeframes
## Important Settings to Adjust
- **Order Book/Delta Thresholds**: Adjust these based on the asset's volatility (higher for more volatile assets)
- **Show Bids/Asks**: Toggle to focus on specific directions
- **Adaptive Threshold**: Enables the indicator to automatically adjust sensitivity based on market conditions
- **Volume Profile**: Uses historical volume distribution to improve accuracy
This indicator works best when combined with other confirmation tools like support/resistance levels, trend analysis, and traditional technical indicators.

WhaleTrackBITGET:BTCUSDT.P
WhaleTrack – Volume Heatmap to Uncover Institutional Trading Activity
Overview
WhaleTrack is a volume-based heatmap indicator designed to reveal areas of high institutional trading activity. The indicator helps traders identify hidden support and resistance levels, analyze trend sustainability, and optimize stop-loss placements by displaying where significant market participants (whales) have historically traded in large volumes.
Institutions and large traders often push price into areas of historical liquidity to trigger retail stop-losses and fill their own large orders at optimal prices. WhaleTrack visualizes these critical areas, allowing traders to anticipate future price movements based on past institutional behavior.
How WhaleTrack Works
WhaleTrack analyzes historical trading volume and calculates a normalized volume intensity relative to the moving average (SMA). This data is then mapped onto a heatmap that highlights key liquidity zones.
1. Volume Normalization & SMA-Based Calculation
The script calculates the ratio of current volume to its SMA-based average.
Zones with significantly high volume spikes are identified as key liquidity areas where large traders may have accumulated or distributed assets.
The volume is quantized into different levels, ranging from Low to Extreme, creating a clear heatmap gradient.
2. Why Do Whales Manipulate Liquidity?
Large traders (whales) need liquidity to execute their orders.
They push price into historical high-volume areas to trigger stop-losses and force retail traders into selling.
This behavior allows them to accumulate at lower prices or distribute at higher prices before a major move.
Whale zones often act as support/resistance because institutions tend to protect their previous accumulation or distribution levels.
3. Heatmap Color Model & Zone Classification
WhaleTrack assigns volume intensity levels based on historical market participation:
Low → Minimal volume, weak interest
Low-Mid → Slightly increased volume
Mid → Standard trading activity, no major anomalies
Mid-High → Significant increase in volume, possible whale activity
High → Strong liquidity pool, institutional interest
Extreme → Highly concentrated volume, key reversal area
By observing these zones, traders can determine whether a price level is likely to hold as support or resistance , or if a breakout has the strength to sustain.
Trading Applications of WhaleTrack
WhaleTrack can be used to identify trade setups based on liquidity behavior:
1. Identifying Hidden Reversal Points (Support & Resistance)
Large Whale Zones below price → Likely strong support.
Large Whale Zones above price → Likely strong resistance.
These zones often lead to reversals, as large traders defend their previous positions.
2. Evaluating Trend Sustainability
A strong uptrend should leave multiple high-volume zones behind.
If no new high-volume zones form, the trend may be unsustainable.
High volume clusters in trend direction? → Likely trend continuation.
3. Optimizing Stop-Loss Placement
Placing stops inside whale zones increases stop-out risk.
Setting stops below whale buy zones protects against premature liquidation.
Stops above whale sell zones help avoid fake breakouts.
Customization & Settings
WhaleTrack is designed with flexibility in mind, offering multiple customization options:
1. Layout & Color Models
WhaleTrack Default – optimized for whale volume tracking
Model 1 & Model 2 – alternative heatmap color schemes
Contrast Mode – high visibility
White-Black & Black-White – for different chart backgrounds
Custom 1 & Custom 2 – user-defined color configurations
2. Advanced Options
Draw Full Candle Boxes – display full candle height or a partial range
Legend Visibility & Positioning – control placement of the heatmap legend
Exponential Color Model – choose between logarithmic and linear volume representation
Max Transparency Settings – adjust visibility of older zones
Number of Heatmap Colors – set the gradient sensitivity
3. Data Optimization Settings
Lookback Period – define how many bars are analyzed for volume normalization
Max Box Display – limit the number of displayed volume zones
Data Saver Mode – increase range at the expense of detail
Minimum Volume Threshold – filter out insignificant volume clusters
Disclaimer
This indicator is for educational and informational purposes only. It does not provide financial advice or guarantee future performance. Trading is risky—conduct your own research before making any investment decisions.

Johnny's Machine Learning Moving Average (MLMA) w/ Trend Alerts📖 Overview
Johnny's Machine Learning Moving Average (MLMA) w/ Trend Alerts is a powerful adaptive moving average indicator designed to capture market trends dynamically. Unlike traditional moving averages (e.g., SMA, EMA, WMA), this indicator incorporates volatility-based trend detection, Bollinger Bands, ADX, and RSI, offering a comprehensive view of market conditions.
The MLMA is "machine learning-inspired" because it adapts dynamically to market conditions using ATR-based windowing and integrates multiple trend strength indicators (ADX, RSI, and volatility bands) to provide an intelligent moving average calculation that learns from recent price action rather than being static.
🛠 How It Works
1️⃣ Adaptive Moving Average Selection
The MLMA automatically selects one of four different moving averages:
📊 EMA (Exponential Moving Average) – Reacts quickly to price changes.
🔵 HMA (Hull Moving Average) – Smooth and fast, reducing lag.
🟡 WMA (Weighted Moving Average) – Gives recent prices more importance.
🔴 VWAP (Volume Weighted Average Price) – Accounts for volume impact.
The user can select which moving average type to use, making the indicator customizable based on their strategy.
2️⃣ Dynamic Trend Detection
ATR-Based Adaptive Window 📏
The Average True Range (ATR) determines the window size dynamically.
When volatility is high, the moving average window expands, making the MLMA more stable.
When volatility is low, the window shrinks, making the MLMA more responsive.
Trend Strength Filters 📊
ADX (Average Directional Index) > 25 → Indicates a strong trend.
RSI (Relative Strength Index) > 70 or < 30 → Identifies overbought/oversold conditions.
Price Position Relative to Upper/Lower Bands → Determines bullish vs. bearish momentum.
3️⃣ Volatility Bands & Dynamic Support/Resistance
Bollinger Bands (BB) 📉
Uses standard deviation-based bands around the MLMA to detect overbought and oversold zones.
Upper Band = Resistance, Lower Band = Support.
Helps traders identify breakout potential.
Adaptive Trend Bands 🔵🔴
The MLMA has built-in trend envelopes.
When price breaks the upper band, bullish momentum is confirmed.
When price breaks the lower band, bearish momentum is confirmed.
4️⃣ Visual Enhancements
Dynamic Gradient Fills 🌈
The trend strength (ADX-based) determines the gradient intensity.
Stronger trends = More vivid colors.
Weaker trends = Lighter colors.
Trend Reversal Arrows 🔄
🔼 Green Up Arrow: Bullish reversal signal.
🔽 Red Down Arrow: Bearish reversal signal.
Trend Table Overlay 🖥
Displays ADX, RSI, and Trend State dynamically on the chart.
📢 Trading Signals & How to Use It
1️⃣ Bullish Signals 📈
✅ Conditions for a Long (Buy) Trade:
The MLMA crosses above the lower band.
The ADX is above 25 (confirming trend strength).
RSI is above 55, indicating positive momentum.
Green trend reversal arrow appears (confirmation of a bullish reversal).
🔹 How to Trade It:
Enter a long trade when the MLMA turns bullish.
Set stop-loss below the lower Bollinger Band.
Target previous resistance levels or use the upper band as take-profit.
2️⃣ Bearish Signals 📉
✅ Conditions for a Short (Sell) Trade:
The MLMA crosses below the upper band.
The ADX is above 25 (confirming trend strength).
RSI is below 45, indicating bearish pressure.
Red trend reversal arrow appears (confirmation of a bearish reversal).
🔹 How to Trade It:
Enter a short trade when the MLMA turns bearish.
Set stop-loss above the upper Bollinger Band.
Target the lower band as take-profit.
💡 What Makes This a Machine Learning Moving Average?
📍 1️⃣ Adaptive & Self-Tuning
Unlike static moving averages that rely on fixed parameters, this MLMA automatically adjusts its sensitivity to market conditions using:
ATR-based dynamic windowing 📏 (Expands/contracts based on volatility).
Adaptive smoothing using EMA, HMA, WMA, or VWAP 📊.
Multi-indicator confirmation (ADX, RSI, Volatility Bands) 🏆.
📍 2️⃣ Intelligent Trend Confirmation
The MLMA "learns" from recent price movements instead of blindly following a fixed-length average.
It incorporates ADX & RSI trend filtering to reduce noise & false signals.
📍 3️⃣ Dynamic Color-Coding for Trend Strength
Strong trends trigger more vivid colors, mimicking confidence levels in machine learning models.
Weaker trends appear faded, suggesting uncertainty.
🎯 Why Use the MLMA?
✅ Pros
✔ Combines multiple trend indicators (MA, ADX, RSI, BB).
✔ Automatically adjusts to market conditions.
✔ Filters out weak trends, making it more reliable.
✔ Visually intuitive (gradient colors & reversal arrows).
✔ Works across all timeframes and assets.
⚠️ Cons
❌ Not a standalone strategy → Best used with volume confirmation or candlestick analysis.
❌ Can lag slightly in fast-moving markets (due to smoothing).

Order Blocks with Volume Heatmap & Clusters - VK TradingOrder Blocks with Volume Heatmap & Clusters - VK Trading
This script is designed to identify and highlight Order Blocks, a key concept in institutional trading, and combines it with powerful tools like volume heatmaps and accumulation clusters for enhanced market analysis. Suitable for traders of all experience levels, this script provides a clear and customizable visualization to help identify significant market zones effectively.
What Does This Script Do?
Order Block Identification: Highlights bullish and bearish order blocks directly on the chart, making it easier to spot key supply and demand zones.
Volume Heatmap: A dynamic heatmap adjusts colors based on relative volume, allowing you to quickly identify areas of heightened activity.
Institutional Accumulation Clusters: Zones of potential institutional accumulation are calculated using a combination of ATR (Average True Range), standardized volume, and RSI (Relative Strength Index).
Automatic Clearing: Invalidated order blocks are automatically removed, ensuring your charts remain clean and focused.
Key Features
Customizable Sensitivity: Adjust the script’s sensitivity to tailor order block detection to different market conditions and strategies.
Advanced Volume Display Options: Toggle volume visibility on or off. Customize the position, size, and color of volume labels for better integration with your chart's design.
Dynamic Heatmap Intensity: Fine-tune the heatmap’s intensity and color to highlight areas of interest based on trading volume.
Dual Order Block Detection: Uses two independent detection settings to analyze the market from multiple perspectives.
Visual Alerts: Automatically draws key level lines based on detected order blocks for better clarity.
User Benefits:
Clear Market Analysis: Helps pinpoint institutional activity and key levels with minimal effort.
Increased Efficiency: Automates plotting and analysis, allowing you to focus on decision-making.
Versatile Compatibility: Complements strategies like Smart Money Concepts, Wyckoff, and Price Action approaches.
Disclaimer
This script is intended as an analytical and educational tool. It does not guarantee specific outcomes or eliminate trading risks. Use this tool at your own discretion and always practice proper risk management.

Candles Volume HeatMap [BigBeluga]Candles Volume HeatMap
The Candle Volume HeatMap indicator is a unique and advanced tool that visualizes lower timeframe volume activity within higher timeframe candles, offering traders a granular perspective on volume distribution.
⚠️Important note: before using the indicator, it is necessary to apply it to the candles
🔵Key Features:
Volume HeatMap Visualization: The indicator breaks down each higher timeframe candle into 10 equal vertical segments (boxes) based on its high-to-low range. Each box represents a lower timeframe candle's volume activity, with more intense colors indicating stronger volume levels.
Lower Timeframe Integration: Automatically uses a timeframe 10x lower than the current chart. For example, on a 10-hour chart, it uses 1-hour candles to extract volume data.
POC (Point of Control): The highest volume box within each candle is marked with the volume value. The indicator also plots a horizontal POC line at the level of this box, highlighting significant areas of price interest. The POC line is removed once the price crosses it, ensuring the chart stays clean.
Delta Display (Optional): Traders can enable the Delta feature to analyze buyer vs. seller activity within each higher timeframe candle.
Delta is calculated by summing 10 lower timeframe candles: a bullish candle adds to buyers, while a bearish candle adds to sellers. Displays the net Delta percentage: positive values (white) indicate buyer dominance, while negative values (red) indicate seller dominance.
Dynamic Volume Scaling: The highest volume value in each candle is displayed inside its respective box, providing quick insights into critical price-volume levels.
🔵How It Works:
For each higher timeframe candle, the indicator analyzes 10 lower timeframe candles and maps their volume into 10 segments (boxes) between the high and low of the current candle.
The intensity of each box's color corresponds to the relative volume of the lower timeframe candle it represents.
The POC highlights the price level with the highest concentration of volume, aiding in identifying potential support/resistance zones.
Delta analysis offers additional insights into market sentiment by breaking down buyer and seller activity in each candle.
🔵Use Cases:
Spotting key volume areas within higher timeframe candles to identify support and resistance levels.
Analyzing volume concentration for potential breakout or reversal zones.
Leveraging Delta analysis to gauge market sentiment and confirm volume-based trends.
This indicator is ideal for traders seeking to combine volume analysis with price action, offering precise insights into volume distribution and market dynamics.

Directional Volume IndexDirectional Volume Index (DVI) (buying/selling pressure)
This index is adapted from the Directional Movement Index (DMI), but based on volume instead of price movements. The idea is to detect building directional volume indicating a growing amount of orders that will eventually cause the price to follow. (DVI is not displayed by default)
The rough algorithm for the Positive Directional Volume Index (green bar):
calculate the delta to the previous green bar's volume
if the delta is positive (growing buying pressure) add it to an SMA, else add 0 (also for red bars)
divide these average deltas by the average volume
the result is the Positive Directional Volume Index (DVI+) (vice versa for DVI-)
Differential Directional Volume Index (DDVI) (relative pressure)
Creating the difference of both Directional Volume Indexes (DVI+ - DVI-) creates the Differential Directional Volume Index (DDVI) with rising values indicating a growing buying pressure, falling values a growing selling pressure. (DDVI is displayed by default, smoothed by a custom moving average)
Average Directional Volume Index (ADVX) (pressure strength)
Putting the relative pressure (DDVI) in relation to the total pressure (DVI+ + DVI-) we can determine the strength and duration of the currently building volume change / trend. For the DMI/ADX usually 20 is an indicator for a strong trend, values above 50 suggesting exhaustion and approaching reversals. (ADVX is not displayed by default, smoothed by a custom moving average)
Divergences of the Differential Directional Volume Index (DDVI) (imbalances)
By detecting divergences we can detect situations where e.g. bullish volume starts to build while price is in a downtrend, suggesting that there is growing buying pressure indicating an imminent bullish pullback/order block or reversal. (strong and hidden divergences are displayed by default)
Divergences Overview:
strong bull: higher lows on volume, lower lows on price
medium bull: higher lows on volume, equal lows on price
weak bull: equal lows on volume, lower lows on price
hidden bull: lower lows on volume, higher lows on price
strong bear: lower highs on volume, higher highs on price
medium bear: lower highs on volume, equal highs on price
weak bear: equal highs on volume, higher highs on price
hidden bear: higher highs on volume, lower highs on price
DDVI Bands (dynamic overbought/oversold levels)
Using Bollinger Bands with DDVI as source we receive an averaged relative pressure with stdev band offsets. This can be used as dynamic overbought/oversold levels indicating reversals on sharp crossovers.
Alerts
As of now there are no alerts built in, but all internal data is exposed via plot and plotshape functions, so it can be used for custom crossover conditions in the alert dialog. This is still a personal research project, so if you find good setups, please let me know.

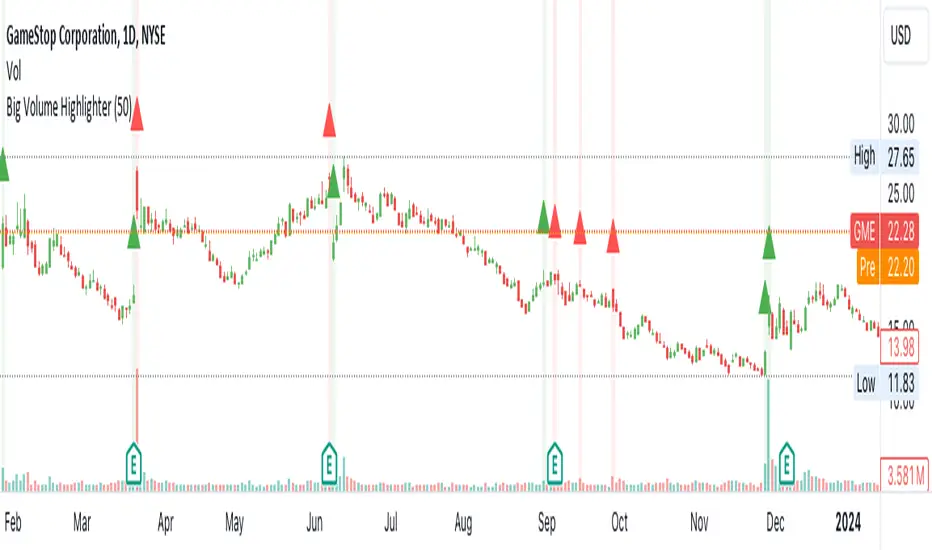
Weekly Bottom Finder 1.0A Tool for Identifying Market Bottoms
The Weekly Bottom Finder indicator is designed for in-depth market analysis on weekly timeframes. Utilizing innovative methodology, it allows traders to identify potential zones of market bottoms, which often mark the beginning of new bullish trends. This indicator combines multiple advanced algorithms working in unison to deliver accurate and reliable signals.
What Makes Weekly Bottom Finder Unique?
Comprehensive Approach
The indicator integrates several analytical techniques, including:
Volume Analysis: Evaluates market activity to highlight significant interest.
Money Flow Index (MFI): Detects overbought and oversold zones.
ATR (Average True Range): Accounts for market volatility.
Advanced Internal Algorithms: Measures trend strength and consistency.
Accurate Bottom Detection
Signals are only generated when all conditions confirm a potential market bottom. This minimizes false signals that are common with many other indicators.
Visualization
Potential market bottom zones are displayed as light green vertical lines, making signals easy to identify without cluttering the chart.
Adaptability
Weekly Bottom Finder automatically adjusts to market conditions, considering volume, volatility, and market dynamics, making it a versatile tool for different markets and scenarios.
Key Features
Parameter Synchronization
The indicator uses finely tuned thresholds for trend analysis, effectively filtering out short-term market noise.
Balanced Settings
Users can adjust the "Bottom Sensitivity" parameter to customize the indicator to their needs, providing either more or fewer signals based on their trading strategy.
Weekly Timeframe
Specifically designed for long-term analysis on weekly candles, the indicator performs effectively across various markets, including cryptocurrencies like Bitcoin, traditional stock markets, and forex trading. It's worth testing the indicator's performance on different exchanges for the same cryptocurrency. Price movements can vary slightly between exchanges, resulting in a different number of signals.
Volume Filters
An additional volume filter ensures that signals are generated only in zones where the market exhibits genuine participant interest.
How Does Weekly Bottom Finder Work?
Calculating Bottom Zones
The indicator identifies potential bottoms when prices are in oversold zones (low MFI) and the market shows high volume, indicating buyer interest.
Double Signal Verification
Each signal is filtered through a system of rules, including ATR and volume analysis, to avoid false positives.
Additional Information
Weekly Bottom Finder helps traders pinpoint key moments when the market may be reaching its lowest points, creating potential entry opportunities. However, it does not provide guarantees and serves only as a supplementary tool for deeper market understanding.
Please Note: Weekly Bottom Finder is an analytical tool that should be used alongside your own research and risk management strategies.

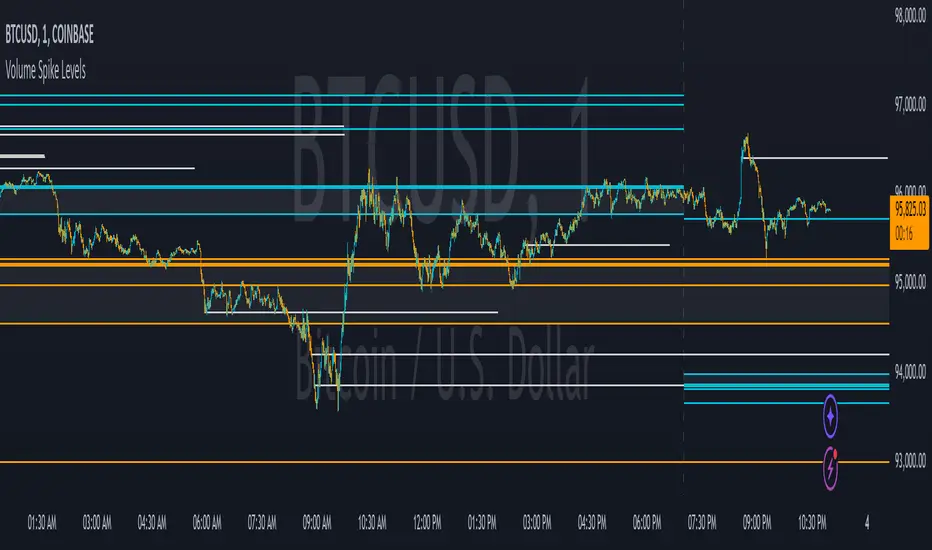
Volume Spike LevelsThis trading indicator finds specific high volume patterns that we have found to be the most likely to act as strong support and resistance levels and plots them on the chart. Using those high probability levels, the indicator will show lines in real time, as well as lines and important zones at the beginning of higher time frames to give you specific levels and areas where price is likely to react.
The most important volume zone for each time frame will have a color fill between the top and bottom lines of that high probability zone so you know to pay extra close attention to that area and look for price reactions there. If you can be patient enough to wait for price to hit these important areas and start to reverse, you will get great entries and help keep yourself from overtrading.
The levels shown can be adjusted to suit your preference, allowing you to get the right amount of levels for your trading strategy, whether that be scalping the 1 minute chart or long term investing via the daily chart.
HOW TO USE
For best results with this indicator, look for 2 types of setups. The first setup is a continuation bounce. You should be looking for these when price has broken out of its recent trading range either to the upside or the downside. When price is extending like this, look to take entries once a volume spike level shows up on the chart and price retraces back to that level. Then take your entry in the same direction as the trend. You can scalp quick wins this way, or you can wait for the next volume spike level to show up and price can’t hold that level any more, then get out. Place your stop loss just beyond the pivot that bounced off of the volume level.
The second type of setup you should look for is a reversal setup. This setup should be used when the market is ranging. Look for the top and bottom of the recent range and find the volume spike levels near the top or bottom of that range and wait for price to reach those levels. Once price hits that level and starts to show a reversal in price, take your entry. You can take quick scalps from those reversals for quick wins, or you can wait for price to reach the next major volume spike level and get out there or just before it. Place your stop loss just beyond the pivot that price made at the volume spike level where you entered your trade.
No matter which setup you are trading, it is never a bad idea to trail your stop loss as price moves towards your take profit level. Whatever volume spike timeframes you are using for your overall trend, you can use a lower time frame volume spike level to give you price points to trail your stop loss to there once price gets supportive at those levels and moves past them.
You should also pay close attention to how price reacts to the important volume zones shown. Many times, price will range inside or near these zones for a while and then form an accumulation just above or below that zone. When this happens, it is likely that price will start to move quickly in the direction that price moved away from that important zone. So when you see the price range inside of these zones and then go just beyond the zone on either side and accumulate, look to trade that breakout of the zone in the same direction that it moved away from the zone.
Note that on lower time frame charts, you will not be able to get some higher time frame levels because Tradingview limits the number of historical bars it can calculate on. So if you are on the 1-5 minute chart, you won’t be able to get yearly or quarterly levels late in the year/quarter due to the number of bars it has to calculate for those levels to populate is beyond the number of allowed bars. You can work around this by manually going to the daily chart and getting the yearly levels and drawing a horizontal line on your chart at the levels shown so that you still have those levels on your lower time frame charts. Unfortunately there is no way for us to work around this with code.
Each setting in the settings panel has a tooltip that will explain that specific setting so you understand how to use it. Just hover your mouse over the “i” icon and it will show a popup with the info. For the non-real time levels, the daily level settings will have the tooltips explaining everything and that info applies to all of the non-real time levels.
MODES
The indicator has two different modes you can use that will affect how the real time levels show up on your chart but will not affect the higher time frame levels. The default mode will give you static horizontal lines only. This means that when a high probability volume spike level comes in, a horizontal line will be drawn and will extend as long as the timeframe that the level is set to. For example a 60 minute volume spike time frame will extend the line for 60 minutes on the chart and then end. These lines will be drawn individually and will not update.
The second mode will give you variable lines and will show a color fill based on where price is in relation to all of the real time levels that are turned on. So if the price is above a level, it will color the background green and if the price is below a level, it will color the background red. This helps identify the trend of price compared to where the high probability volume spike levels came in so you can trade in the direction of the trend. With this mode, the lines for each time frame will update to the new level when a new volume spike for that time frame happens.
ALERTS
The indicator has alerts programmed for each different type of volume spike level that is available to add to your chart. So you can set an alert for when a new volume spike happens on any of the real time volume spike time frames, when price crosses the most recent real time volume spike level for each time frame, alert when any real time volume spike happens, alert when price crosses any of the higher time frame volume levels and also when price has crossed the upper or lower level of any of the important volume zones. Each alert is labeled the same as in the indicator settings so you can easily select which one you want.
For alerts to work properly, you have to have the levels turned on for whatever alerts you use. For example if you want an alert for Realtime 2 Volume Spikes, the Realtime 2 Volume Spike Levels must be turned on and shown on your chart.
Note that when using the alerts for price crossing a level, it will only alert when price crosses the most recent volume spike level. It will not alert when price crosses a previous level of the same time frame.
CUSTOMIZATION
You can customize nearly every feature of this indicator to tailor it to your specific trading style. Some of the customizable features are as follows: turn on or off labels for each time frame, turn on or off the color fills for important volume zones for each time frame, turn on or off the levels for each time frame, adjust the number of previous levels shown for each time frame, change the length of the lines for each time frame, extend the lines right for each time frame, change the color of the lines for each time frame, adjust the color fill colors for important volume zones, adjust the label colors and adjust the label offset length.
We also included some master settings to allow you to control various settings across all time frames with one click. These settings are as follows: turn on or off all labels, turn on or off all realtime levels, remove all lines except the most important volume zone on every time frame, turn on or off all color fills of important zones, adjust the background color fill of the trend coloring when set to variable lines and adjust the background color of all important zones.
There is also a feature that may need to be adjusted when you are looking at charts that do not have a lot of historical data. It will say the index is out of bounds, so look at the index number that the error shows by hovering over the red exclamation point next to the indicator name and adjust the setting labeled “Bar Index Threshold To Fix Errors” to a number that is slightly higher than the index number in the error message. This will fix the error by changing the calculations slightly to adjust for the bar indexes of that specific chart.
MARKETS IT CAN BE USED ON
This indicator can be used on any market that has volume data, including stocks, crypto, futures, forex and more.
TIME FRAMES IT CAN BE USED ON
This indicator has been programmed to work on the following time frames: 15 seconds, 30 seconds, 1 minute, 2 minute, 3 minute, 4 minute, 5 minute, 10 minute, 15 minute, 30 minute, 45 minute, 1 hour, 2 hour, 3 hour, 4 hour, 6 hour, 8 hour, 12 hour, 1 day, 2 day, 3 day, 1 week, 2 week, 1 month, 3 month and 1 year.
If you use a different time frame than shown above, you may get errors or irregular results, so please stick to the time frames that the trading indicator has been programmed to work correctly with.
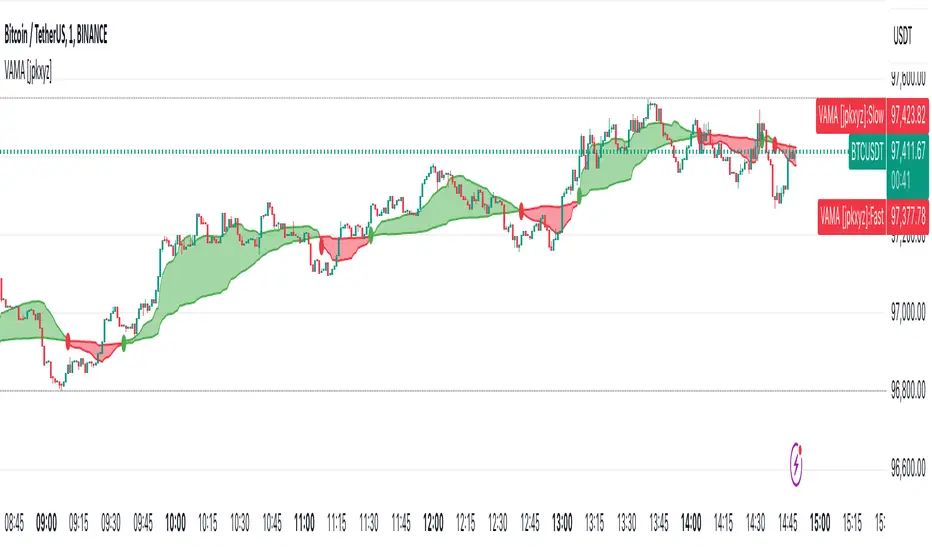
VAMA - Volume Adjusted Moving Average [jpkxyz]VAMA is a moving average that adapts to volume, giving more weight to price movements backed by higher relative volume. This VAMA (Volume Adjusted Moving Average) indicator implementation emphasizes visual clarity. It is based on the VAMA script by @allanster
Dual VAMA lines (Fast/Slow) with dynamic coloring:
Single-color scheme switches between green (bullish) and red (bearish)
Color changes on crossovers rather than relative position
Configurable line widths (set to 1 for clean appearance)
Visual enhancements:
Optional fill between VAMA lines (50% transparency)
Crossover dots can be toggled
Fills and dots match the current trend color
Customization parameters:
Independent source inputs for Fast/Slow lines
Adjustable VI Factor (volume influence)
Sample size control
Strict/non-strict calculation toggle
The code maintains efficient computation while prioritizing visual feedback for trend changes. It's designed for clear signal identification without visual clutter.
Notable style choices:
Consistent color theming throughout all visual elements
Simplified color transitions (only at crossovers)
Subtle transparency for fill areas
Minimal dot size for crossover markers
VAMA (Volume Adjusted Moving Average) Technical Analysis:
Core Calculation:
1. Volume Influence (v2i):
v2i = volume / ((total_volume/total_periods) * volume_factor)
- total_volume: Sum of volume over sample period
- total_periods: Either full history (nvb=0) or specified sample size
- volume_factor: Controls sensitivity to volume deviation
2. Price Weighting:
weighted_price = source_price * v2i
3. Accumulation Process:
- Iterates through length*10 periods
- Accumulates weighted prices and volume influence values
- Continues until volume influence sum >= specified length or strict rule triggers
4. Final VAMA Value:
vama = (weighted_sum - (volume_sum - length) * last_price) / length
Parameters:
- SampleN: Historical reference length (0=full history)
- Length: Base period for calculation
- VI Factor: Volume influence multiplier (>0.01)
- Strict: Forces exact length period completion when true
- Source: Input price data
Effective Volume (ADV) v3Effective Volume (ADV) v3: Enhanced Accumulation/Distribution Analysis Tool
This indicator is an updated version of the original script by cI8DH, now upgraded to Pine Script v5 with added functionality, including the Volume Multiple feature. The tool is designed for analyzing Accumulation/Distribution (A/D) volume, referred to here as "Effective Volume," which represents the volume impact in alignment with price direction, providing insights into bullish or bearish trends through volume.
Accumulation/Distribution Volume Analysis : The script calculates and visualizes Effective Volume (ADV), helping traders assess volume strength in relation to price action. By factoring in bullish or bearish alignment, Effective Volume highlights points where volume strongly supports price movements.
Volume Multiple Feature for Volume Multiplication : The Volume Multiple setting (default value 2) allows you to set a multiplier to identify bars where Effective Volume exceeds the previous bar’s volume by a specified factor. This feature aids in pinpointing significant shifts in volume intensity, often associated with potential trend changes.
Customizable Aggregation Types : Users can choose from three volume aggregation types:
Simple - Standard SMA (Simple Moving Average) for averaging Effective Volume
Smoothed - RMA (Recursive Moving Average) for a less volatile, smoother line
Cumulative - Accumulated Effective Volume for ongoing trend analysis
Volume Divisor : The “Divide Vol by” setting (default 1 million) scales down the Effective Volume value for easier readability. This allows Effective Volume data to be aligned with the scale of the price chart.
Visualization Elements
Effective Volume Columns : The Effective Volume bar plot changes color based on volume direction:
Green Bars : Bullish Effective Volume (volume aligns with price movement upwards)
Red Bars : Bearish Effective Volume (volume aligns with price movement downwards)
Moving Average Lines :
Volume Moving Average - A gray line representing the moving average of total volume.
A/D Moving Average - A blue line showing the moving average of Accumulation/Distribution (A/D) Effective Volume.
High ADV Indicator : A “^” symbol appears on bars where the Effective Volume meets or exceeds the Volume Multiple threshold, highlighting bars with significant volume increase.
How to Use
Analyze Accumulation/Distribution Trends : Use Effective Volume to observe if bullish or bearish volume aligns with price direction, offering insights into the strength and sustainability of trends.
Identify Volume Multipliers with Volume Multiple : Adjust Volume Multiple to track when Effective Volume has notably increased, signaling potential shifts or strengthening trends.
Adjust Volume Display : Use the volume divisor setting to scale Effective Volume for clarity, especially when viewing alongside price data on higher timeframes.
With customizable parameters, this script provides a flexible, enhanced perspective on Effective Volume for traders analyzing volume-based trends and reversals.

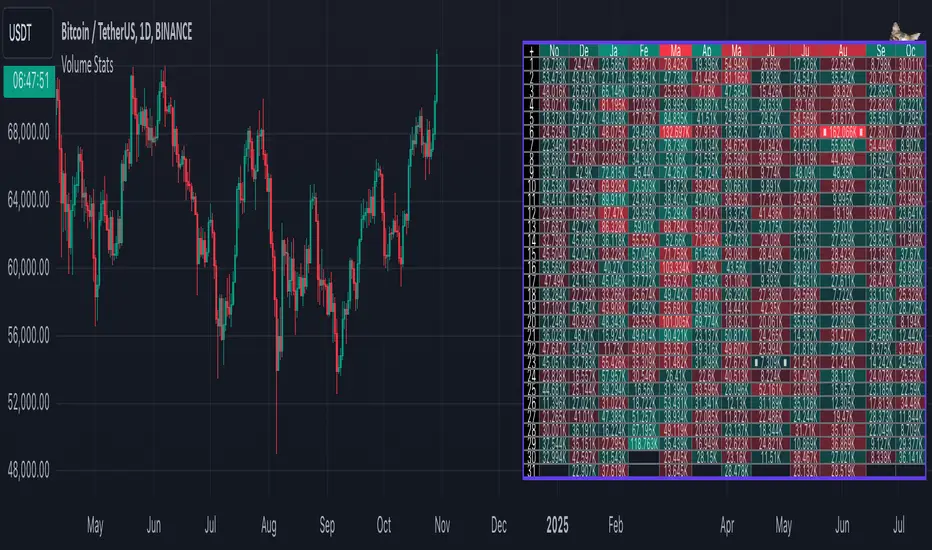
Volume StatsDescription:
Volume Stats displays volume data and statistics for every day of the year, and is designed to work on "1D" timeframe. The data is displayed in a table with columns being months of the year, and rows being days of each month. By default, latest data is displayed, but you have an option to switch to data of the previous year as well.
The statistics displayed for each day is:
- volume
- % of total yearly volume
- % of total monthly volume
The statistics displayed for each column (month) is:
- monthly volume
- % of total yearly volume
- sentiment (was there more bullish or bearish volume?)
- min volume (on which day of the month was the min volume)
- max volume (on which day of the month was the max volume)
The cells change their colors depending on whether the volume is bullish or bearish, and what % of total volume the current cell has (either yearly or monthly). The header cells also change their color (based either on sentiment or what % of yearly volume the current month has).
This is the first (and free) version of the indicator, and I'm planning to create a "PRO" version of this indicator in future.
Parameters:
- Timezone
- Cell data -> which data to display in the cells (no data, volume or percentage)
- Highlight min and max volume -> if checked, cells with min and max volume (either monthly or yearly) will be highlighted with a dot or letter (depending on the "Cell data" input)
- Cell stats mode -> which data to use for color and % calculation (All data = yearly, Column = monthly)
- Display data from previous year -> if checked, the data from previous year will be used
- Header color is calculated from -> either sentiment or % of the yearly volume
- Reverse theme -> the table colors are automatically changed based on the "Dark mode" of Tradingview, this checkbox reverses the logic (so that darker colors will be used when "Dark mode" is off, and lighter colors when it's on)
- Hide logo -> hides the cat logo (PLEASE DO NOT HIDE THE CAT)
Conclusion:
Let me know what you think of the indicator. As I said, I'm planning to make a PRO version with more features, for which I already have some ideas, but if you have any suggestions, please let me know.
Volume-Adjusted Schaff Trend Cycle (VASTC)Volume-Adjusted Schaff Trend Cycle (VASTC)
The VASTC is a fairly fast-moving oscillator designed to identify trends early and signal when trends may be nearing their end. While it can be used for both trend-following and mean-reversion strategies , it shines in trend-following setups. It’s particularly useful for catching the start of a trend and giving early warnings that a trend might end soon, making it a valuable addition to a multi-indicator system.
How It Works:
The VASTC adapts the traditional Schaff Trend Cycle by adjusting the MACD component with volume data. This volume-adjusted MACD is run through two stochastic processes , applying exponential smoothing to enhance responsiveness. Volume sensitivity allows the VASTC to adapt dynamically to periods of high or low trading activity, providing more reliable trend signals.
Recommended Use:
Use VASTC in confluence with other indicators to confirm trend entries and exits. It’s best for identifying early trend setups rather than sustaining prolonged trend trades. When used alongside other indicators, especially those with a longer-term outlook or momentum based trend indicators, you’ll gain a clearer signal for potential exits or entries. Always backtest the VASTC on your chosen assets to determine the most effective input parameters, as the defaults may not suit all markets or assets. Different assets behave differently, and adjustments in parameters can improve its ability to analyze the assets you're looking at.
Parameters:
Length : Sets the primary smoothing length.
Fast/Slow Length : Adjust the speed of the volume-adjusted MACD component.
Factor : Controls the final smoothing applied to the STC.
Overbought/Oversold Levels : Defines overbought/oversold levels.
Experiment with these settings to customize the VASTC to your trading strategy and asset.
Disclaimer : This indicator is a tool to complement your trading analysis and should not be used in isolation. Always backtest and use other confluence signals for best results. The assets I looked at when making this indicator are almost certainly different than what you're looking at.

FuTech V-Spike & V-HighlighterFuTech V-Spike & V-Highlighter
In the context of trading and technical analysis, this volume spike & volume highlighter indicator is the perfect indicator used to assess market activity and make informed trading decisions.
Let's Understand in brief as below :
1) Volume Spike :
A volume spike refers to a sudden, significant increase in trading volume compared to the average volume over a specific period.
This spike can indicate heightened interest in a particular security, often preceding price movements.
Traders may look for volume spikes as signals for potential buy or sell opportunities because they can suggest that a stock is experiencing increased activity, possibly due to news, earnings releases, or other catalysts.
Characteristics of a Volume Spike:
Assess the sudden increase in trading volume.
It Can occur in both upward and downward price movements.
Often compared to the average volume over a defined period (e.g., the last 20 days).
2) Volume Highlighter:
A volume highlighter emphasizes significant changes in trading volume on a price chart. This indicator typically uses color coding to highlight periods of high volume, making it easier for traders to identify volume spikes at a glance.
How this indicator works:
a) Volume Spike will calculate the highest volume spike as per the user defined threshold multiplier. (Multiplier = when volume exceeds a certain threshold)
b) The threshold Multiplier can be set based on a fixed number or as a multiple of the Exponential Moving Average volume. Volume Spike Multiplier default is 1.5, means the EMA volume should cross 1.5 times the user defined lookback period
c) The result is derived from the user defined lookback candles by using its EMA instead of SMA, which will give us more precise results.
d) By default, last 10 candles EMA average is used to calculate the Volume Spike but you can choose your lookback period as many days, weeks, months, years of your choice !
e) In Volume Spike -
- Green candle will show Yellow color Bar as Bullish sentiments, whereas
- Red candle will show Black Bar as Bearish sentiments.
f) Volume Highlighter will highlight the candles background if the highest volume is crossing as per the the user defined lookback period
g) Default Lookback period is 20, Color coding (e.g., Blue for bullish spikes, Red for bearish spikes) helps traders quickly assess the volume context.
h) Volume Highlighter plotting shapes and positions can be modified
Illustration:
From the Above pic,
If last Volume Spike is 10 lookback candles, Spike multiplier is 1.5 and Highlighter lookback candles is 20,
Then yellow candle means the spike in volume which is 1.5 times higher than the last 10 candles
Highlighting color defines the highest volumes trading from the last 20 candles which is either Blue (Bullish) or Red (Bearish) sentiments
Conclusion :
Using FuTech V-Spike & V-Highlighter indicator - will help traders identify potential trading opportunities and better understand market dynamics.
By analyzing volume in conjunction with price movements, traders can make more informed decisions based on market sentiment.
Thank you !
Jai Swaminarayan Dasna Das !
He Hari ! Bas Ek Tu Raji Tha !

Volume to Shares Outstanding Ratio IndicatorDescription:
This indicator shows the ratio of trading volume to the total number of shares outstanding.
Formula:
Volume to Shares Outstanding Ratio = (Trading Volume / Shares Outstanding) * 100
説明:
このインジケーターは、出来高を発行済株式数で割った比率を表示します。
式:
出来高の割合 = (出来高 / 発行済株式数) × 100

Atareum Volume Ichimuku CandleAVIC (Atareum Volume Ichimoku Candles) is clearly an awesome indicator that is based on Ichimoku concepts by combination with volume. This is a new approach of volume candles that is combined with Ichimoku concepts and creates such a powerful tool to trace the market and assists traders to make better decisions, truly.
Concept:
Using Ichimoku leading periods and calculations on redesigning new candles in combination with volume, that makes unique reform candles on Tenkansen movement, but these new candles clearly omit noises in combination with volume, and then the new redesigned system of cloud calculations builds, new series of data for Senko Span A and Senko Span B which is so odd in first view, because they will barely ever cross each other, but they show very more informative and useful.
Parameters:
Section 1 : Candle colour setting for flourishing just as you desire !
Section 2 : Defining Periods of standard Ichimoku and source of candle data in combination with determining the smoothing type of moving averages and signal period.
Section 3 : Select using Heikin Ashi based candles alongside with redesigned cloud calculation type and three additional moving averages which can plot on each newly generated candles and standard candles on a chart with the type mode defined in the previous section.
Note: if you want to omit any or all of these moving averages, you can use 0 in period, instead of selecting "None" in the plot moving option!
Usage :
Overall:
Regardless of the additional moving averages which will lead to so many situations of market according to their types and designs, that is four different period for new redesign AVIC and three period for standard chart. You can easily select periods and type for these moving averages. Also, do not forget that signal moving averages is shown only on AVIC chart and have two different colour for upward and downward trends. Other moving averages are plot by just one single colour.
Cloud levels are so important because AVIC candles show respect to them and when they break the clouds upward or downward it's surly beginning of a trend that is may last long. Also when cloud levels flatten, it is determining a support or resistance according to up cloud or down cloud nature and as long as they will continue or repeated periodically on same level of AVIC chart, it will implement their weakness or strength.
Support and Resistance:
Any flattens of cloud up or down level means the support or resistance level due to its nature, but important thing is how long the cloud lasts flatten or how many times repeated in the same level in AVIC chart.
For plotting the support or resistance you should trace first candle of start of flattens in standard chart just like following picture.
Divergence:
All Higher high or Lower low of standard chart has its reflect in AVIC chart but there is secret in it, It is named divergence. When standard chart price candles generating lower low but the AVIC chart candles do not cross the bottom, it means we will spike high as soon as AVIC candle chart complete its divergence. You can see perfect example in following picture.
Cloud level Ends
When cloud down level become flattens and cloud up level start a bull run it means we will face a great up trend movement but as soon as cloud down level starts to move up it mean we are going to finish the bull run and maybe it goes with consolidation phase or reversal phase. This reaction is exactly happen in vice versa for bear run trend. You can see both examples in following pictures.
Note: if we face end of bull run and cloud down level make a U turn shape upside down it means we will have reversal phase even not too long but it is sharp and fast reversal. If cloud down level just turn right slightly, it means we should have consolidation phase, mostly or we can continue the last trend slightly. All these situations can happen in vice versa bear run. You can see example in following picture.
Signals:
Long but risky:
You can go long when AVIC candles are green and be in position as long as they are not change in colour.
Long and safe :
You can go long when AVIC candles cross up cloud down level and be in position as long as AVIC candles cross down cloud up level.
Long and sure:
You can go long when AVIC candles cross up cloud up level and be in position as long as AVIC candles cross down cloud down level.
Short but risky:
You can go short when AVIC candles are red and be in position as long as they are not change in colour.
Short and safe :
You can go short when AVIC candles cross down cloud up level and be in position as long as AVIC candles cross up cloud down level.
Short and sure:
You can go short when AVIC candles cross down cloud down level and be in position as long as AVIC candles cross up cloud up level.
Notice : Candles with large body are so strong but if a body candle is weak or flatten it may a signal of changing colour and direction, especially when using Heikin Ashi type.
It is the result of many years of experience in markets and there are so many details about this AVIC chart which I am in the experiment phase to publish in the future, so please help me with your ideas and do not hesitate to comment and inform me any suggestions or criticism.

Big Volumes HighlighterBig Volumes Highlighter
Overview:
The "Big Volume Highlighter" is a powerful tool designed to help traders quickly identify candles with the highest trading volume over a specified period. This indicator not only highlights the most significant volume candles but also color-codes them based on the candle's direction—green for bullish (close > open) and red for bearish (close < open). Whether you're analyzing volume spikes or looking for key moments in price action, this indicator provides clear visual cues to enhance your trading decisions.
Features:
Customizable Lookback Period: Define the number of candles to consider when determining the highest volume.
Automatic Color Coding: Candles with the highest volume are highlighted in green if bullish and red if bearish.
Visual Clarity: The indicator marks the significant volume candles with a triangle above the bar and changes the background color to match, making it easy to spot important volume events at a glance.
Use Cases:
Volume Spike Detection:
Quickly identify when a large volume enters the market, which may indicate significant buying or selling pressure.
Trend Confirmation: Use volume spikes to confirm trends or potential reversals by observing the direction of the high-volume candles.
Market Sentiment Analysis: Understand market sentiment by analyzing the direction of the candles with the biggest volumes.
How to Use:
Add the "Big Volume Highlighter" to your chart.
Adjust the lookback period to suit your analysis.
Observe the highlighted candles for insights into market dynamics.
This script is ideal for traders who want to incorporate volume analysis into their technical strategy, providing a simple yet effective way to monitor significant volume changes in the market.
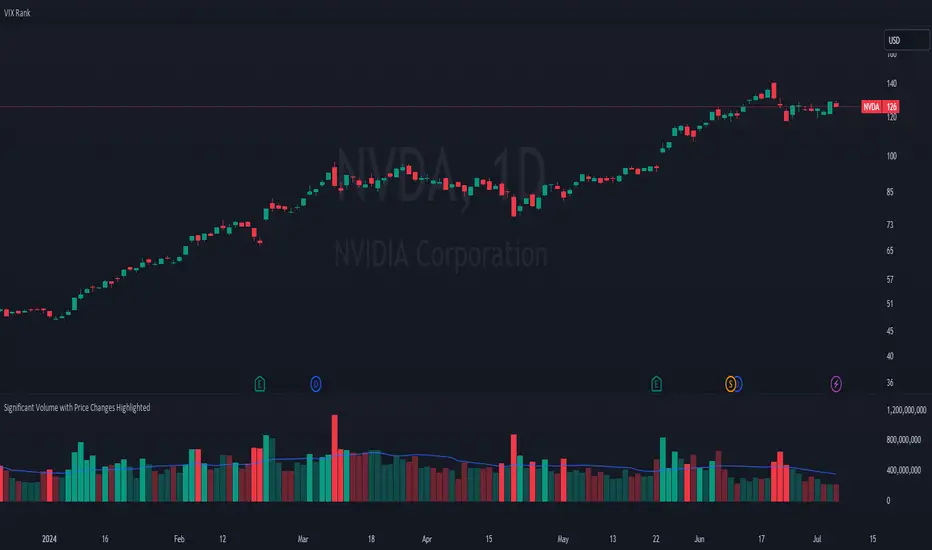
Significant Volume with Price Changes HighlightedSignificant Volume with Price Changes Highlighted
The "Significant Volume with Price Changes Highlighted" indicator by PappyTrading is a powerful tool designed to help traders identify significant volume spikes and price changes in the market. This indicator overlays the volume bars on the price chart and highlights them based on specific volume and price change conditions, providing a clear visual representation of market activity.
What It Does
This indicator calculates the moving average of the volume over a specified period and compares the current volume to this average. It also calculates the daily percentage change relative to the previous day's close and compares this to its moving average. The volume bars are then color-coded based on the following conditions:
Bright Green (#089981): Indicates a significant volume spike with an above-average price increase.
Bright Red (#f23645): Indicates a significant volume spike with an above-average price decrease.
Green with 60% transparency: Indicates a normal up day with a price increase but not a significant volume spike.
Red with 60% transparency: Indicates a normal down day with a price decrease but not a significant volume spike.
Additionally, the indicator plots a 20-period simple moving average (SMA) of the volume, providing a reference point to understand the general volume trend.
How It Works
Volume Calculation:
The indicator calculates the 20-period SMA of the volume and compares the current volume to this average to determine if there is a significant volume spike.
Price Change Calculation:
The indicator calculates the daily percentage change in price relative to the previous day's close and compares this to the 20-period SMA of the percentage change to identify significant price movements.
Color Coding:
The volume bars are color-coded based on the combination of the volume and price change conditions. This visual representation allows traders to quickly identify significant market activities.
How to Use It
Overlay on Chart:
Add the "Significant Volume with Price Changes Highlighted" indicator to your chart. The volume bars will be displayed at the bottom of the chart, color-coded based on the conditions described above.
Identify Market Activity:
Use the color-coded volume bars to identify significant market activities. Bright green bars indicate strong buying pressure, while bright red bars indicate strong selling pressure. Transparent green and red bars indicate normal market activity without significant volume spikes.
Volume Moving Average:
The blue line represents the 20-period SMA of the volume. Use this as a reference to understand the general volume trend and identify deviations from the average.
Concepts Underlying the Calculations
Volume Spikes: Significant volume spikes often precede or accompany major market moves. By highlighting these spikes, traders can gain insights into potential market turning points or continuation patterns.
Price Changes: Large price changes relative to the previous day's close indicate strong market momentum. By comparing these changes to their moving average, the indicator helps traders identify unusually strong buying or selling pressure.
This indicator is ideal for traders who want to gain a deeper understanding of market dynamics by analyzing volume and price changes together. It is suitable for various trading styles, including trend following, swing trading, and scalping.
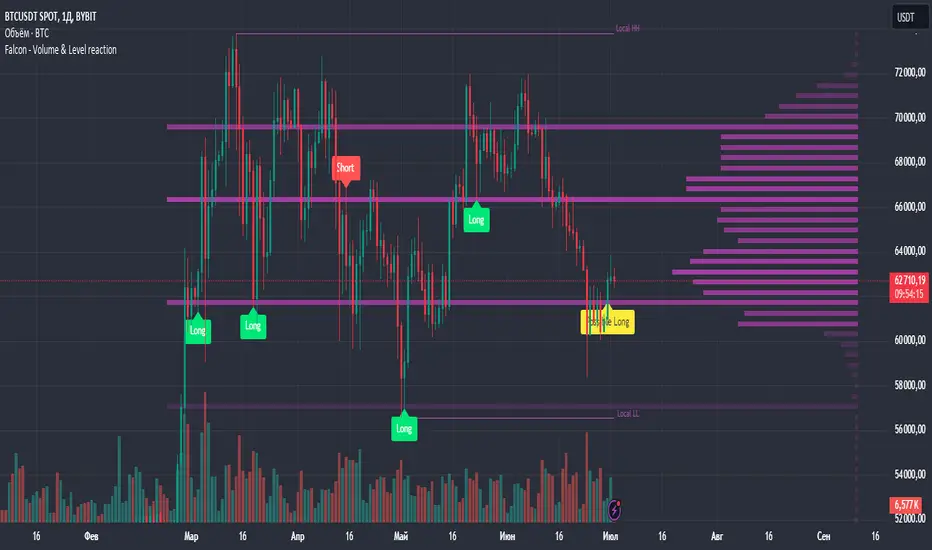
Falcon - Volume & Level reaction Falcon - Volume & Level Reaction
Our indicator, Falcon - Volume & Level Reaction, is designed to provide traders with comprehensive insights into price behavior through the calculation of horizontal volume profiles. By analyzing these profiles, the indicator identifies key levels and assesses price reactions, offering valuable trading signals.
---
# Concept
The Falcon - Volume & Level Reaction indicator is built to help traders identify and capitalize on key market levels by analyzing volume profiles and price behavior. This indicator enhances trading strategies by providing clear signals based on robust analysis, allowing traders to make informed decisions and improve their trading outcomes.
---
# Functions
1. Volume Profile Calculation
- Profile Period: Calculates horizontal volume profiles over a specified number of bars.
- Peak Volumes: Identifies peak volume levels based on the sensitivity parameter.
2. Price Behavior Analysis
- Primary Check: Determines if bars close above or below the peak level.
- Secondary Checks:
- Volume Decrease: Confirms a decrease in volume after the price touches the level.
- Volatility Check: Ensures bars do not exceed the average ATR range.
3. Signal Generation
- Combined Signals: The primary check generates initial long/short signals, while secondary checks strengthen these signals.
- Real-time Alerts: Provides "Potential" short or long signals based on the current candle's closure relative to the level.
4. Comprehensive Analysis: Helps identify multiple factors that validate level protection and potential price reversals.
---
# Description of Checks
1. Primary Check: Price Closure
- This check assesses whether the bars close above or below the identified peak volume levels. If the price closes above the level, it generates a long signal; if it closes below, it generates a short signal. This check is fundamental as it directly indicates the price's interaction with significant volume levels.
2. Secondary Check 1: Volume Decrease
- After the price touches a peak volume level, this check verifies if there is a subsequent decrease in trading volume. A decrease in volume after touching the level suggests reduced market interest at that price, which can indicate potential reversals or continuations based on the overall market context.
3. Secondary Check 2: Volatility Check
- This check ensures that the price bars do not exceed the average ATR range after touching the peak volume level. Lower volatility near key levels indicates stability and strengthens the signal generated by the primary check, confirming the market's reaction to these levels.
---
# How to Use the Indicator
1. Set Parameters: Define volume profile parameters such as profile period, number of peaks, and level sensitivity.
2. Analyze the Chart: Observe the peak volume levels displayed on the chart.
3. Receive Signals: Follow the buy or sell signals that appear when the price touches the level and the primary and secondary checks are met.
4. Respond to Alerts: When a "Potential" long or short signal appears, evaluate the closure of the current candle relative to the level to make a trading decision.
Example of Work
- Setup:
- Result:
---
# Input Parameters
- Profile back: Defines the lookback period for volume profiles (10–500, step 1).
- Max Profile: Sets the maximum number of profiles (10–300, step 5).
- Profiles Length: Specifies the length of profiles (10–100, step 1).
- Profiles Offset: Determines the offset for profiles (0–100, step 1).
- Profiles Width: Sets the width of profiles (1–10).
- Profiles Color: Chooses the color for profiles.
- Lvls Color: Chooses the color for levels.
- Lvl's sensitivity: Adjusts the sensitivity of levels (1–10).
- tolerance: Sets the tolerance level (0.000–0.003, step 0.001).
- tolerance ATR: Defines the ATR tolerance (1.0–4.0).
---
Falcon - Volume & Level Reaction
Индикатор на основе горизонтальных объемов помогает трейдерам выявлять ключевые уровни объемной проторговки, предоставляя четкие сигналы для принятия торговых решений.
Функции
– Определение и отображение пиковых уровней объемной проторговки.
– Сигналы на покупку (Long) и продажу (Short) на основе поведения цены.
– Анализ объема торгов до и после касания уровня.
– Оценка волатильности цены в период консолидации.
– Автоматическая подстройка под выбранный таймфрейм.
– Отображение локальных максимумов и минимумов.
Настройки
– Количество баров назад VRVP: определяет период для расчета горизонтальных объемов.
– Множитель ATR: коэффициент для вычисления волатильности.
– Множитель погрешности: допустимая погрешность касания уровня.
– Период расчета ATR: количество баров для расчета среднего ATR.
– Отображение Local HH/LL: включение/выключение отображения локальных максимумов и минимумов.
Версии
Данный скрипт – упрощенная версия нашего индикатора с закрытым доступом. Открытая версия доступна для BTC и ETH, только на дневном таймфрейме, без возможности изменения параметров
Energy ScriptEnergy Script Indicator
Description of Indicator
The Energy Script Indicator calculates the market's energy using the formula `Energy = Price * sqrt(Volume)`; providing insight into market activity by combining price movement and volume. This indicator is designed to help traders identify potential reversals and continuation points based on energy levels.
Features
Energy Calculation: Utilizes price and volume to compute market energy, highlighting significant activity changes.
Smoothing Options: Two customizable smoothing periods to filter out noise and highlight trends.
Threshold Alert: Set a threshold value to receive alerts when energy exceeds predefined levels, aiding in quick decision-making.
Customizable Colors: Choose colors for different plot lines to suit your charting preferences.
How to Use:
1. Smoothing Periods: Adjust `Smoothing 1` and `Smoothing 2` to control the sensitivity of the energy plots.
2. Threshold: Set the `Threshold` value to identify significant energy levels. Enable or disable threshold plotting as needed.
3. Volume Integration: Toggle `Use Volume` to include or exclude volume in energy calculations.
4. Alerts: Receive alerts when energy levels cross the defined threshold, signaling potential market movements.
This indicator is a powerful tool for analyzing market dynamics by combining price action with volume, providing a deeper understanding of market energy and potential trading opportunities.

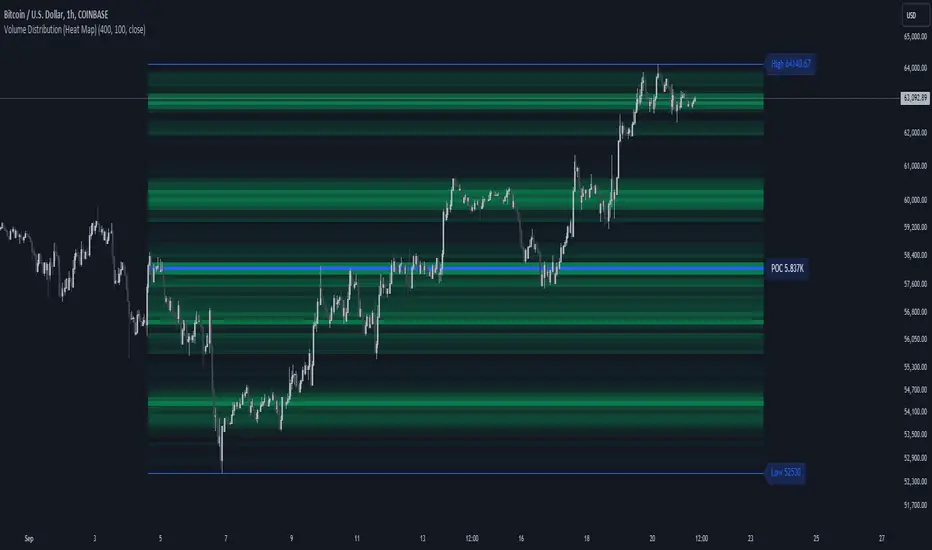
Volume Distribution (Heat Map)This Pine Script indicator, "Volume Distribution (Heat Map)" is designed to visualize the distribution of volume across different price levels over a specified lookback period. Here's a detailed breakdown of its functionality and features:
Indicator Overview
User Inputs
Length: The lookback period for analysis, defaulting to 500 bars.
Source: The price source used for calculations (default is the close price).
Color Intensity: Adjusts the intensity of the heatmap colors, with a default value of 25.
Lines Width: The width of the plotted lines, with a default value of 10.
Main Color: The main color used for the heatmap (default is lime).
Logic
The script iterates through the number of bins, calculates the volume for each bin between highest and lowest prices for length period, and updates the corresponding bin in the freq array if the current bar is allowed.
If the current bar is the last bar, the script plots lines and labels based on the volume distribution.
Heatmap Lines:
Solid lines colored based on the volume in each bin, using a gradient from no color to the main color based on amount of volume.
Highest Volume Line:
A dashed red line indicating the bin with the highest volume.
Labels:
Labels for the highest and lowest prices and the volume at the highest volume bin.
Plots
Highest Price Plot: Plots the highest price within the lookback period if the current bar is within the allowed range.
Lowest Price Plot: Plots the lowest price within the lookback period if the current bar is within the allowed range.
Summary
This indicator provides a visual representation of where trading volume is concentrated across different price levels, forming a heatmap. The highest volume level is highlighted with a dashed red line and a label indicating the volume at that level. This can help traders identify significant price levels where trading activity is clustered.
The "Volume Distribution (Heat Map)" indicator is a valuable tool for traders looking to enhance their technical analysis by incorporating volume data into their price charts. It provides a clear and visual representation of where market participants are most active, aiding in better-informed trading decisions.