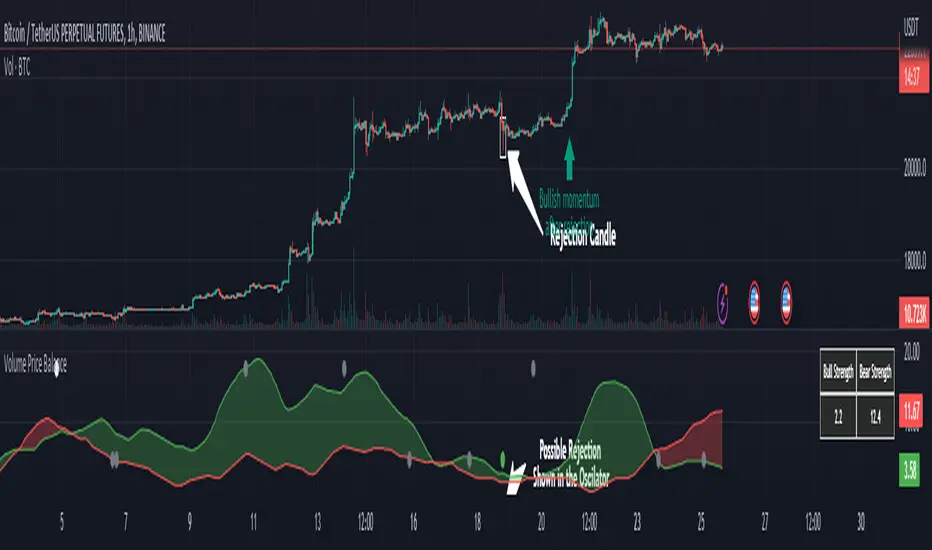
Volume Price Balance by serkany88This idea has been in my mind for a while. We all know how important volume is to technical analysis but volume and price itself doesn't mean much when volatility and momentum of the current trend is not taken into account. With this oscillator we try to combine all these factors into one indicator and provide a simplified interpretation of this relationship with spread analysis. This indicator can be used in all timeframes but higher timeframes like 1 hour and above will provide most stable results.
How it works?
This oscillator tries to analyze volume spread along with price spread based on wyckoff methods and attains certain "strength value" for each candle and it's relationship with the volume. After this calculation preferably we remove detected rejection candles from overall calculation and draw them as plots. The multipliers of the strengths can be changed from the settings.
Green Line Above Red Line = Bullish momentum stronger
Red Line Above Green Line = Bearish momentum stronger
Top circles mean possible bullish reversal candle detected. Gray is weak, White is normal and Red top circle means strong possible reversal detected.
Bottom circles mean possible bearish reversal candle detected. Gray is weak, White is normal and Green bottom circle means strong possible reversal detected.
Let's check the example below
As you can see we see a green dot appear in a somewhat weakening bullish momentum, this can mean possible reversal can happen soon and it does.
Below is a bearish example
In this example we see a possible strong reversal signal in a increasing bullish momentum and the price reacts immediately after the candle.
We also have a table that shows the current non-smoothed result of trend strength based on calculated price-volume spread at top right of the oscillator.
Volumeindicator
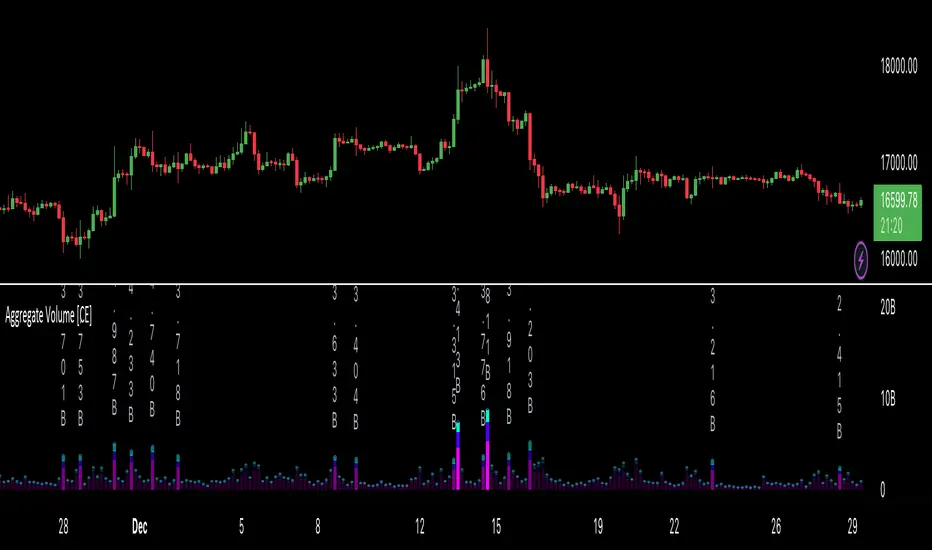
Aggregate Volume [CE]Aggregate Volume automatically fetches and aggregates futures volume data from multiple exchanges such as Binance, OKX, and Bybit -- for any crypto asset, and highlights the volume bars that exceed a user-defined threshold.
This provides a fresh take on the classic Relative Volume in the form of Aggregate Relative Volume.
This indicator displays where the most significant volume has occurred and allows them to easily identify buying and selling climaxes within a high signal and low noise format.
Within the inputs are options that allow you to opt out of certain exchanges or change the color of the bars.
DollarVolume/MarketCap_Ratio (DVMC) This script simply displays the ratio of "Dollave Volume (Volume * Close)" to "Market Capitalization(Total Shares Outstanding * Close)" of stock.
Formula = (DollarVolume / MarketCap) * 100

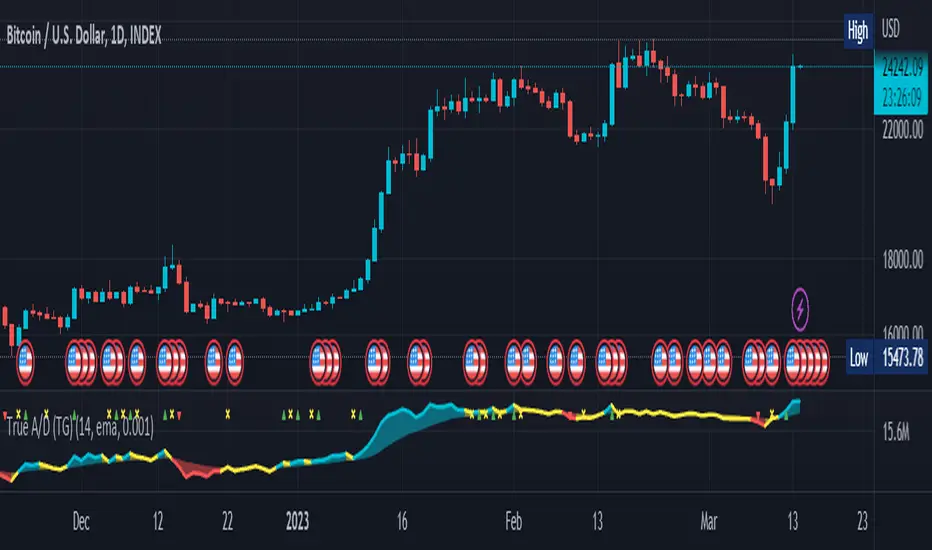
True Accumulation/Distribution (TG fork)An accumulation/distribution indicator that works better against gaps and with trend coloring.
Accumulation/Distribution was developed by Marc Chaikin to provide insight into strength of a trend by measuring flow of buy and sell volume .
The fact that A/D only factors current period's range for calculating the volume multiplier causes problem with price gaps. They are ignored or even misinterpreted.
True Accumulation/Distribution solves the problem by using True Range instead of only relying on current period's high and low.
Most of the time, True A/D reverts to producing the same values as the original A/D. The difference between True A/D and original A/D can be better seen when a gap has occurred, True A/D has handles it better than Accumulation/Distribution which a bearish close in period's range cause it to misinterpret the strong buy pressure as sell volume
The Moving Average Cloud is simply the filling between the moving average and the True A/D. This feature was inspired by D7R ACC/DIST closed-source indicator, kudos to D7R for making such neat visual indicators (but unfortunately all closed source!).
This indicator was made to extend the original work by adding MTF support and a moving average cloud and coloring.
If you like this indicator, please show the original author RezzaHmt some love:
Liquidations by volume (TG fork)Shows actual liquidations on a per-candle basis by using the difference in volume between spot and futures markets.
i.e. volume on a futures market will be much higher if there are many liquidations.
By default, green represents short liquidations (hence a bullish move, hence why it's green), whereas red is for long liquidations (bearish move). The colors can be changed in the settings if you prefer an inverted theme.
Long liquidation data should in theory be more accurate than short liquidation data due to the inability to short on a spot market.
This indicator should be able to help identify trends by determining liquidation points in the chart.
Extended by Tartigradia to automatically detect the symbol (only for crypto assets found on Binance with a USDTPERP pair, so it works for ETH, BNB, etc) and add multi-timeframe support (MTF).
If you like the indicator, please show the original author Thomas_Davison some love:

Olympus MonsThis is the Olympus Mons indicator. It uses Braid Filter, LSMA, and Hawkeye Volume to fire Buy and Sell signals. I use this on the 5 Min. SPY chart to play 1 point scalp targets with options. I have been able to get a pretty consistent win rate using it like this. The default settings are what I use. Hope it helps any of you guys. Let me know if you see any settings that are better.
Volume ROC and 2nd Derivative by ianhThe purpose of this code is to graph a volume simple moving average (sma) and it's first and second derivatives to provide traders with additional information that might determine if volume is converging or diverging with price. The yellow line represents the volume sma, the red line represents the first derivative or the rate of change of the volume and the green line represents the second derivative or acceleration of volume. For long term trading, if the yellow line is "trending" upwards with higher highs and higher lows it means that volume is supporting the over all long term price trend. If the volume is decreasing over the long term then it is not supporting the current price trend. The first and second derivatives may help short term weekly traders confirm price movements. There are several different conditions to look for:
First (Red) ++ Second (Green) --, Trading volume at the current price has "peaked" and the price may reverse soon.
First (Red) -- Second (Green) ++, Trading volume at the current price has "troughed" and the price may reverse soon.
First (Red) + Second (Green) +, Trading volume is not only increasing but it's accelerating which might confirm a large price movement.
First (Red) - Second (Green) -, Trading volume is not only decreasing but it's decelerating which might indicate little to no price movement.

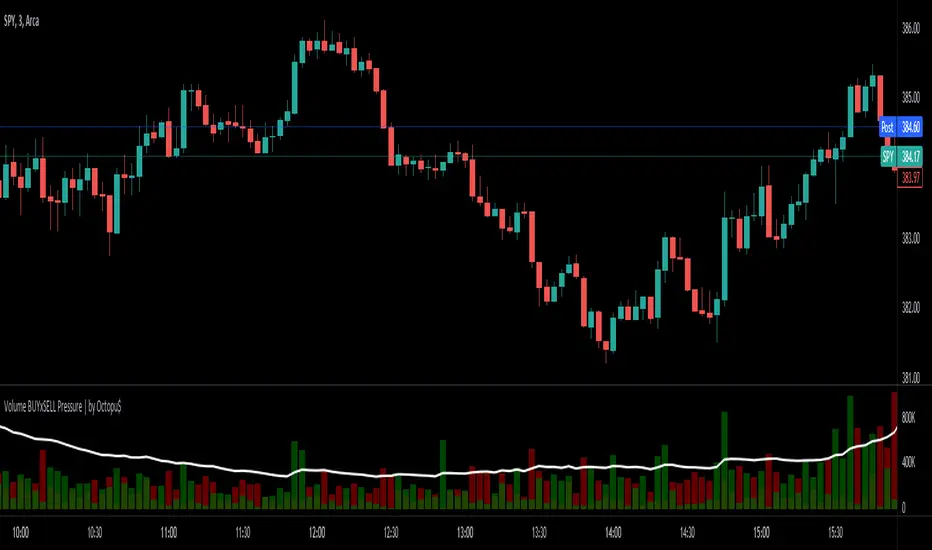
⚖ Volume BUYxSELL Pressure | by Octopu$⚖ Volume BUYxSELL Pressure | by Octopu$
Volume is the number of shares traded in a particular stock, index, or other investment over a specific period of time.
It can indicate market strength, as rising markets on increasing volume are typically viewed as strong and healthy.
In fact, the more, the better. Institutions tend to get more involved in a stock with daily dollar volume in the hundreds of millions or more
But also, when prices fall on increasing volume, the trend is gathering strength to the downside.
That's where BUYxSELL Pressure | by Octopu$ comes in.
Typically, Volume bars follow the candles.
If the Candle is Green (Close > Open), the Volume Bar is also Green.
Now if the Candle is Red (Close < Open) the Volume Bar is also Red.
You never know if it is being Bought or Sold.
This changes the game: along with Price Action, Trend Direction, and other factors. This is possible!
This indicator is composed of:
Volume itself (all of it), displayed by Gray bars;
Identifies Buying Pressure on Green Bars;
And Selling Pressure with Red Bars.
Volume Average as a White Line, for the last "X" Days
Additionally,
It presents a Yellow Triangle as and indication of when the Volume is above the Average in the current TF you are in.
Additionally, this can be set up via an Input: Means if you like to watch it 10% above Average, you got it. 25%? 50%?... You name it.
On top of that,
Includes an indication for Volume Spike as well. So if informs you visually on the Volume Bars of any surges on the TF you are in.
For example: 2x the Volume from the last Candle. Or maybe 3x? 5x... The way you like it the best.
This way, with the combination of your understanding as well as other Indicator and Factor as Confluence, you can improve your analysis and figure out what is going on.
www.tradingview.com
(SPY 5m as an example only)
SPY
Features:
• Total Volume
• Average Volume
• Buying Pressure
• Selling Pressure
• % Above Average
• Volume Spike/Surge (Multiplier)
• Custom Settings
Options:
• Show/Hide Average Line
• Change Length of Average (Days)
• Select/Personalize % of Above Avg
• Add Personalized X Multiplier
• Fully customizable on Style and Colors
• Change shapes and Location
Notes:
v1.0
Indicator release.
Changes and updates can come in the future for additional functionalities or per requests. Follow and Stay Tuned!
Did you like it? Please Support and Shoot me a message! I'd appreciate if you dropped by to say thanks! Thank you.
- Octopu$
🐙
Sneaky VolumeSneaky Volume
An experimental script that marks the highest and lowest candle of the day with above average volume.
New candles that meet the criteria will repaint until daily close
How to use
They can be interpreted in a number of ways. Potential sign of consolidation, reversal, continuation or retest zones. Use on own discretion.
In action

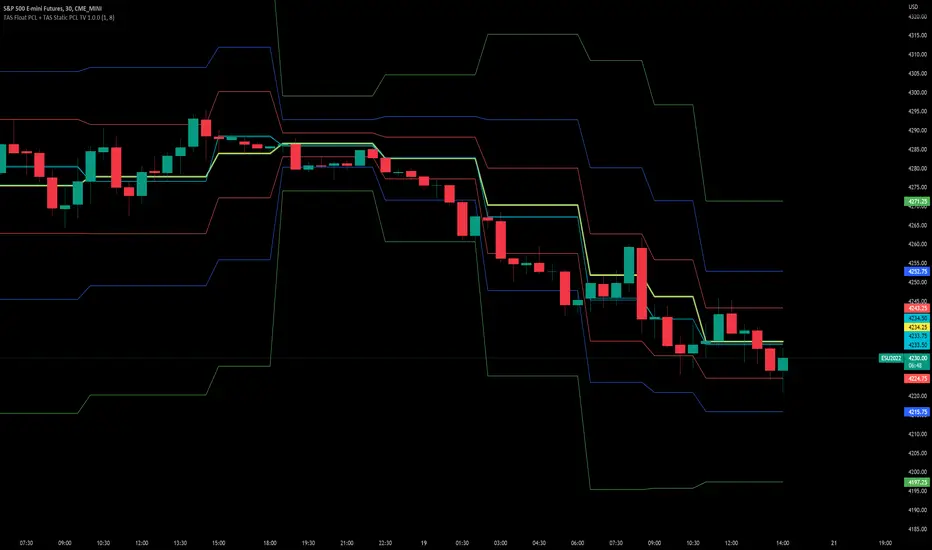
TAS Float PCL + TAS Static PCL [TASMarketProfile]TAS PRICE COMPRESSION LEVELS (PCLs) includes 2 distinct indicators that use volume at price analysis, volume aggregation and multi-timeframe confluence to calculate and display significant levels of commercial interest above and below the market. These levels reveal reliable trading levels which can be leveraged for enhanced trade entries, trailing stops and targets.
THERE ARE TWO TYPES OF TAS PCLs:
TAS Float PCLs - These levels take into account new data flow throughout the trading session and expands or contracts the levels dynamically in accordance with changing market conditions. These are often referred to by traders as “Floaters” or “Dynamic PCLs.”
TAS Static PCLs - These levels are set upon the start of the trading session and remain intact throughout the duration of the session. Many traders These are often referred to by traders as “Statics.”
Both TAS Floaters and TAS Statics have up to 10 horizontal lines available to display. The four center lines are referred to as Points of Control (POC). Three of these lines are colored cyan and one is yellow. The yellow line is more prominent and referred to as the Master Point of Control (MPOC) of the Price Compression Levels on display. The first area of commercial suppor t and resistance are plotted with red lines on both sides of the POC lines and commonly referred to as S1 and R1 levels. The next level of support and resistance areas are designated by blue lines (S2 and R2 levels) and then lastly the farthest from the POC lines are the green lines (S3 and R3 levels). By default, typically the green lines are not displayed but can be activated on an “as needed” basis within the indicator Style settings.
EXAMPLE OF TAS FLOAT PCLs:
ABOUT TAS FLOAT PCLs:
The TAS Dynamic PCLs (Floaters) reveal the price areas that attract commercial interest based on the current market conditions.
How the PCLs are plotted can be adjusted with two inputs controlled by the user.
----------1) MinSignal_123: This setting controls the sensitivity of the calculations. The default is set to 1 and this represents the most sensitive input that makes it easiest for market conditions to trigger new PCL levels. A setting of 2 is considered “medium” sensitivity and lastly a setting of 3 would require the most substantial change in conditions to trigger an adjustment of PCLs on the chart.
----------2) Length: This input setting determines the number of bars of data included in the calculation for new TAS Float PCLs to be adjusted on the chart. The default is set to 8.
MORE ON INPUT SETTINGS:
Using higher values in both inputs will display more significant areas of commercial interest for higher probability support and resistance levels around PCLs. These are referred to as “slow” Floaters.
Using lower value inputs will create Floaters that are more responsive to market conditions. These are referred to as “fast” Floaters.
When fast Floaters are contracted (cover a narrow range of prices) the market is tightly balanced and can easily enter into breakout conditions, if price closes outside of the TAS Float PCLs.
Expanded Floaters that are wider apart provide for greater rotational range trading conditions.
BELOW ARE THE RECOMMENDED INPUT SETTINGS COMBINATIONS THAT WILL DICTATE HOW RESPONSIVE THE PCLs WILL REACT TO CONDITIONS:
FAST (default): 1 - 8
MEDIUM: 2 - 14
SLOW: 3 - 34
The user will typically choose to have either Statics or Float PCLs active on the chart at a time, but not both as you'll have up to 20 levels on your chart (too many). You can, however, put them on different panes. Visit the INPUT settings of the indicator to select which one you want active.
The user can change the coloring, line type and thickness in the STYLE settings.
ABOUT TAS STATIC PCLs:
Many traders opt for TAS Static PCLs because they prefer to know the significant commercial interest price areas before they trade.
Unlike Floaters, TAS Static levels will not change throughout the trading session and are only affected if the user changes the opening and closing time parameters for the trading session displayed. By default, Static levels will recalculate and display new levels upon the reopen of the next session.
Tightly compacted POC lines designate an area of particularly strong commercial interest that provides higher probability, lower risk entries for extended directional moves. These areas are often referred to as “walls.”
If the POC lines are spread out over a wider range, a trader should be on the lookout for a more rotational trading session.
Periodically, one of the POC lines may be plotted outside of a red line (S1 or R1). In this case, the market may be biased in the same direction that the POC line is in relation to the red line.
TAS PRICE COMPRESSION LEVELS can be used as a stand-alone trading guidance system or in conjunction with other popular TASMarketProfile indicators.
Trade Well My Friends!
Volume with forceThis indicator shows the classic stock volume chart with a plottable 20 periods SMA line. Along with this, it shows to the top right of the pane a percent, showing the current "volume force".
This force is calculated as the SMA of the last 3 volume candles excluded the current candle (only counts finished candles) and then compare it with the standard 20 periods volume SMA.
Some examples for a better understanding:
A value of 200% means that the SMA of last 3 candles is equals to 2 times of the 20 periods volume SMA
A value of 100% means that the SMA of last 3 candles is equals to the 20 periods volume SMA
A value of 50% means that the SMA of last 3 candles is equals to 1/2 of the 20 periods volume SMA
A value of 25% means that the SMA of last 3 candles is equals to 1/4 of the 20 periods volume SMA
If the value is above 100%, the background will be green, red otherwise. A green value means that the symbol is having a nice volume income.
Customizable settings
Timeframe: the main TF to plot volume and calculate force
MA Length: the length of the standard volume SMA to plot (and to compare for the force calculation)
Diff force length: the length of the last candles (excluded the current candle) to compare with the standard volume SMA
Show moving average: if checked, plots the standard SMA
Show volume force: if checked, shows to the top right the volume force

On Balance Volume DeviationThe objective of this indicator is to be a leading indicator that can detect a large price change before it happens. It is based on the On Balance Volume (OBV) indicator, which is a leading indicator based on the premise that a large change in volume often precedes a large price change. This indicator charts the N-Period deviation of the OBV data and displays it as a histogram. This is overlayed on an area chart of the M-Period SMA of the histogram data. This combination helps to visually enhance the pattern that signifies that a jump in price is about to happen.
Useage:
When the histogram bars are above the area plot, then a jump in price is about to happen
As with all leading indicators, there are a lot of false signals. Confirm with price action or another indicator
The further the histogram bars are above the area plot, the larger the predicted jump in price
It seems to work better on shorter intraday timeframes than on the longer timeframes
At the close of a market session, it is a good indicator of how much the price will jump on the opening of the next market session.

VSA | Volume Spread Analysis [Kintsugi Trading]What is the VSA | Volume Spread Analysis Indicator?
I created this premium volume indicator to find and place high probability forex trades as a part of the Kintsugi Trading 3LS | 3 Line Strike Strategy .
Originally developed by Tom Williams who is considered the father of Volume Spread Analysis, this tool is an amazing indicator and would make a great addition to any trading strategy.
You are free to customize all the inputs:
• 30 | Moving Average-1 Multiplier (Average Volume)
• 0.5 | Moving Average-1 Multiplier (Below Average Volume)
• 1.5 | Moving Average-2 Multiplier (High Volume)
• 3.0 | Moving Average-3 Multiplier (Ultra High Volume)
**Note The default inputs are based on my research and analysis.
Components of The Volume Spread Analysis:
1. The Volume (i.e. activity)
2. The Spread (i.e. range of the price bar)
3. The Close (the closing price of the current bar)
Volume: Volume is the activity of the frequency of transaction of the price change during a specified period of time.
Spread: Spread is the difference between opening and closing price.
Close: Close price tells us where the balance point is at the end of the period.
At Kintsugi Trading we strongly believe that we cannot beat or outperform institutional traders, instead, we have to trade along with them. With that in mind, we follow the footprints of smart players who leave behind trails.
I have designed this indicator so that it is capable of giving signals for all the phenomena explained in Tom William's book.
This Indicator is successful at visualizing the following phenomenon:
• Trapped Buyers
• Trapped Sellers
• Stopping Volume (long)
• Buying Climax
• Selling Climax
Good luck with your trading!

Banknifty Volume - IN
This simple indicator computes the average Relative Strength Index of each Banknifty stock and displays the volume on the chart with color schemes while the average line indicates the average RSI of all Bank Stocks. This indicator works on Banknifty and its stocks.
It works on all time frames
How You can use this?
You can use this indicator for Volume analysis if the average RSI line is above the 0 line, the stock is moving upside and vice versa for Downside .

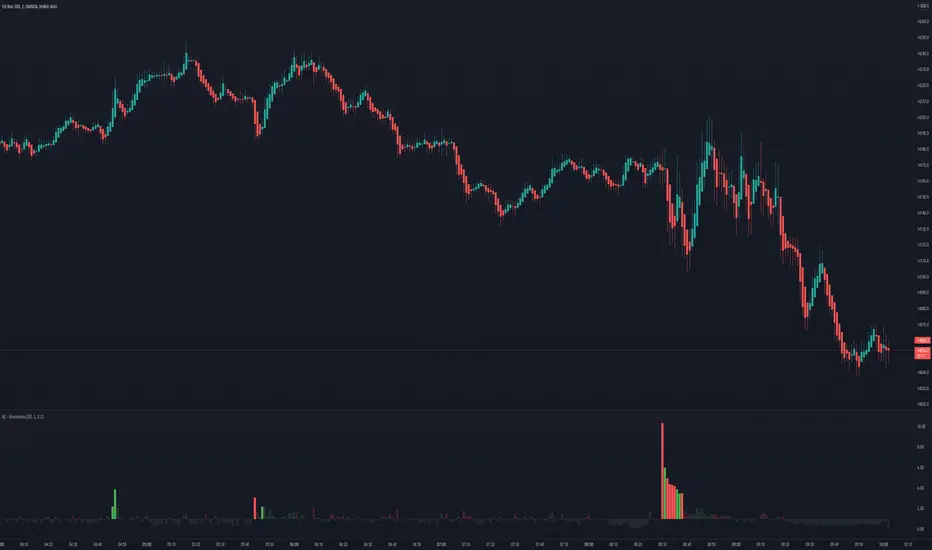
Climatic Volume Study (CVS) [JoseMetal]============
ENGLISH
============
- Description:
This indicator is similar to my previous volume indicator called "ADVO" (check my profile!), which determines accumulative and distributive volume (buy/sell, bullish/bearish candles), but instead of using ALL the volume it only uses CLIMATIC VOLUME candles filtered by SMA.
There's an option to ignore wicks (which is ENABLED by default), a big volume but small-doji candle doesn't tell too much.
- Visual:
1. Histogram: it shows bullish/bearish (aqua/yellow) climatic candles based on the volume SMA, when the volume of a bar exceeds the SMA. The bar shows up to +100% exceeding volume, more than that it shows a lime/red bar which is also wider.
2. Now we have 2 EMAs, one for accumulative climatic volume (blue) and other for distributive climatic volume (orange).
3. Differential EMA, the wider one, it takes different colors, green whenever the accumulative (blue) EMA is above the distributive one (orange), and red in the contrary case, this EMA is centered so the 50 point of the indicator is it's center, above 50 means accumulative/bullish (green) and below means distributive/bearish (red).
4. And to make all of this even more visual the background color has lime/red colors for crossovers on the EMAs (which is the same as the differential EMA color change), and whenever the accumulation/distribution continues we have a darker green/red color.
*As the indicator ONLY takes climatic volume candles, in some cases (i.e.: if you set the EMAs length too short) there may be a 0 result on the calculations, this plots the background in GRAY.
- Customization:
As usual in my indicators, everything is customizable, you can pick yours, settings, colors, figures etc.
- Usage and recommendations:
Default settings work good, smaller timeframes are usual a better idea to process volume indicators (like checking in 15 min what's happening under the curtain even if you're trading in 1-4H).
You can make the indicator more aggressive by reducing the SMA periods to 7, or more "situational" (check the current environment) to 25.
Same for the climatic volume EMAs, 15-25-50 are nice values., remember not to set it lower or there can be "neutral" areas with no result due to no climatic candled in range.
Enjoy!
============
ESPAÑOL
============
============
INGLÉS
============
- Descripción:
Este indicador es similar a mi anterior indicador de volumen llamado "ADVO" (¡revisa mi perfil!), que determina el volumen acumulativo y distributivo (velas de compra/venta, alcistas/bajistas), pero en lugar de utilizar TODO el volumen sólo utiliza velas de VOLUMEN CLIMÁTICO filtradas por SMA.
Hay una opción para ignorar las mechas (que está HABILITADA por defecto), una vela de gran volumen pero que se queda en una doji no nos dice demasiado.
- Visual:
1. Histograma: muestra velas climáticas alcistas/bajistas (cian/amarillo) basadas en la SMA de volumen, cuando el volumen de una barra supera la SMA. La barra muestra hasta un +100% de volumen excedente, más que eso muestra una barra de color lima/rojo que también es más ancha.
2. Ahora tenemos 2 EMAs, una para el volumen climático acumulativo (cian) y otra para el volumen climático distributivo (naranja).
3. EMA diferencial, la más ancha, toma diferentes colores, verde siempre que la EMA acumulativa (cian) esté por encima de la distributiva (naranja), y rojo en el caso contrario, esta EMA está centrada por lo que el punto 50 del indicador es su centro, por encima de 50 significa acumulativa/alcista (verde) y por debajo significa distributiva/bajista (rojo).
4. Y para hacer todo esto aún más visual el color de fondo tiene colores lima/rojo para los cruces en las EMAs (que es lo mismo que el cambio de color de la EMA diferencial), y siempre que la acumulación/distribución continúa tenemos un color verde/rojo más oscuro.
*Como el indicador SOLO toma velas de volumen climático, en algunos casos (por ejemplo: si se pone la longitud de las EMAs demasiado corta) puede haber un resultado 0 en los cálculos, esto dibuja el fondo en GRIS.
- Personalización:
Como es habitual en mis indicadores, todo es personalizable, puedes elegir configuración, ajustes, colores, figuras, etc.
- Uso y recomendaciones:
La configuración por defecto funciona bien, las temporalidades más pequeñas son generalmente una mejor idea para procesar los indicadores de volumen (como comprobar en 15 min lo que está sucediendo bajo el telón, incluso si estás está operando en 1-4H).
Puedes hacer que el indicador sea más agresivo reduciendo los períodos de la SMA a 7, o más "situacional" (comprobar el entorno actual) a 25.
Lo mismo para las EMAs de volumen climático, 15-25-50 son buenos valores., recuerda no ponerlo más bajo o puede haber zonas "neutras" sin resultado debido a que no hay velas climáticas en el rango.
¡Que lo disfrutéis!

Volume Impulse & Candlestick Patterns - FontiramisuIndicator showing volume impulse & engulfing candlestick pattern.
You can set up multiple parameter for both events.
Volume Impulse :
Volume Period : Lenght of the average volume calculated.
Volume Multiplier : Factor to compare actual volume with average volume.
Engulfing Pattern :
VS avg body : Let you chose to compare body candle to average body of the last few candles (define with parameter : lenghtSizeAvgBody ), otherwise it will be compared to the last body candle.
Engulfing Multiplier : Factor to compare and validate the pattern.

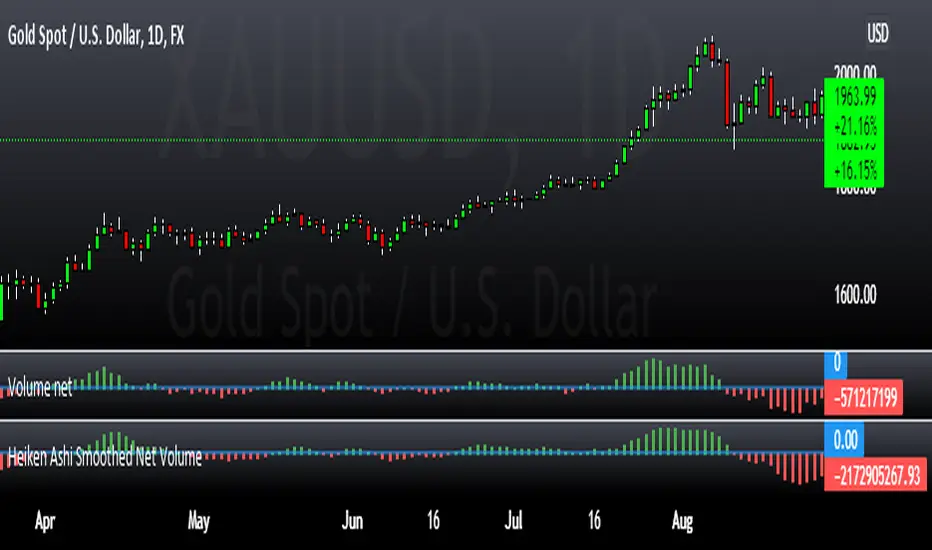
Heiken Ashi Smoothed Net VolumeThis indicator attempts to use Heiken Ashi calculations to smooth the Volume net histogram indicator by RafaelZioni. Long above zero line, short below zero line.
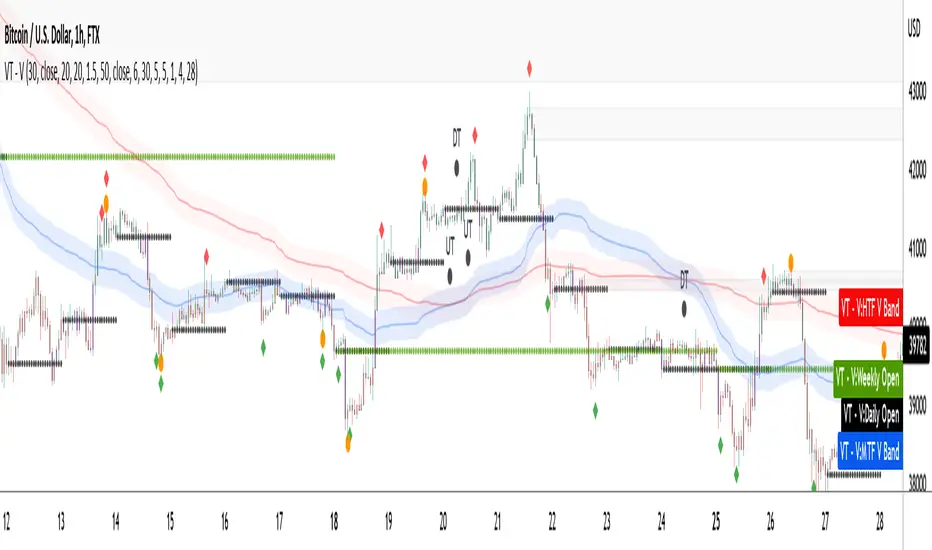
VTrend - Volume ScriptThe Volume script is designed to help you trade the market more efficiently, giving you a lot of information to intrepret, based on volume calculations.
The fundamental part of the script, is the volume weighted bands in blue and red, which help determine the trend and dynamic support and resistance. The blue band is a shorter length than the red band.
When the blue band dips below the red band, this tells us there is a downtrend. And when the blue band is trending above the red band, this is bullish uptrend price action. You will be able to note price whatever the timeframe really respects these bands, and you can use that to your advantage flicking through the high timeframes on where price will go next, combined with your own support and resistance levels.
The other most important aspects are the bar colors and the colored bollinger band line. Whenever price action is above the blue band the bars are green, when closing within the blue band, they are orange to show possible resistance or support. Below the blue band the bars are red for downtrend price action.
When the bars are bouncing off the daily open, a key level for you to play off everyday and makes it easier to gauge what price is doing, the bars are colored purple to highlight this.
The bollinger band line serves to act as a trendline, to help identify where price is going combined with the information above in the short term, and allows you to pick entry points more finely. There are also two bollinger band clouds in the background, which are areas to look at reversal or support for. You can turn these off if you wish, as not to clog up the chart.
Next feature up, are the reversal signals, which also double as areas to take profit. The default are the diamond reversal plots.
Enabled by default also are the custom leledc exhaustion plots, the major signals are enabled by default, whilst the minor signals are not turned on and are very noisy by comparison, especially at low timeframes.
You'll notice in the screenshot below, there is a black MA, that is an adjustable Hull Moving Average included for determining shorter term trend movements combined with the bollinger band colored line, depending on your trading style.
The image below shows when both major and minor leledc signals are turned on.
Also we have circular colored plots showing different reversal calculations, you can use them as a guide and take profit areas. These are based on candle type, and i consider them noisy especially at low time frames.
The indicator is designed to give you key information, but be quite customisable as well to suit your exact trading style.
Recommended timeframes i use this on; Weekly (for key liquidity areas), Trading on the Daily, 6h, 4h, 2h, 1h, and 25 minutes.
EMA - MA 21/55/100/200 Horizontal Lines & Labels & Risk RewardThis indicator will help you to get dynamic support lines of EMA 21,55,100,200 and MA 55,100,200. You can get the Price of EMA And MA in Labels also.
Solid Lines Extended Both Sides - 4 Hours Dynamic Support Resistance of EMA and MA
Dotted Lines Extended Right Side - 1 Day Dynamic Support Resistance of EMA and MA
Dashed Lines Extended Left Side - 1 Hour Dynamic Support Resistance of EMA and MA
Donate Me for My Work :
BTC(BEP20) :- 0x690fb613895dda012e93dfd35564517311b0f4f0
BNB(BEP20) - 0xE1eE3cF8bf462e1575980df2564a8ee4841f39B0
ETH(ERC20) - 0xE1eE3cF8bf462e1575980df2564a8ee4841f39B0
Hope It will help you.
Trade with your own risk. I am not liable for any loss and profit based on this indicator.
Thank you.
Bogdan Ciocoiu - MakaveliDescription
This indicator integrates the functionality of multiple volume price analysis algorithms whilst aligning their scales to fit in a single chart.
Having such indicators loaded enables traders to take advantage of potential divergences between the price action and volume related volatility.
Users will have to enable or disable alternative algorithms depending on their choice.
Uniqueness
This indicator is unique because it combines multiple algorithm-specific two-volume analyses with price volatility.
This indicator is also unique because it amends different algorithms to show output on a similar scale enabling traders to observe various volume-analysis tools simultaneously whilst allocating different colour codes.
Open source re-use
This indicator utilises the following open-source scripts:

Bogdan Ciocoiu - GreuceanuDescription
This indicator is an entry-level script that simplifies volume interpretation for beginning traders.
It is a handy tool that removes all the noise and focuses traders on identifying potential smart money injections.
Uniqueness
This indicator is unique because it introduces the principle of a moving average in the context of volume and then compares it with tick-based volume.
Its uniqueness is reflected in the ability to colour code each volume bar based on the intensity of each relevant (volume) unit whilst comparing it with the volume moving average.
Another benefit of this indicator is the colour coding scheme that removes volume below a particular threshold (default set to 1) under the volume moving average.
In addition to the above features, the indicator differentiates the colour of each bar by price direction.
Open source re-use
To achieve this functionality several open source indicators have been used an integrated within the current one.
Volume Strength FinderGenerally, Volume indicator shows total Volume of a candle. In this Volume Strength Finder Indicator, I tried to separate Strength of buyers and sellers based on the candle stick pattern. Calculating Buyer and Seller Strength each and every candle of the day based on the pattern formation.
High - close => Buyers
Close - low => Sellers
in this way, cumulative volume separates for buyer and sellers and comparing with total volume of the day and showing results.
if buyer strength more than seller, candle bar color remains green even a candle is negative candle(Open>close) and wise versa.
Note: This is for Education Purpose only.

Volume Profile With Buy & Sell Pressure LabelVOLUME PROFILE WITH BUY AND SELL PRESSURE LABEL
This volume profile indicator shows volume traded for each bar and is colored according to the difference in buy and sell pressure(DMI).
***HOW TO USE***
If the bar and background is colored green, there is more market buying than selling on that bar.
If the bar and background is colored red, there is more market selling than buying on that bar.
If the bar and background is colored blue, there is an equal amount of market buying and selling on that bar.
***BUY/SELL LABEL***
There is also a label on the right side that tells you whether there is more buying or selling on the current bar. This table updates in real time and changes colors so you can get an easy, quick interpretation of the current buy/sell pressure without having to look at the volume bars so you can make faster decisions on whether to enter or exit a trade. The table changes colors in sync with the volume bars and background. Green means more market buying than selling. Red means more market selling than buying. Blue means an equal amount of market buying and selling.
***MARKETS***
This indicator can be used as a signal on all markets, including stocks, crypto, futures and forex.
***TIMEFRAMES***
This volume profile indicator can be used on all timeframes.
***TIPS***
Try using numerous indicators of ours on your chart so you can instantly see the bullish or bearish trend of multiple indicators in real time without having to analyze the data. Some of our favorites are our Auto Fibonacci, DMI, Momentum, Auto Support And Resistance and Money Flow Index in combination with this Volume Profile. They all have real time Bullish and Bearish labels as well so you can immediately understand each indicator's trend.
