Volume Delta Methods (Chart) [LuxAlgo]The Volume Delta Methods (Chart) aims at highlighting the relationship between Buying or Selling Pressure and Price by presenting Volume Delta , and multiple derivatives of volume delta such as Cumulative Volume Delta (CVD) , Buy/Sell Volume , Total Volume , etc on top of the Main Price Chart .
The script uses two different intrabar (chart bars at a lower timeframe than the chart's) analyses to achieve the most approximate calculation of the volume delta and offers fully customizable visualization features using various types of charts such as line, area, baseline, candles, and histograms.
The script allows traders to see "within" the price bar, provides more transparency over a traditional volume histogram, and also allows users to monitor price and volume activity together.
🔶 USAGE
Volume delta is the difference between the buying volume and the selling volume, in other words, it is the net demand at a given bar allowing traders a more detailed insight when analyzing the market sentiment. A volume delta greater than 0 indicates more buying than selling pressure, whereas a volume delta less than 0 indicates more selling than buying pressure.
Volume delta plus total volume (regular volume) adds additional insight, where the total volume represents all the recorded trades for security that occurs in a given time interval. It is a measurement of the participation, enthusiasm, and interest in a given security.
Divergences occur when the polarity of the volume delta does not match the polarity of the price bar.
The users can enable the display of the numerical values of the volume delta.
Cumulative Volume Delta (CVD) is a way of using Volume Delta to measure an asset’s mid-to-long-term buy and sell pressure. It compares buying and selling volume over time and offers insights into market behavior at specific price points. Cumulative Volume Delta is effectively a continuation of the principles of Volume Delta but involves longer time periods and offers different trading signals.
Like the Volume Delta, the Cumulative Volume Delta (CVD) indicator measures the relationship between buy and sell pressure but does not focus on one specific candle in particular. Rather, the Cumulative Volume Delta takes the relative differences and combines them all over an extended time period.
Users have the ability Cumulative Volume Delta in various types of charts along with an optional smoothing line.
Placed above price bars options.
Interacting with price bar options helps to better identify CVD Divergences.
CVD Divergences
CVD reveals buying and selling trends that may or may not complement the price trend of the asset itself. Sometimes, price trends can run in contrast to trading behavior — sell volume can be dominant while the spot price is rising, and vice versa.
🔶 DETAILS
Theoretically, volume delta is calculated by taking the difference between the volume that traded at the ask price and the volume that traded at the bid price. The most precise calculation method uses tick data but requires huge amounts of data on historical bars, which usually limits the historical depth of charts. This indicator uses two different intrabar analysis methods for the volume delta calculation, where intrabars are chart bars at a lower timeframe than the chart's timeframe:
The logic used to assign intrabar volume to the "up" or "down".
- Buying/Selling pressure of the intrabar option (default)
(close - low) > (high - close) => UP
(close - low) < (high - close) => DOWN
(close - low) = (high - close) => close - previous close is used
- Polarity of the intrabar option
close > open => UP
close < open => DOWN
close = open => close - previous close is used
🔶 SETTINGS
The script takes into account user-defined parameters and performs calculations and presentations based on them, where detailed usage for each user-defined input parameter in indicator settings is provided with the related input's tooltip.
🔹 Calculation Settings
Calculation Method: Calculation method selection, available options 'Intrabar Buying/Selling Pressure' or 'Intrabar Polarity'.
Lower Timeframe Precision: Sets indicator precision, default option is 'Auto'.
🔹 Presentation Settings
Volume Delta: Toggles the visibility of the Volume Delta
Cumulative Volume Delta: Toggles the visibility of the Cumulative Volume Delta
Volume Delta/Price Bar Divergences: Toggles the visibility of the Volume Delta Divergences
Volume Delta Numerical Values: Toggles the visibility of the Volume Delta Numerical Values
🔹 Other Features
Volume MA: Toggles the visibility of the Volume Moving Average
CVD Smoothing: Toggles the visibility of the Cumulative Volume Delta's Smoothing Line
🔹 Volume Delta, Others
Volume Delta: Positive, Negative: Volume Delta color customization options
Volume Histogram: Growing, Falling: Volume Histogram color customization options
Display Length: Length of the visual objects presented with this indicator
Volume Delta Height: Volume delta height customization options
Volume Histogram Height: Volume histogram height customization options
Vertical Offset: Volume delta and histogram vertical positioning customization options
🔹 Cumulative Volume Delta, Others
CVD Line, Width, and Color: Cumulative Volume Delta - Line Width and Color customization options
CVD Area/Baseline, Gradient Coloring: Cumulative Volume Delta - Area and Baseline background gradient coloring customization options
CVD Candles Color, Positive, and Negative: Cumulative Volume Delta - Candles coloring customization options
CVD/Smoothing Background: Highlights and adjusts the transparency of the area between the Cumulative Volume Delta Line and it's Smoothing Line
🔶 RELATED SCRIPTS
Liquidity-Sentiment-Profile
EquiVolume
Volume-Footprint
Volumeindicator

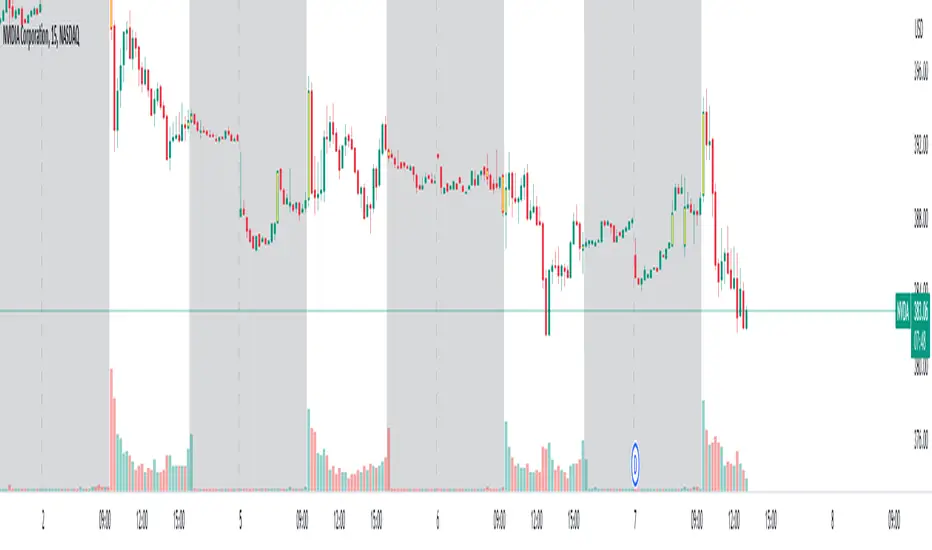
Liquidity PeaksThe "Liquidity Peaks" indicator is a tool designed to identify significant supply and demand zones based on volumetric analysis. It analyzes the volume profile within a specified lookback range to pinpoint the most volumetric point and draw corresponding zones on the price chart.
The 𝐋𝐢𝐪. 𝐏𝐞𝐚𝐤𝐬 indicator utilizes volume data to identify key supply and demand areas on the price chart. By examining the volume profile within a defined lookback range, it highlights three distinct zones: liquidity grab, volume containment, and the most volumetric point.
Zones and their meanings:
Liquidity grab (Orange box): This zone represents a price level where there is a significant swipe of the previous demand zone within the volume range. It indicates a potential shift in market sentiment and serves as a key supply or demand area.
Volume containment (Gray box): This zone displays the area of volume contained before the peak in volume. It provides insights into the range where buying or selling pressure was concentrated, highlighting potential support or resistance levels.
Most volumetric point (Light blue box): This zone represents the point within the lookback range that exhibits the highest volume. It signifies a significant area of market interest and indicates a potential supply or demand level.
Adjustable options:
Adjust liquidity Grab: This option allows you to adjust the size of the boxes. When enabled, the box size is set to twice the size of the high or low of the candle's wick. This adjustment enhances the visibility and accuracy of identifying swipes at specific price levels.
Show origin: Enabling this option ensures that the liquidity boxes are drawn from the wick they were created from. This provides a clear visual reference to the specific candle and highlights the liquidity levels associated with it.
Utility:
The 𝐋𝐢𝐪. 𝐏𝐞𝐚𝐤𝐬 indicator is a valuable tool for traders and investors seeking to identify significant supply and demand zones in the market. By analyzing volume data and drawing corresponding zones on the chart, it helps to pinpoint areas where buying or selling pressure is likely to emerge.
Traders can utilize this information to identify potential support and resistance levels, plan their entries and exits, and make more informed trading decisions. The liquidity grab zones can act as potential reversal or breakout points, while the volume containment zones and most volumetric points provide insights into areas of high market interest.
It is important to note that this indicator should be used in conjunction with other technical analysis tools and indicators to confirm trading signals and validate market dynamics.
Example Charts:

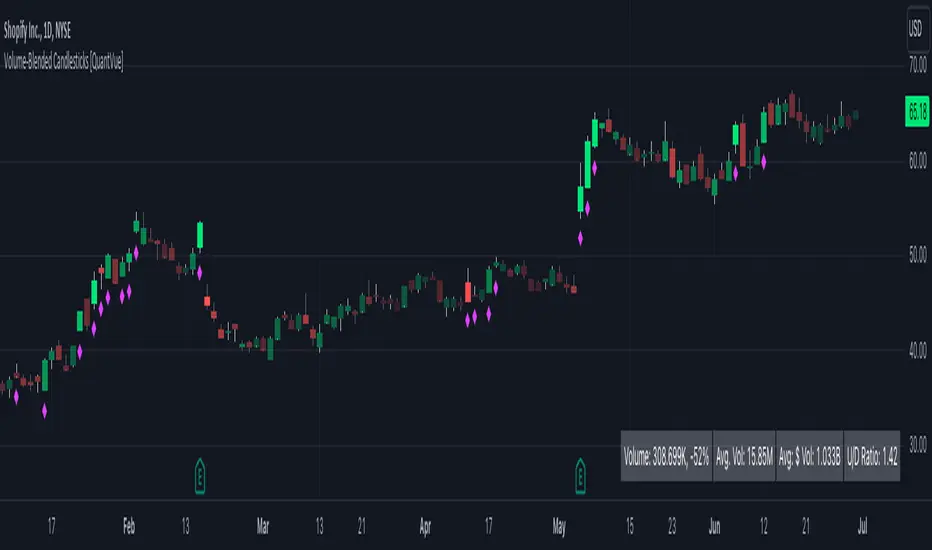
Volume-Blended Candlesticks [QuantVue]Introducing the Volume-Blended Candlestick Indicator, a powerful tool that seamlessly integrates volume information with candlesticks, providing you with a comprehensive view of market dynamics in a single glance.
The Volume-Blended Candlestick Indicator employs a unique approach of projecting volume totals by calculating the total volume traded per second and comparing it to the time left in the session as well as the historical average length selected by the user.
The indicator then dynamically adjusts the opacity of the candlestick colors based on the intensity of the projected volume. As volume intensifies, the candlestick colors become more pronounced, while low volume will cause colors to fade allowing you to visually perceive the level of buying or selling.
One of the standout features of the Volume-Blended Candlestick Indicator is its ability to identify pocket pivots. A pocket pivot is an up day with volume greater than any of the down days volume in the past 10 days. By highlighting these pocket pivots on your chart, the indicator helps you identify potential stealth accumulation.
In addition to blending volume with candlesticks and spotting pocket pivots, this versatile indicator provides you with an insightful table displaying key volume metrics. The table includes the average volume, average dollar volume, and the up-down volume ratio, allowing you to get a clear picture of buying and selling pressure.
Settings Include:
🔹Sensitivty Level: Normal, More, Less
🔹Volume MA Length
🔹Toggle Color based on previous close
🔹Show or hide volume info
🔹Chose candlestick colors
🔹Show or hide pocket pivots
🔹Show or hide volume info table
Don't hesitate to reach out with any questions or concerns.
We hope you enjoy!
Cheers.
Volume Orderbook (Expo)█ Overview
The Volume Orderbook indicator is a volume analysis tool that visually resembles an order book. It's used for displaying trading volume data in a way that may be easier to interpret or more intuitive for certain traders, especially those familiar with order book analysis.
This indicator aggregate and display the total trading volume at different price levels over the entire range of data available on the chart, similar to how an order book displays current buy and sell orders at different price levels. However, unlike a real-time order book, it only considers historical trading data, not current bid and ask orders. This provides a 'historical order book' of sorts, indicating where most trading activities have taken place.
Summary
This is a volume-based indicator that shows the volume traded at specific price levels, highlighting areas of high and low activity.
█ Calculations
The algorithm operates by calculating the cumulative volume traded in each specific price zone within the range of data displayed on the chart. The length of each horizontal bar corresponds to the total volume of trades that occurred within that particular price zone.
In essence, when the price is in a specific zone, the volume is added to the bar representing that zone. A thicker bar implies a larger price zone, meaning that more volume is accumulated within that bar. Therefore, the thickness of the bar visually indicates the amount of trading activity that took place within the associated price zone.
█ How to use
The Volume Orderbook indicator serves as a beneficial tool for traders by identifying key price levels with a significant amount of trading activity. These high-volume areas could represent potential support or resistance levels due to the large number of orders situated there. The indicator's ability to spotlight these zones might be particularly advantageous in pinpointing breakouts or breakdowns when prices move beyond these high-volume regions. Moreover, the indicator could also assist traders in recognizing anomalies, such as when an unusually large volume of trades occurs at unconventional price levels.
Identify Key Price Levels: The indicator highlights high-volume areas where a significant number of trades have occurred, which could act as potential support or resistance levels. This is based on the notion that many traders have established positions at these prices, so these levels may serve as significant areas for market activity in the future.
Volume Nodes: These are the peaks (high-volume areas) and troughs (low-volume areas) seen on the indicator. High-volume nodes represent price levels at which a large amount of volume has been traded, typically areas of strong support or resistance. Conversely, low-volume nodes, where very little volume has been traded, indicate price levels that traders have shown little interest in the past and could potentially act as barriers to price. It's important to note that while high trading volume can imply significant market interest, it doesn't always mean the price will stop or reverse at these levels. Sometimes, prices can quickly move through high-volume areas if there are no current orders (demand) to match with the new orders (supply).
Analyze Market Psychology: The distribution of volume across different price levels can provide insights into the market's psychology, revealing the balance of power between buyers and sellers.
Highlight Potential Reversal Points: The indicator can help identify price levels with high traded volume where the market might be more likely to reverse since these levels have previously attracted significant interest from traders.
Validate Breakouts or Breakdowns: If the price moves convincingly past a high-volume node, it could indicate a strong trend, suggesting a potential breakout or breakdown. Conversely, if the price struggles to move past a high-volume node, it could suggest that the trend is weak and might potentially reverse.
Trade Reversals: High-volume areas could also indicate potential turning points in the market. If the price reaches these levels and then starts to move away, it might suggest a possible price reversal.
Confirm Other Signals: As with all technical indicators, the "Volume Orderbook" should ideally be used in conjunction with other forms of technical and fundamental analysis to confirm signals and increase the odds of successful trades.
Summary
The Volume Orderbook indicator allows traders to identify key price levels, analyze market psychology, highlight potential reversal points, validate breakouts or breakdowns, confirm other trading signals, and anticipate possible trade reversals, thereby serving as a robust tool for trading analysis.
█ Settings
Source: The user can select the source, the default of which is "close." This implies that volume is added to the volume order book when the closing price falls within a specific zone. Users can modify this to any indicator present on their chart. For example, if it's set to an SMA (Simple Moving Average) of 20, the volume will be added to the volume order book when the SMA 20 falls within the specific zone.
Rows and width: These settings allow users to adjust the representation of volume order book zones. "ROWS" pertains to the number of volume order book zones displayed, while "WIDTH" refers to the breadth of each zone.
Table and Grid: These settings allow traders to customize the Volume order-book's position and appearance. By adjusting the "left" parameter, users can shift the position of the Volume order book on the chart; a higher value pushes the order book further to the right. Additionally, users can enable "Table Border" and "Table Grid" options to add gridlines or borders to the Volume order book for easier viewing and interpretation.
-----------------
Disclaimer
The information contained in my Scripts/Indicators/Ideas/Algos/Systems does not constitute financial advice or a solicitation to buy or sell any securities of any type. I will not accept liability for any loss or damage, including without limitation any loss of profit, which may arise directly or indirectly from the use of or reliance on such information.
All investments involve risk, and the past performance of a security, industry, sector, market, financial product, trading strategy, backtest, or individual's trading does not guarantee future results or returns. Investors are fully responsible for any investment decisions they make. Such decisions should be based solely on an evaluation of their financial circumstances, investment objectives, risk tolerance, and liquidity needs.
My Scripts/Indicators/Ideas/Algos/Systems are only for educational purposes!

On Balance Volume Heikin-Ashi Transformed
The OBV Heikin Ashi indicator is a modified version of the On-Balance Volume indicator that incorporates the Heikin Ashi transformation. This technical tool aims to provide traders with a smoother representation of volume dynamics and price trends.
The OBV Heikin Ashi indicator combines the principles of OBV and Heikin Ashi to offer insights into the volume and price behavior of an asset. Understanding OBV and Heikin Ashi individually will provide a foundation for comprehending the uniqueness and utility of this indicator.
On-Balance Volume:
OBV is a volume-based indicator that measures the cumulative buying and selling pressure in the market. It considers the relationship between volume and price movements to determine the overall strength and direction of a trend. Rising OBV values suggest bullish buying pressure, while falling values indicate bearish selling pressure.
Heikin Ashi:
Heikin Ashi is a Japanese candlestick charting technique that aims to filter out noise and provide a smoother representation of price trends. It calculates each candlestick based on the average of the previous candle's open, close, high, and low prices. Heikin Ashi candles can reveal the underlying trend more clearly by reducing market noise.
Methodology:
The 𝘖𝘉𝘝 𝘏-𝘈 indicator applies the Heikin Ashi transformation to the OBV values. Each OBV value is replaced with a Heikin Ashi equivalent, which is calculated based on the average of the previous Heikin Ashi candle's open and close prices. This transformation smooths out the OBV values and helps identify the overall trend with reduced noise. Additionaly, 2 optional EMAs are included for convergence-divergence analysis.
By applying the Heikin Ashi transformation to OBV, the indicator aims to enhance the readability of volume and trend information, providing traders with a clearer understanding of market dynamics.
Utility:
The 𝘖𝘉𝘝 𝘏-𝘈 indicator can be a valuable tool for traders and investors in analyzing volume and price trends. It offers a smoother representation of OBV values, allowing for easier identification of trend reversals, bullish or bearish market conditions, and potential trading opportunities. Traders can utilize the indicator to confirm price trends, validate support and resistance levels, and enhance their overall trading strategies.
It is worth noting that the effectiveness of the indicator may vary depending on the specific market and trading strategy. It is recommended to combine its analysis with other technical indicators and perform thorough backtesting before making trading decisions.
Key Features:
2 Adjustable EMAs
Normalized Oscillator Mode
Example Charts:
See Also:
Z-Score Heikin-Ashi Transformed

Ultimate Volume Custom ScreenerThis indicator will allow you to make your custom volume TradingView screener without coding. Add it to the chart, and select up to 40 symbols and up to five indicators. The screener will do the rest for you. The indicator will form a lovely table with all values and highlighted signals. It allows also to filter symbols based on the values of indicators and sends results as an alert.
The screener is highly customizable, and you can choose its position on the chart, sorting, order of the columns, colors for the tables, and all signals separately. You can easily change parameters for all supported indicators.
Supported indicators
Currently, there are 15 different custom indicators available. Current list of indicators:
Accumulation/Distribution (Acm/Dst)
Chaikin Money Flow (CMF)
Ease of Movement (EOM)
Klinger Oscillator (KO)
Money Flow Index (MFI)
Negative Volume Index (NVI)
On Balance Volume (OBV)
Positive Volume Index (PVI)
Price
Price-Volume Trend (PVT)
Volume
Volume MA (VMA)
Volume Percentile (V-Prct)
Volume RSI (V-RSI)
Volume Weighted Average Price (VWAP)
We're already working on adding a few more supported indicators. If you have any ideas about the indicators you want to see in our screener, contact us, and we'll consider them.
Filters
You can combine up to 5 filters on all selected indicators.
This will split the screen table into two parts. The top one will contain symbols that satisfy all conditions:
Alerts
You can also create an alert and receive a filtered symbol at the end of every bar.
Disclaimer
Please remember that past performance may not be indicative of future results.
Due to various factors, including changing market conditions, the strategy may no longer perform as well as in historical backtesting.
This post and the script don’t provide any financial advice.

Normalized Volume Rate of ChangeThis indicator is designed to help traders gauge changes in volume dynamics and identify potential shifts in buying or selling pressure. By normalizing the volume rate of change and comparing it to moving averages of itself, it offers valuable insights into market trends and can assist in making informed trading decisions.
Calculation:
The indicator calculates the Volume Rate of Change (VROC) by measuring the percentage change in volume over a specified length. This calculation provides a relative measure of how quickly the volume is increasing or decreasing. It then normalizes the VROC to a range of -1 to +1 by scaling it based on the highest and lowest values observed within the specified length. This normalization allows for easy comparison of the current VROC value with historical levels, enabling traders to assess the intensity of volume fluctuations.
Interpretation:
The main plot of the indicator displays the normalized VROC values as columns. The color of each column provides valuable information about the relationship between the VROC and the moving averages. Lime-colored columns indicate that the VROC is above both moving averages, suggesting increased buying pressure and potential bullish sentiment. Conversely, fuchsia-colored columns indicate that the VROC is below both moving averages, suggesting increased selling pressure and potential bearish sentiment. Yellow-colored columns indicate that the VROC is between the two moving averages, reflecting a period of consolidation or indecision in the market.
To further enhance interpretation, the indicator includes two moving averages. The Aqua line represents the faster moving average (MA1), and the Orange line represents the slower moving average (MA2). These moving averages provide additional context by smoothing out the VROC values and highlighting the overall trend. Traders can observe the interaction between the moving averages and the VROC to identify potential crossovers and assess the strength of trend reversals or continuations.
Colors:
-- Lime : The lime color is used to represent high volume rate of change above both moving averages. This color indicates a potentially bullish market sentiment, suggesting that buyers are dominant.
-- Fuchsia : The fuchsia color is used to represent low volume rate of change below both moving averages. This color indicates a potentially bearish market sentiment, suggesting that sellers are dominant.
-- Yellow : The yellow color is used to represent the volume rate of change between the two moving averages. This color reflects a transitional phase where neither buyers nor sellers have a clear advantage, signaling a period of consolidation or indecision in the market.
To provide additional visual cues for potential trade signals, the indicator includes lime-colored arrows below the price chart when there is a crossover upwards (MA1 crossing above MA2). This lime arrow indicates a potential bullish signal, suggesting a favorable time to consider long positions. Similarly, fuchsia-colored arrows are displayed above the price chart when there is a crossover downwards (MA1 crossing below MA2), signaling a potential bearish signal and suggesting a favorable time to consider short positions.
Applications:
This indicator offers various applications in trading strategies, including:
-- Trend Identification : By observing the relationship between the normalized VROC and the moving averages, traders can identify potential shifts in market trends. Lime-colored columns above both moving averages indicate a strong bullish trend, suggesting an opportunity to capitalize on upward price movements. Conversely, fuchsia-colored columns below both moving averages indicate a strong bearish trend, suggesting an opportunity to profit from downward price movements. Yellow-colored columns between the moving averages indicate a period of consolidation or uncertainty, signaling a potential trend reversal or continuation.
-- Confirmation of Price Moves : The indicator's ability to reflect volume dynamics in relation to the moving averages can help traders validate price moves. When significant price movements are accompanied by lime-colored columns (indicating high volume rate of change above both moving averages), it adds confirmation to the bullish sentiment. Similarly, fuchsia-colored columns accompanying downward price movements validate the bearish sentiment. This confirmation can enhance traders' confidence in the reliability of price moves.
-- Trade Timing : The indicator's moving average crossovers and the presence of arrows provide timing signals for trade entries and exits. Lime arrows appearing below the price chart signal potential long entry opportunities, indicating a bullish market sentiment. Conversely, fuchsia arrows appearing above the price chart suggest potential short entry opportunities, indicating a bearish market sentiment. These signals can be used in conjunction with other technical analysis tools to improve trade timing and increase the probability of successful trades.
Parameter Adjustments:
Traders can adjust the length of the VROC and the moving averages according to their trading preferences and timeframes. Longer VROC lengths provide a broader view of volume dynamics over an extended period, making it suitable for assessing long-term trends. Shorter VROC lengths offer a more sensitive measure of recent volume changes, making it suitable for shorter-term analysis. Similarly, adjusting the lengths of the moving averages can help adapt the indicator to different market conditions and trading styles.
Limitations:
While the indicator provides valuable insights, it has some limitations that traders should be aware of:
-- False Signals : Like any technical indicator, false signals can occur. During periods of low liquidity or in choppy markets, the indicator may generate misleading signals. It is essential to consider other indicators, price action, and fundamental analysis to confirm the signals before taking any trading actions.
-- Lagging Nature : Moving averages inherently lag behind the price action and volume changes. As a result, there may be a delay in the generation of signals and capturing trend reversals. Traders should exercise patience and avoid solely relying on this indicator for immediate trade decisions. Combining it with other indicators and tools can provide a more comprehensive picture of market conditions.
In conclusion, this indicator offers valuable insights into volume dynamics and trend analysis. By comparing the normalized VROC with moving averages, traders can identify shifts in buying or selling pressure, validate price moves, and improve trade timing. However, it is important to consider its limitations and use it in conjunction with other technical analysis tools to form a well-rounded trading strategy. Additionally, thorough testing, experimentation, and customization of the indicator's parameters are recommended to align it with individual trading preferences and market conditions.

ETN - Volume CandleHighlights candlestick based on volume data.
Indicator looks back and analyzing volume to find the volume bar with the largest numerical value
Indicator highlights the corresponding candlestick .
Indicator marks the high and low of that candlestick.
Users can adjust lookback period. Default is set to 50 .
Users can adjust how the indicator plots the high and low.
I currently have the high and low not being displayed on the charts until I come up with a better version.
On my chart, indicator colored the candlesticks YELLOW.
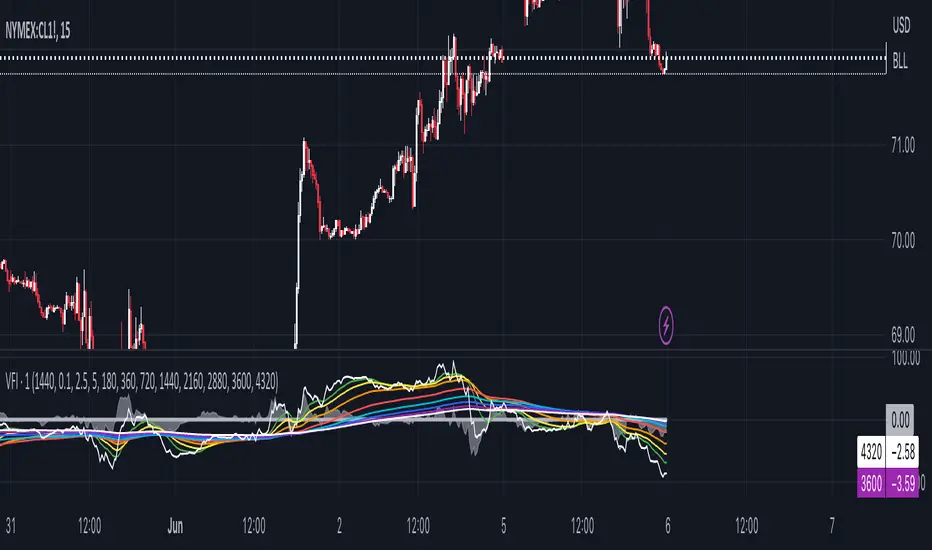
1 min Volume Flow Indicator (VFI) with EMA ribbonOriginally Markos Katsanos' indicator that LazyBear made popular here on TW. Now updated to Pine Script version 5, which makes multi-timeframe charting easier.
The initial Katsanos' idea for the indicator is the following:
"The VFI is based on the popular On Balance Volume (OBV) but with three very important modifications:
Unlike the OBV, indicator values are no longer meaningless. Positive readings are bullish and negative bearish.
The calculation is based on the day’s median instead of the closing price.
A volatility threshold takes into account minimal price changes and another threshold eliminates excessive volume. ...
A simplified interpretation of the VFI is that values above zero indicate a bullish state and the crossing of the zero line is the trigger or buy signal.
The strongest signal with all money flow indicators is of course divergence.
The classic form of divergence is when the indicator refuses to follow the price action and makes lower highs while price makes higher highs (negative divergence). If price reaches a new low but the indicator fails to do so, then price probably traveled lower than it should have. In this instance, you have positive divergence."
I set up default settings for intraday trading I personally have found the most useful. And what I have found useful is how and which volume flows in and out on 1 min chart. For 1 min volume flow I find it convenient to have specific EMAs as guidance: 360, 720, 1440, 2160, 2880, 3600, 4320 -- the logic is derived from how many minutes there are per specific hours and days. Since short term trends typically last for three days, 1440 and 4320 EMAs are the ones I myself concentrate the most. That is to say, quite often 1min volume flow pivots around 1440 and 4320 EMAs.
If you want to see 1 min volume flow on some other timeframe than 1 min, change the timeframe in the settings.
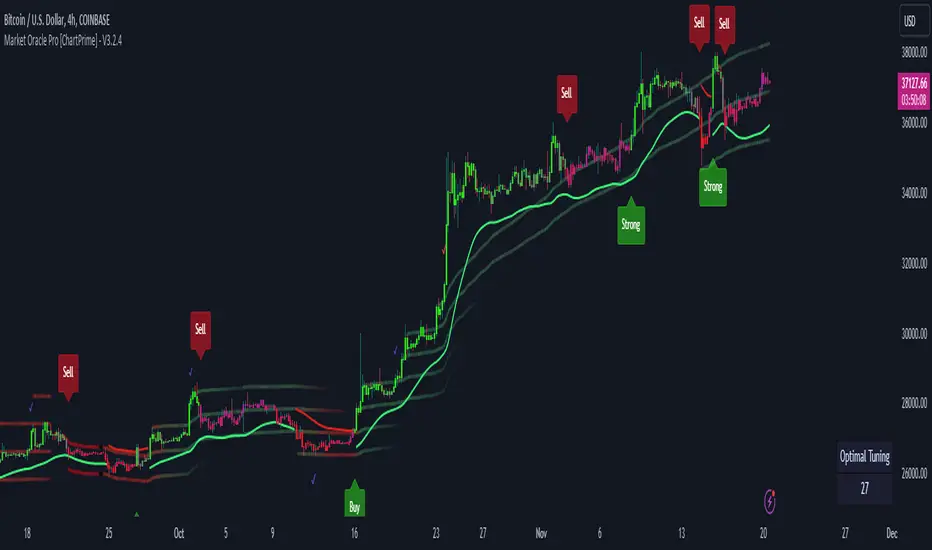
Market Oracle Pro [ChartPrime]ChartPrime Oracle Pro combines actionable, elegant and functional indicators into a single toolkit. Combinations of both trend following and contrarian logic aim to provide traders with a deeper insight into market movements; aiming to assist in better entries and exits.
Designed and created by the ChartPrime team, peacefullizard (digital signal processing expert), Gecko, and ExoMaven, this toolkit takes deeper level theory and expresses it in a useable format for traders. ChartPrime Oracle Pro is designed to satisfy and cover major trading theories allowing the user to pick and select the features that fit them.
When using any indicator suite it is important to understand these tools are there to assist trading rather than to be a single source of truth. Functionality such as Auto Maximization of parameters is there to guide and enhance user experience, however it is important to be aware of overfitting results.
Features included & Use cases:
Signal Mode: Select the type of assistive signals you are requiring. Provided are both trend following signals with self optimization using backtest results as well as reversal signals, aiming to provide real time tops and bottoms in markets. Both these signal modes can be fine tuned using the tuning input to refine signals to a trader's liking. The ChartPrime Auto Maximizer will automatically apply a backtested parameter and display the "best performing signals" on your chart. It is important to note this is not indicative of future results. ChartPrime Trend Signals leverage audio engineering inspired techniques and low-pass filters in order to achieve and attempt to produce lower lag response times and therefore is designed to have a uniqueness when compared to more classical trend following approaches.
Candle Highlighting: Choose between a clean gradient or more classical red/green coloring. These color the candles to assist with trend identification.
ChartPrime Dashboard: This cleanly designed dashboard provides 3 simple to interpret metrics. Firstly, the Optimal Tuning box provides a backtested result giving you the most accurate input. Again, it is important to note this is not indicative of future results. A Prime Score is also provided. This metric is a collection of ChartPrime trend following indicators bundled into a single item. It ranges from 0 (being very bearish trend) to 10 (being a very bullish trend). 5 would indicate a ranging market. A consolidation score is also provided showing how "ranging" the market is. 10 being a low volatility and consolidating market and 0 being a more volatile and trending market which can assist the trader in avoiding ranges (if undesired).
Additional Features:
The Dynamic Reactor provides a simple band passing through the chart. This can provide assistance in support and resistance locations as well as identifying the trend direction expressed via green and red colors. Taking a moving average and applying unique adaptivity calculations gives this plot a unique and fast behaviour.
The Prime Ranges provide VWAP inspired real time actionable ranges on your chart. These ranges provide support and resistance levels as well as coloring, once again, there to aid trend identifcation. By generating a distribution and projecting it we produce real time levels for traders.
Candlestick structures analyze candlestick formation putting a spin on classical candlestick patterns and provide the most relevant formations on the chart. These are not classical and are filtered by further analyzing market activity. A trader's classic with a spin.
The Momentum Wave Bands provide classical areas of high deviation where the price may reverse. It also provides additional insight on trend direction and volatility.
The Prime Trend Assistant provides a trend following dynamic support and resistance level. This makes it perfect to use in confluence or as a filter for other supporting indicators. This is an adaptive trend following system designed to handle volatility leveraging filter kernels as apposed to low pass filters.
Settings:
Signal Mode: Drop down to select the types of signals wanted
Tuning: Integer input to adjust signal's responsiveness. Lower inputs result in more frequent signals being produced.
Auto Maximizer Toggle: Automatically apply a backtested parameter to the signals
Dashboard Size: Drop down to select the size of the dashboard
Dashboard Position: Change the location of the dashboard on your chart
Additional Features: A set of toggles turning on/off these indicators.
Example Usecases:
Trend based confluences:
ChartPrime Oracle Pro provides classical (all be-it self optimizing) trend based signals. When trading, taking into consideration other forms of confluences are crucial. Take the image below: Here we see a *uptrend* where smaller retracements in price action are resulting in sell signals. When identifying a trend, analyzing the macro and micro price action can help the trader deduce how relevant a move in the market may be. We can use the Prime Trend Assistant to help filter out said retracements. We are also able to use the Prime Ranges in a similar way.
Features such as the Prime Ranges have duplicate usecases whereby a trend can be idenfied via the color of the bands as well as providing TP/SL levels. Considering these assisting features is vital before entering a trade.
Contrarian trading methodologies:
Commonly; trading with a trending market is most well known. However; markets are just as susceptible to ranging behaviors. ChartPrime has designed this toolkit to cater to most market conditions. For example, finding confluence between reversal indicators such as our contrarian signals and the momentum wave band can provide for some very strong confluence that can help a trader attempt to enter at bottoms of retracements and achieve the best possible entries or exits.
Developing confluences as shown above can be key to a trader's success. It is import ant to avoid biases when looking at indicators and view the market as objectively as possible.
ChartPrime believe that there is no magic indicator that is able to print money. Indicator toolkits provide value via their convinience, adaptibility and uniqueness. Combining these items can help a trader make more educated; less messy, more planned trades and in turn hopefully help them succeed.
Risk Disclaimer
All content and developments created by ChartPrime are purely for informational & educational purposes only. Past performance does not guarantee future results.
Tập lệnh trả phí
Volumen Salvatierra
The "Salvatierra Volume" Indicator is an indicator based and created in homage to Tom Williams (author of "Master The Markets") . It helps to interpret the volume and movements of the market, in a simple way. Its benefits are:
Helps identify climatic volumes
Helps identify if there are or not strong hands in the market
Shows if a trend is being driven by volume and if the volume is strong
Red Volume:
Weak hands only
Green Volume:
Strong Hands Testing or guiding the price
Black Volume:
volume is normal
White Candles:
Sail with very little volume
Black Candles:
candle with a lot of volume
El Indicador de "Volumen Salvatierra" es un indicador basado y creado en homenaje a Tom Williams (autor de "Master The Markets") . Ayuda a interpretar el volumen y los movimientos del mercado, de una manera sencilla. Sus beneficios son:
Ayuda a identificar los volúmenes climáticos
Ayuda a identificar los momentos en los que no hay manos fuertes en el mercado
Muestra si una tendencia esta siendo guiada por el volumen y si el volumen es fuerte
Volumen Rojo:
Solo manos débiles
Volumen Verde:
Manos Fuertes Testeando o guiando el precio
Volumen Negro:
El volumen es normal
Velas blancas:
Vela con muy poco volumen
Velas Negras:
Vela con mucho volumen

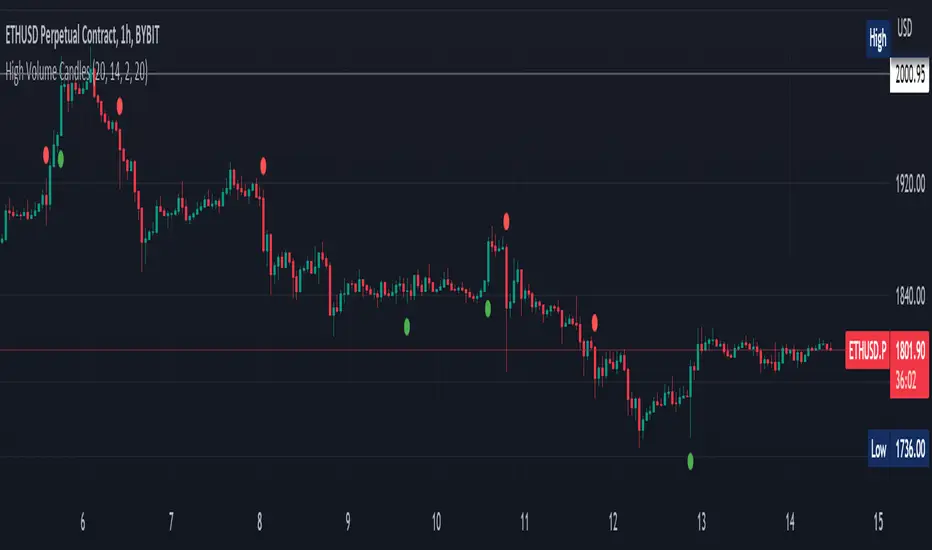
High Volume Candles Detector - Open Source CodeGreetings, fellow traders!
Throughout my trading career, I've been intrigued by the dynamic interplay between candlestick patterns and trading volume. This fascination led me to develop an open-source indicator to help illuminate these patterns for the broader trading community.
Upon researching the Public Library, I found that many indicators relating to candlestick/volume analysis are proprietary and not open-source. This discovery further fueled my commitment to contribute a free, accessible tool that traders of all levels can utilize in their technical analysis.
Thus, I am excited to present to you our High Volume Bars Indicator. A unique tool that I believe fills a gap in the Public Library. I truly hope you find it beneficial in your trading journey and that it empowers you to make more informed decisions.
Description:
The High Volume Bars Detector is designed to help traders identify bars with significantly higher volume than the average. Users can filter in the settings menu:
1) The length of the Simple Moving Average (SMA) for volume, allowing you to define the average volume over a specific number of bars.
2) The Volume Multiplier, a factor that determines how much greater the volume of a bar should be compared to the SMA to qualify as a high-volume bar.
3) The Lookback Period, a specified number of candles used as a comparative benchmark for identifying the highest volume.
4) If the Volume bar is green or red, so if the candle price is --> close > open or open > close
Examples to better understand the logic of the indicator:
1) Length of the Simple Moving Average (SMA) for Volume: This setting allows you to define the average volume over a specific number of bars. For instance, if you set the SMA length to 20, the indicator will calculate the average volume of the past 20 bars and use it as a baseline to identify high volume bars.
2) Volume Multiplier: This is a critical factor that determines the threshold for what constitutes a high-volume bar. If you set the volume multiplier to 2.0, for example, the indicator will flag any bar where the volume is twice the value of the SMA volume as a high-volume bar.
3) Lookback Period: This setting lets you specify the number of candles that the indicator should consider when determining the highest volume. For instance, if the lookback period is set to 14, the indicator will compare the volume of the current bar with the volumes of the previous 14 bars. If the current bar's volume is the highest, it will be flagged.
4) Volume Bar Color: This filter helps you identify whether a high-volume bar is bullish or bearish. If the bar is green (close > open), it suggests buyers were dominant during that period. If the bar is red (open > close), it suggests sellers had the upper hand. By setting this filter, you can choose to focus on high volume bars that are either bullish (green) or bearish (red) or both, depending on your trading strategy.
Remember, these filters offer a level of customization that allows you to tailor the High Volume Bars Detector to your unique trading style and requirements. Always remember to adapt these settings to align with your overall trading plan and risk tolerance.
Keep attention!
It is important to note that no trading indicator or strategy is foolproof, and there is always a risk of losses in trading. While this indicator may provide useful information for making conclusions, it should not be used as the sole basis for making trading decisions. Traders should always use proper risk management techniques and consider multiple factors when making trading decisions.
Support me:)
If you find this new indicator helpful in your trading analysis, I would greatly appreciate your support! Please consider giving it a like, leaving feedback, or sharing it with your trading network. Your engagement will not only help me improve this tool but will also help other traders discover it and benefit from its features. Thank you for your support!
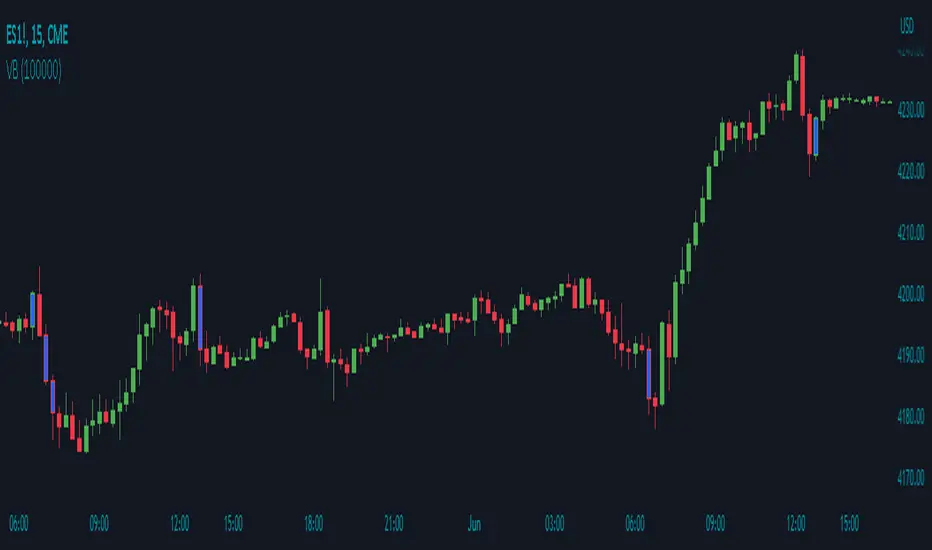
Volume Breakout by Chosen VolumeDescription:
The Volume Breakout indicator (VB) is a technical analysis tool that highlights candles with significant trading volume. It helps traders identify potential breakout periods characterized by high volume activity.
How it Works:
The Volume Breakout indicator compares the volume of each candle with a user-defined minimum volume threshold. If the volume of a candle exceeds or is equal to the specified minimum volume requirement, the indicator identifies it as a volume breakout and marks it accordingly.
Usage:
To effectively utilize the Volume Breakout indicator, follow these steps:
1. Apply the VB indicator to your chart by adding it from the available indicators.
2. Customize the minimum required volume parameter according to your trading preferences. This parameter determines the threshold volume level that a candle must meet or exceed to be considered a breakout candidate.
3. Observe the candles on the chart:
- Candles that meet or exceed the minimum required volume are highlighted with a specific color (yellow by default), indicating potential breakout periods.
4. Pay attention to the volume breakout indications within the candles, as they suggest periods of increased trading activity.
5. Analyze the price action accompanying the volume breakout candles. Breakouts often indicate a surge in buying or selling pressure, potentially leading to significant price moves or trend reversals.
6. Combine the analysis of volume breakout candles with other technical analysis tools, such as trend lines, support and resistance levels, or indicators, to confirm potential trade setups.
7. Implement appropriate risk management strategies, including setting stop-loss orders and position sizing, to manage your trades effectively and protect your capital.
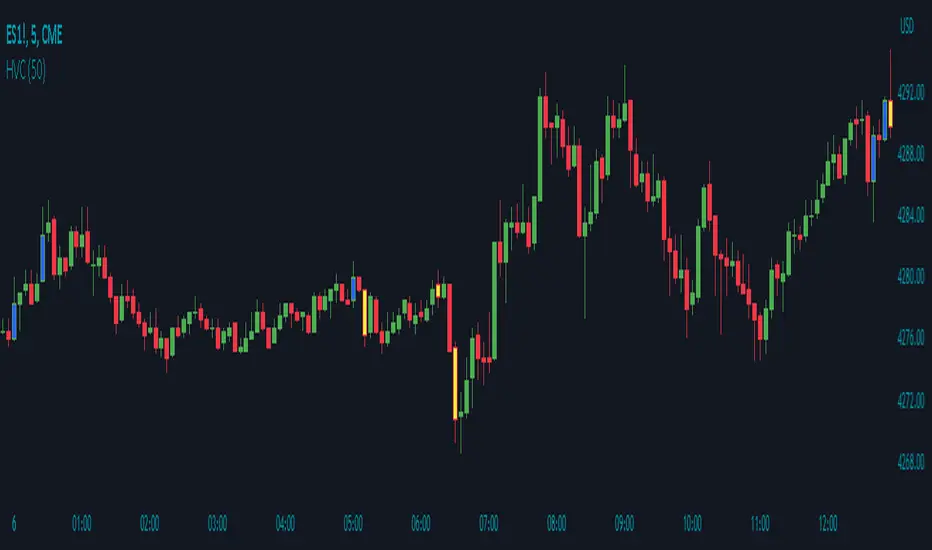
High Volume Candles by Time PeriodDescription:
The High Volume Candles indicator (HVC) is a technical analysis tool designed to identify candles with high trading volume. It allows traders to quickly spot periods of significant market activity based on volume.
How it Works:
The HVC indicator analyzes the volume of each candle in relation to the highest volume observed over a specified lookback period. The indicator compares the current volume with the highest volume within the defined lookback period and identifies candles that have volume equal to or greater than this threshold. It then distinguishes between bullish and bearish candles and assigns custom colors to highlight these high volume occurrences.
Usage:
To effectively utilize the High Volume Candles indicator, follow these steps:
1. Apply the HVC indicator to your chart by adding it from the available indicators.
2. Customize the lookback period according to your trading preferences. This parameter determines the number of previous candles to consider when calculating the highest volume.
3. Observe the candles on the chart:
- Bullish candles (blue by default) indicate periods of high volume when the closing price is higher than the opening price.
- Bearish candles (yellow by default) indicate periods of high volume when the closing price is lower than the opening price.
4. Pay attention to the color-coded volume indications within the candles, which highlight periods of high trading activity.
5. Analyze the volume patterns in conjunction with price action to identify potential trading opportunities. High volume candles often indicate increased market participation and can suggest significant price moves or reversals.
6. Combine the analysis of high volume candles with other technical analysis tools, such as trend lines, support and resistance levels, or indicators, to confirm potential trade setups.
7. Implement appropriate risk management strategies, including setting stop-loss orders and position sizing, to manage your trades effectively and protect your capital.
Volume Shaded CandlesDescription:
The Volume Shaded Candles indicator (VSC) is a technical analysis tool designed to represent price candles on a chart with transparency based on the volume traded during each candle. This overlay indicator enhances visual analysis by providing a visual representation of volume intensity.
How it Works:
The VSC indicator calculates the volume-to-transparency ratio by dividing the current volume by the highest volume within the last 10 periods. The ratio is then used to determine the shading intensity of the price candles. Higher volume relative to the recent highest volume results in lower transparency, while lower volume results in higher transparency.
Usage:
To effectively utilize the Volume Shaded Candles indicator, follow these steps:
1. Apply the Volume Shaded Candles indicator to your chart by adding it from the available indicators.
2. Configure the indicator's inputs:
- Specify the color for bullish candles using the "Bullish Color" input.
- Specify the color for bearish candles using the "Bearish Color" input.
3. Observe the shaded candles on the chart:
- Bullish candles are colored with the specified bullish color and shaded according to the volume intensity.
- Bearish candles are colored with the specified bearish color and shaded according to the volume intensity.
4. Interpret the shaded candles:
- Darker shading indicates higher volume during the corresponding candle.
- Lighter shading indicates lower volume during the corresponding candle.
5. Combine the analysis of shaded candles with other technical analysis tools, such as trend lines, support and resistance levels, or candlestick patterns, to identify potential trade setups.
6. Implement appropriate risk management strategies, including setting stop-loss orders and position sizing, to manage your trades effectively and protect your capital.
Wyckoff Wave Volume
What Is Wyckoff Wave Volume and How Does It Work?
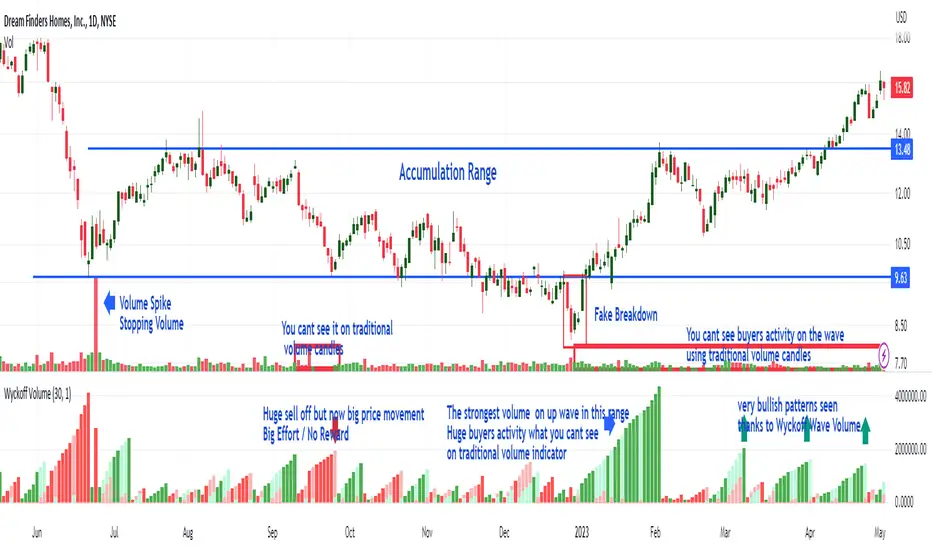
It is the cumulative sum of exchanged (sold/bought) shares or contracts on a given wave (downward or upward) in a given time plotted below the chart as volume histogram. It shows how much trade is taking place on a given wave. Values are displayed below the chart as opposed to the Wyckoff Wave Chart indicator which displays these values as numbers plotted on the chart.
As you can see in the attached chart, volume candles usually only show a single buyer and seller exposure on the chart. On a normal volume, "Volume Spike" are clearly visible, which play an important role in the analysis. However, the cumulative volume on a wave gives us much more information and shows exactly on which waves the biggest purchases or the biggest sales take place. As in the attached chart, we can see how buyers aggressively carried out the final accumulation action just before the range breakout. In the analysis of the Wyckoff method, cumulative volume is a key indicator to assess the strength or weakness of the market.
It works very similarly the other way around (distribution). Before the market changes direction after large increases, downward waves are characterized by very high volume, which is drawn on the histogram as ultra-high bars. This is information about the distribution carried out by the players - taking profits after increases or opening shorts.
Wyckoff Wave Volume for TradingView
Wyckoff Wave Volume is the best tool to identify turning points in all markets. Money plays in the market, not set ups. Therefore, in order to earn money, you must play in the same direction as the professionals! It is thanks to the observation of the volume that you can know which side the professionals (Smart Money) are on and trade in accordance with their direction. You can also "look" inside the chart and see on the numbers or graphical histogram who controls the market at a given moment - Buyer or the Seller.
Let's Start From The Beginning!
Wyckoff Wave Volume created by Richard Wyckoff in early 1930' were a breakthrough in technical analysis. In his famous technical analysis course, he told his students to "think like waves". Volume analysis was an integral part of his way of investing. During the period when Wyckoff was active in the financial markets wave volume was calculated manually, we now have a fully automated version for TradingView. Using Wyckoff Cumulative Volume you will be surprised how well it identifies turning points in all markets and on any time frame. This tool is very helpful in predicting trend changes in all markets like forex, crypto, futures and stocks.
In order for the indicator to work well on all charts, it is necessary to set the appropriate step in its settings.
"Step" is the wave setting to be taken into account when counting the volume on a given swing. The standard setting for each round is 30. This is the measure of pips on which the next upward or downward wave is to be counted. However, for individual assets, these settings can be adjusted individually.
Weis Wave-Wave TypesWeis Wave - Waves Types indicator
The Concept
This indicator has been created based on David's Weis theory of cumulative volume histograms but this indicator has been enhanced with additional wave types to be able to identify the following:
Visually identify the Effort vs Result concept (too much volume but small pip move or small volume too large pip move). Imbalance of Supply and Demand.
Be able to monitor how volume progresses within the wave, if it is increasing, decreasing or staying steady.
Identify easily the large volume waves using the emphasized volume algorithm to analyze the price reaction afterwards following the theory that Institutions participate on large volumes
What it does
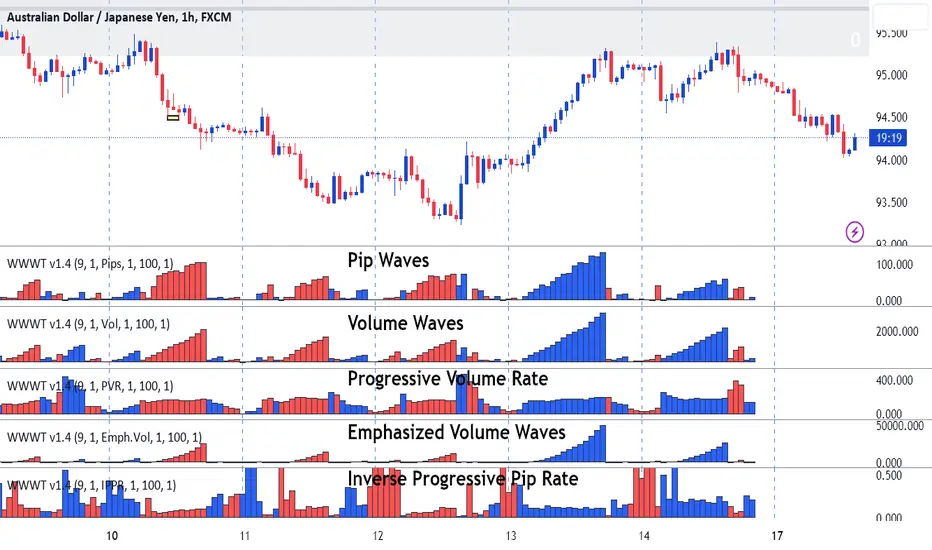
This indicator draws cumulative histograms of 5 different wave types. Up swing histogram is when price goes up and down swing histogram is when price goes down. It adds the volume of each bar within the wave swing, it adds the pips of each bar within the wave swing , it adds the time of each bar within the wave swing, it measures if the volume rate is increasing or decreasing within the wave swing and emphasizes on larger volume volume waves by increasing their size for visual purposes.
How it does it
The length of each cumulative histogram is equal to each wave price swing. The price wave sensitivity can be adjusted by AutoSensitivity parameter (min value =2 and max value=11). The larger the number the more sensitive it is, which means more wave swings will be created. The selectable values for the wave type are: Volume, Pips, Time, Progressive Volume Rate or Emphasized Volume. Furthermore the width of the cumulative histogram bars can be adjusted as well as the color of the up and the down swings. Finally divider input values are available for volume and pip to decrease large numbers on the y-axis of the histograms.
Wave Type Detailed Explanation
Volume: the indicator adds the volume of each bar within the price wave swing and creates a cumulative histogram
Pips: the indicator adds the bar distance from open to close and creates a cumulative histogram of the net pip movement of the price swing
Time: adds the time of each bar within the price wave swing and creates a cumulative histogram
Progressive Volume Rate (PVR): measures the volume rate within each wave (if volume is increasing or decreasing or staying steady as the wave progresses)
Emphasized Volume: the indicator adds the volume of each bar within the price wave swing and creates a cumulative histogram but contains an algorithm that emphasizes the large waves.
How to Use
Draw Support/Resistance and Fib - Monitor carefully the cumulative histograms at these levels. Usually supply and demand imbalance happens at this level.
First and most important of all adjust AutoSesnsitivity to get your swings correct. Getting the correct swings means waves are catching the tops and bottoms of each price wave swings.
Then identify potential trades by:
1. Comparison of cumulative Volume histogram vs Pip histogram which makes the concept of Wyckoff "Effort versus Result" identifiable, lot's of volume with small pip move = lot's of effort vs with small result. Supply and Demand imbalance.
2. Monitor Progressive Volume Rate histogram which measures if the volume rate is increasing, decreasing or remains steady within the price wave swing. This histogram indicates more or less participation as price increases or decreases within the specific wave. For example increase of volume rate as price goes up could mean more participation which could mean that sellers might be entering. Also the opposite is valid increasing volume rate as price goes down could mean that buyers are entering.
3. Emphasized Volume waves, provide a visual emphases on large volume waves only, useful for traders that like to trade with high volume trends and for traders that believe that in large volume waves large institutes participate. Trade with price trend but also with the volume trend concept.
What makes it unique
This indicator is an advance cumulative wave histogram because apart the regular volume histogram and apart form using each wave type individually to make a decision it provides more confidence and becomes more powerful when confluence is used combining the other wave types and by using the strategies mentioned above to a higher probability trade. Some examples are shown below
Example of Effort vs. Result Concept
Example of Progressive Volume Rate
Example of Emphasized Volume
Volume Forecasting [LuxAlgo]The Volume Forecasting indicator provides a forecast of volume by capturing and extrapolating periodic fluctuations. Historical forecasts are also provided to compare the method against volume at time t .
This script will not work on tickers that do not have volume data.
🔶 SETTINGS
Median Memory: Number of days used to compute the median and first/third quartiles.
Forecast Window: Number of bars forecasted in the future.
Auto Forecast Window: Set the forecast window so that the forecast length completes an interval.
🔶 USAGE
The periodic nature of volume on certain securities allows users to more easily forecast using historical volume. The forecast can highlight intervals where volume tends to be more important, that is where most trading activity takes place.
More pronounced periodicity will tend to return more accurate forecasts.
The historical forecast can also highlight intervals where high/low volume is not expected.
The interquartile range is also highlighted, giving an area where we can expect the volume to lie.
🔶 DETAILS
This forecasting method is similar to the time series decomposition method used to obtain the seasonal component.
We first segment the chart over equidistant intervals. Each interval is delimited by a change in the daily timeframe.
To forecast volume at time t+1 we see where the current bar lies in the interval, if the bar is the 78th in interval then the forecast on the next bar is made by taking the median of the 79th bar over N intervals, where N is the median memory.
This method ensures capturing the periodic fluctuation of volume.

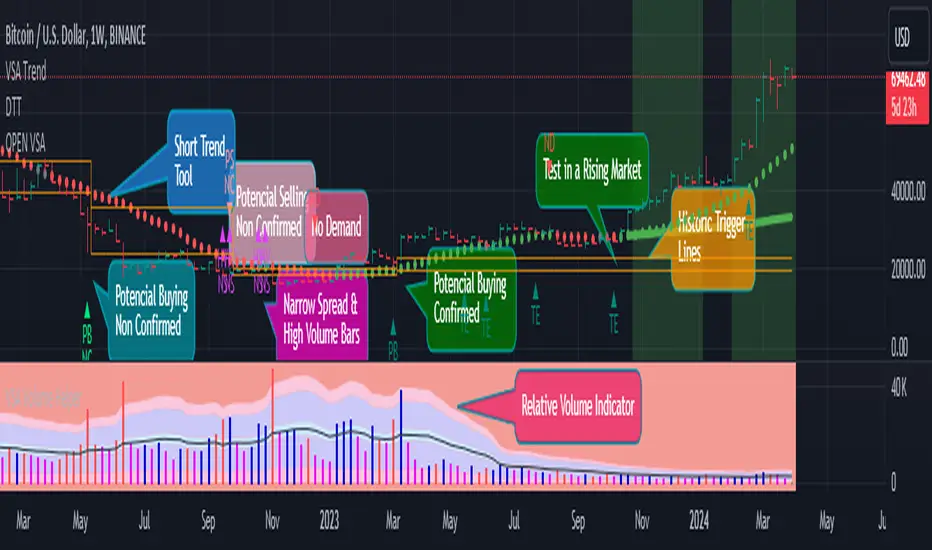
Open VsaVsa Trend is a tool that utilizes the principles of Volume Spread Analysis (VSA) to identify potential trading opportunities. This tool highlights several principles such as PB, PBNC, PS, PSNC, TE, ND, Short Trend Tool, Trigger Lines, and Multiple Alignment of Trends.
These principles assist in identifying potential buy and sell opportunities based on the relative volume of bullish and bearish bars in different trend scenarios. The Short Trend Tool is used to compare the trend and closing price to determine the color of the trend. Trigger Lines are key support and resistance levels based on PB, PBNC, PS, and PSNC bars.
The Multiple Alignment of Trends feature allows users to select between different modes such as NO, Scalping, Day Trading, and Position Trading to help identify multiple trends across various timeframes.
The Confirmation Beginning Alert feature provides users with confirmation alerts based on various filters such as ND/TE, ND/TE & Short Trend, and ND/TE & Short Trend & Trend Alignment. Using this tool in combination with an AVWAP tool can enhance its effectiveness in identifying potential trading opportunities.
-Vsa Trend is a tool that applies the principles of Volume Spread Analysis (VSA) to identify potential trading opportunities.
-The Short Trend Tool is used to compare the trend and closing price to determine the color of the trend.
-The Multiple Alignment of Trends feature enables users to choose between different modes such as NO, Scalping, Day Trading, and Position Trading to detect multiple trends across various timeframes.
-The Confirmation Beginning Alert feature provides users with confirmation alerts based on various filters such as ND/TE, ND/TE & Short Trend, and ND/TE & Short Trend & Trend Alignment.
1-PB (Potential buy confirmed. In bearish trend, a bearish bar of high relative volume with the following bullish bar)
2-PBNC (Potential buy not confirmed. In bearish trend, a bearish bar of high relative volume with the following bearish bar)
3-PS (Potential sell confirmed. In an uptrend, a bullish bar of high relative volume with the next bearish bar)
4-PSNC (Potential unconfirmed sell. In an uptrend, a bullish bar of high volume relative to the next bullish bar)
5-TE (Test confirmed. In an uptrend, a bearish bar with lower volume than the previous 2 bars, with the next bullish on average volume)
6-ND (No Confirmed Demand. In a downtrend, a bullish bar with lower volume than the previous 2 bars, with the next bearish on average volume)
7-Short Trend Tool (It is an SMA that compares its trend and the closing price to define its color
8-Trigger Lines (They are the maximum and minimum values of a PB, PBNC, PS, or PSNC bar) The idea is to look for a TEST confirmation on or NO DEMAND under that area. The above areas are also important support and resistance levels, which is why they are charted.
9-The PS/PSNC/PB/PBNC principles are always graphed as it helps us to keep in mind a possible setup in VSA. You can choose if you want to receive alerts when a principle is presented.
10. Multiple Alignment of Trends (Allows you to select between 3 modes. NO/Scalping/Day Trading and Position Trading) According to this, the "Short Trend Tool" is taken in several timeframes and when it has alignment in its trend color, it will change from color the corresponding background.
11. Confirmation Beginning Alert: Allows you to decide if you want to receive TEST or NO DEMAND Confirmation alerts under 3 filters
-ND/TE: Only the beginning is required with no short-term trend
-ND/TE & Short Trend: In addition to the principle, it takes into account the Color of the current short-term trend.
-ND/TE & Short Trend & Trend Alignment: In addition to the above, the color of the multiple alignment is taken into account to trigger an alert.
-It work better if you use in combination with a Daily VWAP tool
OBV-MACDThe OBV-MACD indicator is a momentum-based technical analysis tool that helps traders identify trend reversals and trend strength. This Pine script is an implementation of the OBV-MACD indicator that uses the On-Balance Volume (OBV) and Moving Average Convergence Divergence (MACD) indicators to provide a momentum data of OBV.
The OBV-MACD indicator uses the OBV to calculate the cumulative volume, which is then smoothed using two moving averages - fast and slow. The difference between these moving averages is plotted as a histogram, with a signal line plotted over it. A buy signal is generated when the histogram crosses above the signal line, indicating a bullish trend, while a sell signal is generated when the histogram crosses below the signal line, indicating a bearish trend.
This Pine script also includes an OBV-MACD-Donchian version that incorporates Donchian channels for the OBV-MACD. The Donchian channel is a technical analysis indicator that helps traders identify the highs and lows of an asset's price over a certain period. The OBV-MACD-Donchian version uses the OBV-MACD indicator along with the Donchian channels to provide signals that the momentum of OBV is making new high/low during that period of time.
Traders can customize the input parameters of the OBV-MACD indicator, such as the timeframe, method of calculation for the moving averages, and the lengths of the moving averages and breakout lengths. The colors of the plot can also be customized to suit the trader's preferences.

Volume Delta (Expo)█ Overview
Volume Delta (Expo) is a trading tool that measures the difference between buying and selling volume in a given market. It is a powerful tool for analyzing volume clusters and price action, as it can help traders identify the direction and strength of the trend as well as potential volume-weighted support and resistance areas.
█ How is the Volume Delta calculated?
Volume Delta is calculated by subtracting the number of contracts traded on the bid from the number of contracts traded on the ask. A positive Volume Delta indicates that more contracts are being traded on the ask than on the bid, which suggests buying pressure. A negative Volume Delta indicates that more contracts are being traded on the bid than on the ask, which suggests selling pressure.
Note, our Volume Delta (Expo) uses intrabar analysis in combination with volume clusters which is a great approximation to calculating volume delta on TradingView. The tool is equipped with a unique volume-weighted cluster function to calculate the delta trend over time as well as a dynamic trend strength calculation.
█ How to Use Volume Delta to Analyze Volume Clusters
Volume clusters are areas of high volume that indicate a potential change in price direction. Once the clusters have been identified, traders can then use Volume Delta to measure the difference between buying and selling volume in the clusters.
If the buying volume is greater than the selling volume, it indicates that the price is likely to move higher. Conversely, if the selling volume is greater than the buying volume, it indicates that the price is likely to move lower.
In addition to measuring the difference between buying and selling volume, traders can also use Volume Delta to analyze price action. By looking at the volume clusters and the corresponding price action, traders can identify potential support and resistance levels.
█ How to use
The volume delta provides insight into market sentiment, as a rise in buying volume on a positive close indicates that bullish sentiment is strengthening, while a rise in selling volume on a negative close indicates that bearish sentiment is increasing. In addition, use volume delta to identify the direction and strength of the trend.
It's common among volume traders to use volume delta to confirm trends, identify reversals, divergences, and volume-weighted support and resistance areas
Volume - divergences
If the volume delta is positive but the price trend is still bearish, it could be an indication that the current trend is weakening and a reversal may be imminent. Similarly, if the volume delta is negative but the price trend is still bullish, it could be an indication that the current trend is weakening and a reversal may be imminent.
█ Indicator Features
In addition to the main Volume Delta feature, the indicator has the following features:
Adaptive or Stability Volume Strength: Choose between adaptive or stability volume strength.
Exhausted Volume bars: Show Exhausted Volume Bars on the chart.
Divergences: Enable Regular and Hidden Volume Divergences
-----------------
Disclaimer
The information contained in my Scripts/Indicators/Ideas/Algos/Systems does not constitute financial advice or a solicitation to buy or sell any securities of any type. I will not accept liability for any loss or damage, including without limitation any loss of profit, which may arise directly or indirectly from the use of or reliance on such information.
All investments involve risk, and the past performance of a security, industry, sector, market, financial product, trading strategy, backtest, or individual's trading does not guarantee future results or returns. Investors are fully responsible for any investment decisions they make. Such decisions should be based solely on an evaluation of their financial circumstances, investment objectives, risk tolerance, and liquidity needs.
My Scripts/Indicators/Ideas/Algos/Systems are only for educational purposes!
Volume and vPOC InsightsThe vPOC or volume point of control shows where most of the volume was traded. This is important because this is where the institutions and market makers have opened their positions, and these are the ones that move the markets!
This indicator is designed to cut through the volume noise, and enable the hiding of lower volume data.
The main setting allows you to define a lookback, and obscure the candles whose volume is less than x % of the highest volume in this lookback.
Of the remaining candles, their vPOC will be displayed. There are extra settings to extend naked vPOCs, as well as the highs and lows of these high volume candles, plus an EMA based on the vPOC price levels.
I must credit quantifytools @quantifytools who allowed me to utilize his code, for finding vPOCs using lower timeframe candles - there are comments in the code also. It works perfectly so why reinvent the wheel?

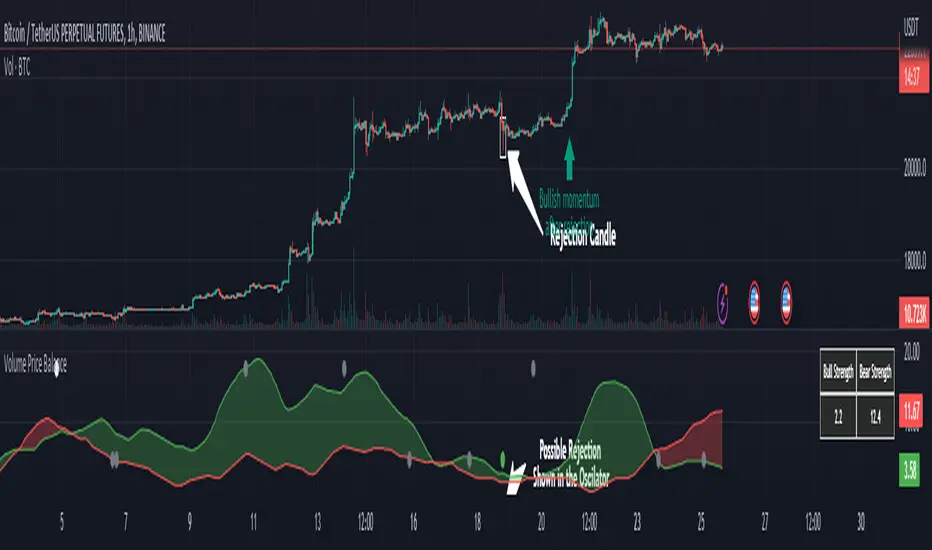
Volume Price Balance by serkany88This idea has been in my mind for a while. We all know how important volume is to technical analysis but volume and price itself doesn't mean much when volatility and momentum of the current trend is not taken into account. With this oscillator we try to combine all these factors into one indicator and provide a simplified interpretation of this relationship with spread analysis. This indicator can be used in all timeframes but higher timeframes like 1 hour and above will provide most stable results.
How it works?
This oscillator tries to analyze volume spread along with price spread based on wyckoff methods and attains certain "strength value" for each candle and it's relationship with the volume. After this calculation preferably we remove detected rejection candles from overall calculation and draw them as plots. The multipliers of the strengths can be changed from the settings.
Green Line Above Red Line = Bullish momentum stronger
Red Line Above Green Line = Bearish momentum stronger
Top circles mean possible bullish reversal candle detected. Gray is weak, White is normal and Red top circle means strong possible reversal detected.
Bottom circles mean possible bearish reversal candle detected. Gray is weak, White is normal and Green bottom circle means strong possible reversal detected.
Let's check the example below
As you can see we see a green dot appear in a somewhat weakening bullish momentum, this can mean possible reversal can happen soon and it does.
Below is a bearish example
In this example we see a possible strong reversal signal in a increasing bullish momentum and the price reacts immediately after the candle.
We also have a table that shows the current non-smoothed result of trend strength based on calculated price-volume spread at top right of the oscillator.