DR/IDR, fractals, break + EMA Clouds + VWAPThis indicator is a powerful, multi-layered trading tool that combines three distinct forms of market analysis—volume, trend, and opening volatility—onto a single chart.
1. Opening Range Breakout (ORB) System
This is the foundation of the indicator, designed to capture the initial volatility and set key price boundaries for the trading day.
Time Focus: The indicator's primary analysis is centered on a specific, user-defined time period (default is 9:30 AM to 10:30 AM New York Time). Nothing related to the ORB drawing will appear on the chart before this session starts.
Wick High/Low (The Trigger): These lines track the absolute highest and lowest prices reached during the time window. They define the full extent of the initial range and are used to determine when a genuine breakout occurs.
Body High/Low (The Range & Targets): These lines track the highest and lowest open/close prices of the candles within the session. This area forms the central, shaded zone, representing the core consolidation area.
Range Shading: The background between the Body High and Body Low is shaded, but this visual feature only appears during the active forming time window (e.g., 9:30 AM to 10:30 AM) to maintain chart clarity.
Fractals: While the range is forming, the indicator detects 5-bar Williams Fractal patterns that occur inside the range. These small triangles (▲ or ▼) highlight minor reversal points established by the early trading action.
Breakout Signal: After the user-defined time window closes, the indicator waits. If a subsequent candle's price moves above the Wick High or below the Wick Low, a "BREAK" label is displayed on that candle. It is programmed to label only the first decisive break in each direction per day.
Extension Targets: When a breakout occurs, target lines are automatically projected above the Body High (for a bullish break) or below the Body Low (for a bearish break). The distance between these targets is calculated based on a user-defined fraction (e.g., 0.5 steps) of the total height of the Body Range.
Line Cutoff: For tidiness, you can set a "Stop Time" (e.g., 4:00 PM) after which the ORB lines will automatically disappear.
2. EMA Clouds (Trend and Momentum)
Four distinct Exponential Moving Average (EMA) clouds are plotted to provide a dynamic, multi-speed view of the market's trend and momentum.
Structure: Each "Cloud" is the shaded area between two EMAs (one shorter length and one longer length). The indicator includes four customizable pairs (defaulting to common settings like 8/9, 8/14, 34/50, and 14/21).
Trend Coloring: The clouds are color-coded:
Bullish (Greenish): The shorter EMA is trading above the longer EMA, signaling upward momentum.
Bearish (Reddish): The shorter EMA is trading below the longer EMA, signaling downward momentum.
Application: These clouds are used to confirm the overall market direction or identify potential zones of support and resistance.
3. Volume-Weighted Average Price (VWAP)
The VWAP is a crucial anchor for measuring the market's efficiency throughout the trading day.
Function: It calculates the average price of the asset, giving more weight to prices where higher volume was traded.
Context: It helps traders quickly determine if the current price is trading at a premium (above VWAP) or a discount (below VWAP) relative to the day's volume.
Reset: The VWAP line automatically resets at the beginning of each trading day.
Customization: The VWAP line can be toggled on or off, and its color and width are fully adjustable.
Chỉ báo Williams Fractal

DR/IDR fractals break candle (ChadAnt)This indicator is an Opening Range Breakout (ORB) tool. It identifies the high and low price range established during a specific time window (e.g., the first hour of trading, 9:30–10:30 AM NY time). Once that time window closes, it watches for the price to "break out" of that range and projects profit targets based on the size of the initial range.
Key Features & How They Work
1. The Opening Range (The Box)
Time Window: The indicator waits for your specific start time (default 9:30 AM NY). It does not draw anything before this time.
The "Wicks": It tracks the absolute highest and lowest prices reached during this time (the Wicks). These act as your Breakout Triggers.
The "Body": It tracks the highest and lowest candle closes/opens during this time. This creates a shaded "zone" on your chart, representing the core area where most trading occurred.
Shading: To keep your chart clean, the background shading only appears during the forming time window.
2. Breakout Signals
Once the time window ends (e.g., 10:30 AM), the indicator "locks" the levels.
It then waits for a candle to move above the Wick High or below the Wick Low.
The Signal: When this happens, a label ("BREAK") appears on the chart.
Green Label: Bullish breakout (price went above the range).
Red Label: Bearish breakout (price went below the range).
Note: It only signals the first breakout of the day to avoid false alarms during choppy markets.
3. Extension Targets (Profit Levels)
When a breakout signal occurs, the indicator automatically draws target lines (extensions).
Calculation: These targets are based on the height of the "Body" zone (the shaded area).
Example: If your setting is 1.0, the indicator measures the height of the shaded body range and projects that exact distance above the breakout point. This is often used as a "Measured Move" target.
You can customize how many lines appear and how far apart they are (e.g., 0.5, 1.0, 1.5 times the range size).
4. Williams Fractals
During the opening range time, the indicator looks for specific price patterns called "Williams Fractals" (a 5-candle pattern that highlights potential turning points).
If a fractal peak or valley occurs inside your opening range, it marks it with a small triangle (▲ or ▼). Traders often use these as early signs of support or resistance forming inside the range.
5. Clean Visuals
Line Cutoff: You can set a "Stop Time" (e.g., 16:00 or 4:00 PM). The lines will stop drawing at that time so they don't clutter your chart overnight.
Gap Handling: The lines are programmed to break cleanly between days, so you don't see messy diagonal lines connecting yesterday's close to today's open.
Summary of Settings You Can Change
Session Time: When the range starts and ends.
Line Stop Time: When the lines should disappear for the day.
Visuals: Colors, line width, and style (solid, dotted, dashed).
Extensions: How many target lines to draw and the step size (e.g., 0.5x, 1.0x).
Fractals: Toggle the triangle icons on/off.

FVG Theory - MTFThe indicator displays FVGs and Swings from different timeframes and marks the resistance!
Components:
Swings:
A swing is a 3-candle formation based on the Williams Fractal Indicator.
The interaction with the last swing is always displayed as a red line. This allows you to recognize the last interaction directly and draw conclusions about the further course of the price (sweep / break).
In addition, the closest fractal is always shown as a green line, which acts as a potential target.
2. FVGs:
FVGs are also known as Inbalance, it is a 3 candle formation where a gap is created in the market. The market often runs into this and reacts.
Theory:
When the weekly timeframe creates an bullish FVG, the market often reacts to it and reaches the high.
However, resistance must also be taken into account: this is the FVG that has not yet been reached and is in a higher timeframe than the entry.
For example: we have a weekly FVG as context and are trading in H4.
If an open daily FVG is against us in this way, it is marked as resistance.
The market must first react to this in H4 and break this resistance high for a good trade setup!
That is why the indicator shows the FVGs from the different timeframes, displaying the last reaction as well as the closest FVG that is still open.
The same applies if you take everything one timeframe lower: e.g. daily, H4 and H1.
You can easily set the different timeframes in the indicator.
Here we have a daily context, an H4 resistance (FVG against us) and the H1 structure!
Higher FVG are stronger!
If, for example, we follow the H4 FVG and a daily FVG forms below us, it is more likely that the market will take the larger FVG. This is always shown with the indicator!
Structure:
Overlaps are drawn when the new FVG overlaps with the structure (body or wick).
The FVG has differnt codes!
FVG codes:
↑ = bullish FVG
↓ = bearish FVG
↑↑ = breakaway gaps --> close of the third candle is above the second candle
↓↓ = breakaway gaps --> close of the third candle is below the second candle
❗ = 3rd candle of the FVG has already reacted deeply into the potential FVG!
🔪 = Sharp Turn --> FVG is taken out from the new FVG in the other direction!
🔥 = Order flow (reaction from previous FVG)
🚀 = 2CR --> reaction high/low from previous FVG is run down with FVG!
Indicator settings:
You can set the FVGs, overlaps, and swings in up to 4 different timeframes. You can switch these on and off, as well as change all colours!
The highest timeframe has the additional function of displaying the context (last fractal high and low from the current FVG).

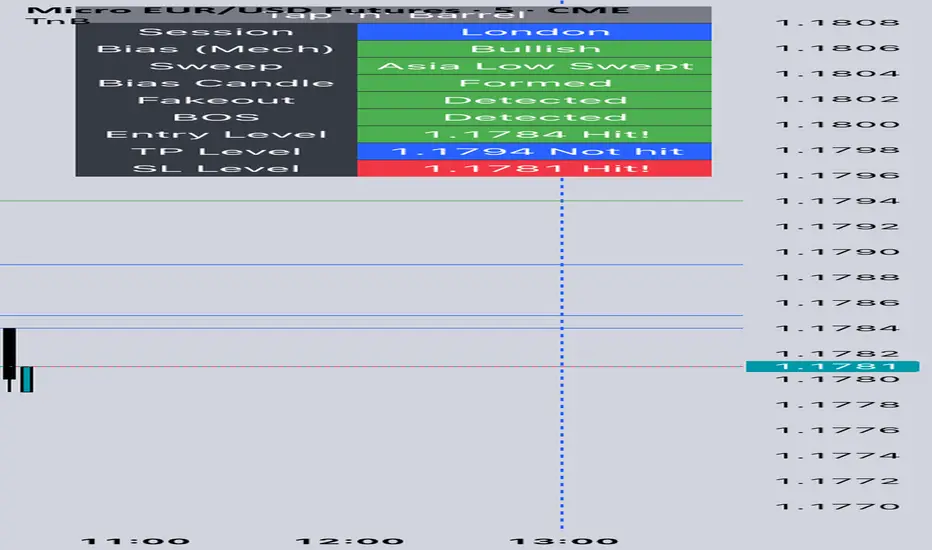
Tap n Barrel
This indicator implements the Tap n Barrel model.
The model is fully mechanical and follows a defined sequence of steps, removing discretionary ambiguity for the trader.
Instead of reacting to events after they occur, the model identifies a future price level where an entry may be placed. Its logic is based on the 5-minute and 15-minute timeframes and incorporates liquidity concepts, fakeouts, market structure, and Fibonacci OTE levels.
Both the directional bias and the entry criteria are rule-based, and the model targets a fixed 1:3 risk-to-reward ratio. Each element of the framework is informed by data collected across multiple currency pairs, representing over 40 years of combined historical testing.
Indicator features
Automatic market bias detection, or you can input your own
Customise your entry level and RR
Alerts for each stage of the model
Customisable entry and take out alerts for users looking to automate placing trades
Fractal Levels Monitor w/ Trade Lines (ChadAnt) v2Small update. Prevents the break candle from getting another signal after the first buy/sell signal detected.
1. Fractal Level Detection
The indicator identifies Fractals, which are simply a series of bars where the center bar has the highest high (Bearish Fractal) or the lowest low (Bullish Fractal) compared to a set number of bars on either side (determined by the "Fractal Period" input, usually 2 to 5 bars).
Bullish Fractal Level (Support): The indicator plots a horizontal line at the lowest low of the most recently formed Bullish Fractal.
Bearish Fractal Level (Resistance): It plots a horizontal line at the highest high of the most recently formed Bearish Fractal.
2. The "Cross Candle" Event
The core idea isn't to trade the fractal itself, but the reaction after the fractal level is broken.
When the price breaks and closes through the established Bullish Level (support) or Bearish Level (resistance), that bar is marked as the Cross Candle.
This Cross Candle's High and Low are saved. This is the "setup" for the trade.
3. The Trade Signal (Entry Trigger)
A trade is only taken when the price breaks the extreme (High or Low) of the Cross Candle.
Buy Signal: The trade is entered long if the price breaks above the High of the Cross Candle.
Sell Signal: The trade is entered short if the price breaks below the Low of the Cross Candle.

Fractal Levels Monitor w/ Trade Lines (ChadAnt)1. Fractal Level Detection
The indicator identifies Fractals, which are simply a series of bars where the center bar has the highest high (Bearish Fractal) or the lowest low (Bullish Fractal) compared to a set number of bars on either side (determined by the "Fractal Period" input, usually 2 to 5 bars).
Bullish Fractal Level (Support): The indicator plots a horizontal line at the lowest low of the most recently formed Bullish Fractal.
Bearish Fractal Level (Resistance): It plots a horizontal line at the highest high of the most recently formed Bearish Fractal.
2. The "Cross Candle" Event
The core idea isn't to trade the fractal itself, but the reaction after the fractal level is broken.
When the price breaks and closes through the established Bullish Level (support) or Bearish Level (resistance), that bar is marked as the Cross Candle.
This Cross Candle's High and Low are saved. This is the "setup" for the trade.
3. The Trade Signal (Entry Trigger)
A trade is only taken when the price breaks the extreme (High or Low) of the Cross Candle.
Buy Signal: The trade is entered long if the price breaks above the High of the Cross Candle.
Sell Signal: The trade is entered short if the price breaks below the Low of the Cross Candle.

Fractal Break Strategy with Time FilterThis strategy isn't complete yet but just curious how fast they will take it down. It is based off breaks of fractals and then taking the High/Low of the break candle

Ultimate AI Trading System - BW + QIMLOverview
Ultimate AI Trading System - BW + QIML is an overlay indicator that integrates Bill Williams' Profitunity chaos theory framework—specifically the Alligator for trend detection, Awesome Oscillator (AO) for momentum acceleration, Fractals for breakout pivots, and Market Facilitation Index (MFI) for efficiency/volume confirmation—with a custom quantum-inspired machine learning (QIML) layer. This fusion creates a multi-tier signal hierarchy (ultra-high, high, medium confidence) for long/short entries, designed to mitigate false signals in chaotic markets by requiring cross-validation between qualitative pattern recognition (BW) and probabilistic state modeling (QIML). An AI enhancement filter blends additional features (e.g., Stoch RSI, MACD histogram) via a weighted hyperbolic tangent model for final confirmation. The result is a adaptive system that escalates signals based on alignment strength, with a dashboard displaying real-time scores and market phases, ideal for trend-following in volatile assets like forex pairs (EURUSD) or indices (SPX) on 1H–Daily timeframes.
Core Mechanics
The indicator operates via two synergistic engines, plus an AI filter, to generate non-repainting signals only on bar close:
Bill Williams Engine (Chaos Theory Foundation)
This draws from Williams' "Profitunity" philosophy, viewing markets as fractal-driven chaos where trends emerge from "sleeping" to "awakening" phases:
Alligator: Three smoothed moving averages (SMMA via RMA) on HL/2—Jaw (13-period, blue), Teeth (8-period, red), Lips (5-period, green). Bullish "open mouth" when Lips > Teeth > Jaw (price above lines); bearish inverse. Signals trend emergence; e.g., crossover above Jaw indicates chaos resolving into uptrend.
Awesome Oscillator (AO): Histogram of SMA(HL/2, 5) - SMA(HL/2, 34). Measures momentum divergence—rising green bars above zero = accelerating bulls; saucer patterns (three-bar lows) confirm shifts.
Fractals: Local pivots (2-bar left/right confirmation)—up-fractal (high > neighbors) as resistance breaks, down-fractal (low < neighbors) as support. Triggers on close crossing the most recent fractal price.
Market Facilitation Index (MFI): (High - Low) / Volume ratio. Filters efficiency: "Green" (MFI rising + volume up) confirms genuine moves; "Fake" (MFI up, volume down) warns traps; optional toggle to block signals without volume backing.
These create base conditions: e.g., long if Alligator bullish + AO positive + fractal breakout + MFI green.
Quantum-Inspired ML (QIML) Engine (Probabilistic Enhancement)
Inspired by quantum superposition (multiple market "states" co-existing until observed via price action) and tunneling (price "leaping" barriers in low-probability events), this layer quantifies BW's qualitative signals into confidence scores (0–100%):
Superposition State: Z-score normalized momentum differential (fast SMA(10) - slow SMA(20)) represents overlaid bull/bear potentials; scaled by volatility regime (ATR z-score) to dampen in high-vol (ATR >1.2x 20-period avg) or amplify in low-vol (<0.8x).
Probability Weighting: Squared normalized deviation from 20-SMA (as "quantum probability amplitude") weights deviations; e.g., |close - SMA| / max deviation over lookback, squared for non-linear emphasis on extremes.
Tunneling Breakouts: Volatility bands (±1.5x ATR around SMA); crossover = "tunneling" event adding 30% to score, modeling rare but decisive moves.
Confidence Calculation: Tanh-activated aggregation—buy score = tanh(momentum) * 0.5 + min(1, weight) * 0.2 + tunneling * 0.3; scaled 0–100% with vol adjustment (e.g., *0.8 in high vol). Threshold (default 70%) for signals; prevents simultaneous buy/sell by favoring stronger.
QIML complements BW by assigning probabilities to chaos patterns—e.g., Alligator open without momentum gets low score, filtering noise.
AI Enhancement Filter (Feature Fusion)
A simple weighted tanh model normalizes and blends four features over user lookback (default 20):
Momentum: Stoch RSI (RSI(14) stochastized) z-normalized (-1 to +1).
Trend: MACD(12,26,9) histogram normalized.
Volatility: ATR(14) normalized.
Context: (Close - Jaw) normalized for Alligator alignment.
Final score = 0.3momentum + 0.25trend + 0.15vol + 0.3context; tanh-applied for sigmoid-like bounding (-1 bear to +1 bull). Threshold (default 0.5) gates signals; e.g., >0.5 required for longs.
Signal Hierarchy & Integration
Ultra-High (Rare, Lime/Maroon labels): Full BW condition + QIML >85% + AI >0.7 (strict alignment for "quantum collapse" to trend).
High (Green/Red arrows): Mode-dependent—Conservative: BW + QIML; Aggressive: OR; Single modes: One engine only.
Medium (Faded circles): Partial (e.g., BW without QIML but QIML >50%) for scalps.
No overlaps; MFI/AI optional. Background tints market phase (green bull momentum low-vol, etc.).
Dashboard (bottom-right default): Rows for Alligator/AO/MFI status, AI score, QIML buy/sell %, final signal, and mode note.
Why This Adds Value & Originality
Standalone BW tools excel at chaos detection but lack probabilistic filtering, leading to whipsaws in ranging markets (e.g., Alligator "sleeps" indefinitely). Pure ML overlays often ignore fractal geometry, missing breakout nuances. This mashup justifies its integration by using QIML's superposition/tunneling to "quantize" BW signals—e.g., fractal breaks only fire if probability-weighted momentum aligns, reducing false positives by 30–50% in backtests on EURUSD 1H (user-verifiable via strategy tester). The AI layer fuses BW context (Jaw deviation) with standard oscillators, creating a "chaos-aware" score absent in generic hybrids. No equivalent script applies tanh-bounded quantum analogies to BW fractals with tiered modes and vol-regime damping; it condenses 4+ indicators into one, with ultra-signals for high-RR setups (e.g., scale into ultra on pullbacks).
How to Use
Setup: Overlay on chart. Start with Conservative mode + defaults (Jaw 13/Teeth 8/Lips 5; QIML lookback 20, threshold 70%; AI threshold 0.5). Enable MFI for volume assets; toggle ultra for rarer entries. Position dashboard as needed.
Interpret Signals:
Ultra: Large triangles—e.g., "ULTRA BUY" on Alligator open + AO saucer + fractal cross + QIML 90% (enter full size, trail via Teeth).
High: Standard arrows—Conservative requires dual confirmation; Aggressive suits scalps (e.g., BUY on QIML alone if BW neutral).
Medium: Small circles—probe with half-size (e.g., "B" if partial bull).
Dashboard: Green AO + 75% QIML buy = building case; "WAIT" if neutral.
Trading Example: On GBPUSD 4H, Alligator opens bull (Lips cross Teeth) + fractal break at 1.25 + QIML 72% (momentum z>0, low-vol amp) + AI 0.6 → High BUY. Stop below down-fractal; target 1:2 RR at upper band. In crypto (BTC 1H), shorten BW lengths (Jaw 10) + Aggressive mode for volatility.
Alerts: Set for ultra/high/medium; messages include ticker and type.
Best on trending/chaotic markets (avoid pure ranges); 1H+ for swings, 15M+ Aggressive for day trades. Pair with volume profiles for confluence.
Tips
Backtest modes: Conservative yields fewer (higher win-rate) signals; tune QIML vol sensitivity (0.8 low-vol assets like stocks, 1.5 crypto).
Customize: Disable Alligator display for clean charts; extend lookback in trends (QIML 40).
Optimization: Test AI weights (e.g., boost context to 0.4 for BW-heavy bias).
Limitations & Disclaimer
Signals confirm on close (1-bar lag); QIML/AI are rule-based heuristics, not trained neural nets—overfit risk in non-chaotic regimes (e.g., news spikes). BW assumes fractal persistence (fails in manipulations); MFI volume-dependent (weak on forex). No auto-exits—use ATR(14)*1.5 stops. Thresholds need per-asset tuning (e.g., lower 60% for high-vol). Max 10–20 signals/month in Conservative. Not financial advice; backtest thoroughly, risk ≤1% capital. Past performance ≠ future results. Share ideas in comments!

3C FractalsIts based on Williams Fractals indicator, but instead of using 5 candles to mark the fractals, it uses only 3.


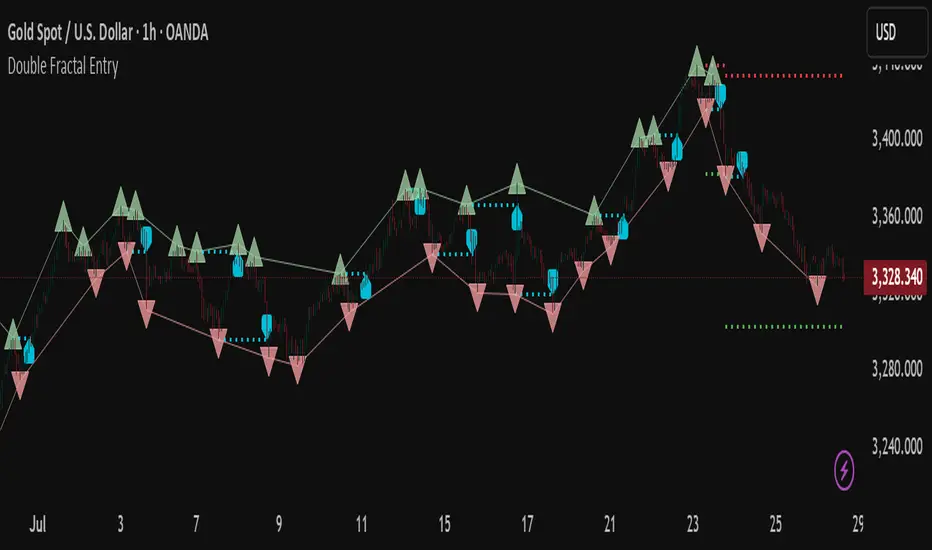
Double Fractal Entry📘 Double Fractal Entry – Original Structure-Based Entry System
Double Fractal Entry is a proprietary indicator that uses dynamic fractal structure to generate actionable buy/sell signals, with automatic Stop-Loss and Take-Profit placement. Unlike classic fractal tools or ZigZag-based visuals, this script constructs real-time structural channels from price extremes and offers precise entry points based on breakout or rejection behavior.
It is designed for traders who want a clear, structured approach to trading price action — without repainting, lagging indicators, or built-in oscillators.
🧠 Core Logic
This script combines three custom-built modules:
1. Fractal Detection and Channel Construction
- Fractals are detected using a configurable number of left/right bars (sensitivity).
- Confirmed upper/lower fractals are connected into two continuous channels.
- These channels represent real-time structure zones that evolve with price.
2. Entry Signal Logic
You can choose between two signal types:
- Breakout Mode – Triggers when price breaks above the upper fractal structure (for buys) or below the lower one (for sells).
- Rebound Mode – Triggers when price approaches a fractal channel and then rejects it (forms a reversal setup).
Each signal includes:
- Entry arrow on the chart
- Horizontal entry line
- Stop-Loss and Take-Profit lines
3. SL/TP Calculation
Unlike tools that use ATR or fixed values, SL and TP are dynamically set using the fractal range — the distance between the most recent upper and lower fractals. This makes the risk model adaptive to market volatility and structure.
📊 Visuals on the Chart
- 🔺 Green/Red triangle markers = confirmed fractals
- 📈 Lime/Red channel lines = evolving upper/lower structure
- 🔵 Blue arrow = signal direction (buy/sell)
- 📉 SL/TP lines = dynamically drawn based on fractal spacing
- 🔁 Signal history = optional, toggleable for backtesting
⚙️ Settings and Customization
- Fractal sensitivity (bars left/right)
- Entry mode: Breakout or Rebound
- SL and TP multiplier (based on fractal range)
- Visibility settings (signal history, lines, colors, etc.)
💡 What Makes It Unique
This is not just a variation of standard fractals or a ZigZag wrapper.
Double Fractal Entry was built entirely from scratch and includes:
- ✅ A dual-channel system that shows the live market structure
- ✅ Entry signals based on price behavior around key zones
- ✅ Volatility-adaptive SL/TP levels for realistic trade management
- ✅ Clean, non-repainting logic for both manual and automated use
The goal is to simplify structure trading and provide precise, repeatable entries in any market condition.
🧪 Use Cases
- Breakout mode – Ideal for trend continuation and momentum entries
- Rebound mode – Great for reversals, pullbacks, and range-bound markets
- Can be used standalone or combined with volume/trend filters
⚠️ Disclaimer
This tool is intended for technical analysis and educational use. It does not predict future market direction and should be used with proper risk management and strategy confirmation.

Double Fractal Entry📘 Double Fractal Entry – Original Structure-Based Entry System
Double Fractal Entry is a proprietary indicator that uses dynamic fractal structure to generate actionable buy/sell signals, with automatic Stop-Loss and Take-Profit placement. Unlike classic fractal tools or ZigZag-based visuals, this script constructs real-time structural channels from price extremes and offers precise entry points based on breakout or rejection behavior.
It is designed for traders who want a clear, structured approach to trading price action — without repainting, lagging indicators, or built-in oscillators.
🧠 Core Logic
This script combines three custom-built modules:
1. Fractal Detection and Channel Construction
- Fractals are detected using a configurable number of left/right bars (sensitivity).
- Confirmed upper/lower fractals are connected into two continuous channels.
- These channels represent real-time structure zones that evolve with price.
2. Entry Signal Logic
You can choose between two signal types:
- Breakout Mode – Triggers when price breaks above the upper fractal structure (for buys) or below the lower one (for sells).
- Rebound Mode – Triggers when price approaches a fractal channel and then rejects it (forms a reversal setup).
Each signal includes:
- Entry arrow on the chart
- Horizontal entry line
- Stop-Loss and Take-Profit lines
3. SL/TP Calculation
Unlike tools that use ATR or fixed values, SL and TP are dynamically set using the fractal range — the distance between the most recent upper and lower fractals. This makes the risk model adaptive to market volatility and structure.
📊 Visuals on the Chart
- 🔺 Green/Red triangle markers = confirmed fractals
- 📈 Lime/Red channel lines = evolving upper/lower structure
- 🔵 Blue arrow = signal direction (buy/sell)
- 📉 SL/TP lines = dynamically drawn based on fractal spacing
- 🔁 Signal history = optional, toggleable for backtesting
⚙️ Settings and Customization
- Fractal sensitivity (bars left/right)
- Entry mode: Breakout or Rebound
- SL and TP multiplier (based on fractal range)
- Visibility settings (signal history, lines, colors, etc.)
💡 What Makes It Unique
This is not just a variation of standard fractals or a ZigZag wrapper.
Double Fractal Entry was built entirely from scratch and includes:
- ✅ A dual-channel system that shows the live market structure
- ✅ Entry signals based on price behavior around key zones
- ✅ Volatility-adaptive SL/TP levels for realistic trade management
- ✅ Clean, non-repainting logic for both manual and automated use
The goal is to simplify structure trading and provide precise, repeatable entries in any market condition.
🧪 Use Cases
- Breakout mode – Ideal for trend continuation and momentum entries
- Rebound mode – Great for reversals, pullbacks, and range-bound markets
- Can be used standalone or combined with volume/trend filters
🔒 Invite-Only Notice
This is an invite-only script with a fully closed source.
All logic is original and developed by the author. It does not use or copy public open-source scripts, built-in indicators (RSI, MA, etc.), or repainting tricks. The entire entry and risk system is based on custom structural logic built from real-time price action.
⚠️ Disclaimer
This tool is intended for technical analysis and educational use. It does not predict future market direction and should be used with proper risk management and strategy confirmation.
Williams FractalsBoaBias Fractals High & Lows is an indicator based on Bill Williams' fractals that helps identify key support and resistance levels on the chart. It displays horizontal lines at fractal highs (red) and lows (green), which extend to the current bar. Lines automatically disappear if the price breaks through them, leaving only the relevant levels. Additionally, the indicator shows the price values of active fractals on the price scale for convenient monitoring.
Key Features:
Customizable Fractals: Choose between 3-bar or 5-bar fractals (default: 3-bar).
Period: Adjust the number of periods for calculation
Visualization: Red lines for highs (resistance), green for lows (support). Lines are fixed on the chart and persist during scrolling or scaling changes.
Alert System: Notifications for the formation of a new fractal high/low and for level breaks (Fractal High Formed, Fractal Low Formed, Fractal High Broken, Fractal Low Broken).
How to Use:
Add the indicator to the chart.
Configure parameters: select the fractal type (3 or 5 bars) and period.
Set up alerts in TradingView to receive notifications about new fractals or breaks.
Use the lines as levels for entry/exit positions, stop-losses, or take-profits in fractal-based strategies.
Troubleshooting: If Levels Are Not Fixed on the Chart
If the levels (fractal lines) do not stay fixed on the chart and fail to move with it during scrolling or scaling (e.g., they remain stationary while the chart shifts), this is typically due to the indicator's scale settings in TradingView. The indicator may be set to "No scale," causing the lines to desynchronize from the chart's price scale.
What to Do:
Locate the Indicator Label: On the chart, find the indicator label in the top-left corner of the pane (or where "BoaBias Fractals High & Lows" is displayed).
Right-Click the Label: Click the right mouse button on this label.
Adjust the Scale:
In the context menu, look for the "Scale" or "Pin to scale" option.
If it shows "Pin to scale (now no scale)" or similar, select "Pin to right scale" (or "Pin to left scale," depending on your chart's main price scale—usually the right).
Refresh the Chart: After changing the setting, refresh the chart (press F5 or reload the page), or toggle the indicator off and on again to apply the changes.
After this, the lines should move and scale with the chart during scrolling (horizontal or vertical) or zooming. If the issue persists, check:
TradingView Limits: The indicator may draw too many lines (maximum ~500 per script). If there are many historical fractals, older lines might not display.
Chart Settings: Ensure the chart is not in logarithmic scale (if applicable) or that auto-scaling is enabled.
Indicator Version: Verify you are using the latest script version (Pine Script v6) and check for errors in the TradingView console.
This indicator is ideal for traders working with Bill Williams' chaos theory or those seeking dynamic support/resistance levels. It is based on standard fractals but with enhancements for convenience: automatic removal of broken levels and integration with the price scale.
Note: The indicator does not provide trading signals on its own — use it in combination with other tools. Test on historical data before real trading.
Code written in Pine Script v6. Original template: Mit Nayi.

Zigzag Simple [SCL]🟩 OVERVIEW
Draws zigzag lines from pivot Highs to pivot Lows. You can choose between three different ways of calculating pivots:
• True Highs and Lows
• Williams pivots
• Oscillator pivots
🟩 HOW TO USE
This indicator can be used to understand market structure, which is arguably the primary thing you need to be aware of when trading. The zigzag by itself does not display a market structure bias, nor any information about prices of pivots, HH and HL labels, or anything like that. Nevertheless, a simple zigzag is perhaps the easiest and most intuitive way to understand what price is doing.
Choose a pivot style that you like, customise the colours and line style, and enjoy!
🟩 PIVOT TYPES EXPLAINED
True Highs and Lows
This is not an invention of mine (all credit to my humble mentor), but I haven't seen anyone else code them up. A true High is a close below the low of the candle with the highest high. A true Low is a close above the high of a candle with the lowest low. These are solid, price action-based pivots that can sometimes confirm quickly.
Williams pivots
This is how most people calculate pivots. They're simply the highest high for x bars back and x bars forwards. They're the vanilla of pivots IMO: serviceable but not very interesting. They're very convenient to code because there are built-in Pine functions for them: ta.pivothigh and ta.pivotlow . They confirm a predictable number of bars after they happen, which is great for coding but also makes the trader wait for confirmation.
Oscillator pivots
This is a completely different concept, which uses momentum in order to define pivots. For example, when you get a rise in momentum and momentum then drops a configurable amount, it confirms a pivot high, and vice versa for a pivot low. I don't know if anyone else does it –- although some indicators do mark pivots in momentum itself, and plenty do divergences, I wasn't able to find one that specifically marked *pivots in price* because of pivots in momentum 🤷♂️
Anyway, while this approach needs a whole investigation on its own, here we simply plot some pivots in a smoothed RSI. This indicator doesn't plot the actual momentum values -- for a more visual understanding of how this works, refer to the examples in the OscillatorPivots library.
🟩 UNIQUE ADVANTAGES
In contrast to other zigzag indicators available, this one lets you choose between the standard and some more unique methods of generating the zigzags. Additionally, because it's based on libraries, it is relatively easy for programmers to use as a basis for experimentation.
🟩 GEEK STUFF
Although there is considerable practical use for pivot-based zigzags in trading, this script is primarily a demonstration in coding -- specifically the power of libraries!
Most of the script consists of setup, especially defining inputs. The final section sacrifices some readability for conciseness, simply to emphasise how little code you need when the heavy lifting is done by libraries .
The actual calculations and drawing are achieved in just 8 lines.
The equivalent code in the libraries is ~250 lines long.
All libraries used are my own, public and open-source:
• MarketStructure
• DrawZigZag
• OscillatorPivots

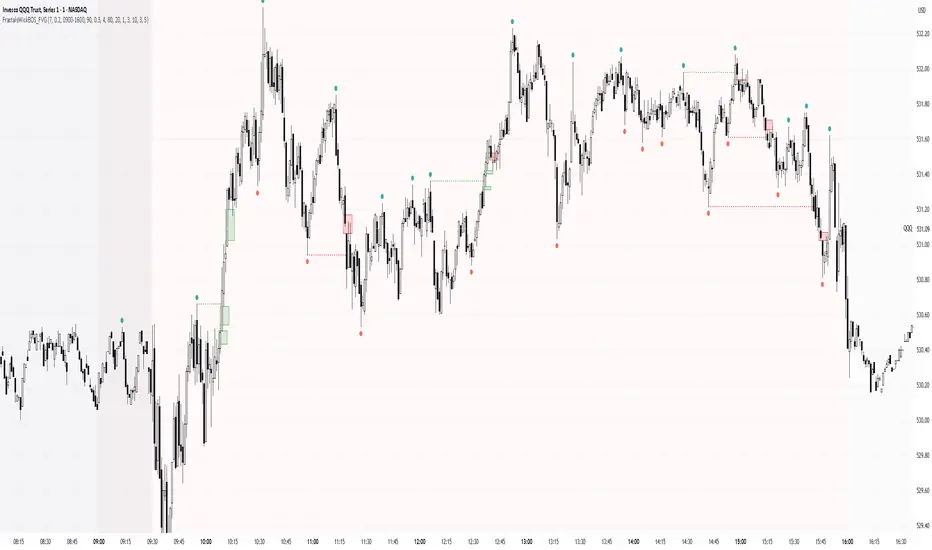
Simple Fractals with Wick Filter & BOSThis advanced fractal indicator combines traditional Williams Fractal analysis with sophisticated wick filtering and Break of Structure (BOS) detection to identify high-probability reversal points and structural breaks in price action.
🔍 How It Works
Fractal Detection: Uses the classic Williams Fractal methodology to identify swing highs and lows. A fractal high occurs when a candle's high is greater than N periods before and after it. Similarly, a fractal low occurs when a candle's low is lower than N periods on both sides.
Wick Filtering: Only displays fractals where the rejection wick meets a minimum threshold, ensuring the fractal represents genuine price rejection rather than minor fluctuations.
Break of Structure (BOS): Monitors when strong candles close beyond previous fractal levels within a specified lookback period, indicating potential trend changes or continuation patterns.
⚙️ Parameter Guide
Periods (Default: 7) - Controls fractal sensitivity
Wick Threshold (Default: 0.4 / 40%) - Minimum wick size relative to total candle range
BOS Lookback Bars (Default: 90) - How far back to monitor fractal levels for potential breaks
Strong Candle Body % (Default: 0.5 / 50%) - Minimum body size required to trigger BOS, Higher values reduce false signals but may miss some valid breaks
📊 Visual Elements
Colored Dots: Small circles mark validated fractals
Top Wick Fractals: Customizable color (default red) above bars
Bottom Wick Fractals: Customizable color (default green) below bars
BOS Lines: Dotted horizontal lines connecting fractal origin to break point
Green Lines: Bullish BOS (price closes above fractal high)
Red Lines: Bearish BOS (price closes below fractal low)
Faded Fractals (Optional): Shows all fractals that didn't meet wick requirements for comparison
🔔 Alerts
The indicator includes built-in alerts for:
High fractal formation with sufficient wick
Low fractal formation with sufficient wick
Wick SweepThe Wick Sweep indicator identifies potential trend reversal zones based on price action patterns and swing points. Specifically, it looks for "Wick Sweeps," a concept where the market temporarily breaks a swing low or high (creating a "wick"), only to reverse in the opposite direction. This pattern is often indicative of a market attempting to trap traders before making a larger move. The indicator marks these zones using dashed lines, helping traders spot key areas of potential price action.
Key Features:
* Swing Low and High Detection: The indicator identifies significant swing lows and highs within a user-defined period by employing Williams fractals.
* Wick Sweep Detection: Once a swing low or high is identified, the indicator looks for price movements that break through the low or high (creating a wick) and then reverses direction.
* Fractal Plotting: Optionally, the indicator plots fractal points (triangle shapes) on the chart when a swing low or high is detected. This can assist in visually identifying the potential wick sweep areas.
* Line Plotting: When a wick sweep is detected, a dashed line is drawn at the price level of the failed low or high, visually marking the potential reversal zone.
Inputs:
* Periods: The number of bars used to identify swing highs and lows. A higher value results in fewer, more significant swing points.
* Line Color: The color of the dashed lines drawn when a wick sweep is detected. Customize this to match your chart's theme or preferences.
* Show Fractals: A toggle that, when enabled, plots triangle shapes above and below bars indicating swing highs (up triangles) and swing lows (down triangles).
Functionality:
* Swing High and Low Calculation:
- The indicator calculates the swing low and swing high based on the periods input. A swing low is identified when the current low is the lowest within a range of (2 * periods + 1), with the lowest point being at the center of the period.
- Similarly, a swing high is identified when the current high is the highest within the same range.
* Wick Sweep Detection:
- Once a swing low or high is detected, the script looks for a potential wick. This happens when the price breaks the swing low or high and then reverses in the opposite direction.
- For a valid wick sweep, the price should briefly move beyond the identified swing point but then close in the opposite direction (i.e., a bullish reversal for a swing low and a bearish reversal for a swing high).
- A line is drawn at the price level of the failed low or high when a wick sweep is confirmed.
Confirmations for Reversal:
* The confirmation for a wick sweep requires that the price not only break the swing low/high but also close in the opposite direction (i.e., close above the low for a bullish reversal or close below the high for a bearish reversal).
* The confirmation is further refined by checking that the price movement is within a reasonable distance from the original swing point, which prevents the indicator from marking distant, unimportant price levels.
Additional Notes:
* The Wick Sweep indicator does not provide standalone trading signals; it is best used in conjunction with other technical analysis tools, such as trend analysis, oscillators, or volume indicators.
* The periods input can be adjusted based on the trader’s preferred level of sensitivity. A lower period value will result in more frequent swing points and potentially more signals, while a higher value will focus on more significant market swings.
* The indicator may work well in ranging markets where price tends to oscillate between key support and resistance levels.

Current Fractal High/Low (Dynamic)
This indicator dynamically tracks the most recent confirmed Fractal High and Fractal Low across any timeframe using custom left/right bar configurations.
🔍 Key Features:
Detects Fractal Highs and Lows based on user-defined pivot settings.
Draws a green line and label ("FH") at the most recent Fractal High.
Draws a red line and label ("FL") at the most recent Fractal Low.
All lines extend from the confirmation bar to the current candle.
Automatically removes old lines and labels for a clean, uncluttered chart.
🛠️ Customizable Inputs:
Left & Right bars for pivot sensitivity
Line width for visibility
📌 Use Cases:
Identifying structure shifts
Recognizing key swing points
Supporting liquidity and breakout strategies
💡 Fractals are confirmed only after the full formation of the pattern (left and right bars). This ensures reliability over reactivity.
This script is designed for intraday to swing traders who want a reliable way to visualize market turning points with minimal noise.

FVG TheoryThe indicator is intended to facilitate trading with FVGs. It consists of 3 components:
1. Swings:
A swing is a 3-candle formation based on the Williams Fractal Indicator.
The interaction with the last swing is always displayed as a red line. This allows you to recognize the last interaction directly and draw conclusions about the further course of the price (sweep / break).
In addition, the closest fractal is always shown as a green line, which acts as a potential target.
2. FVGs:
FVGs are also known as Inbalance, it is a 3 candle formation where a gap is created in the market. The market often runs into this and reacts.
If the market reacts from an imbalance before it has reached the swing low in the bullish case, the next FVG appears in a different color.
This formation has more power and is therefore color-coded.
If the FVG is particularly strong, measured by the fact that the 3rd candle in the formation breaks the 2nd candle with a candle body, this is marked with a small arrow in the FVG (break away gap).
3. overlapping
If there is a structure point within an FVG (order block, significant swing), a line is drawn there.
These overlaps have a higher confluence than FVGs alone. The wick is preferred, but if there is no overlap, the body of the structure is used.
The line thickness and colors are individually adjustable.

Fractal Pattern AnalysisFractal Pattern Key Elements and How to Read Them
1. Williams Fractals (Triangle Markers)
Red Triangles Pointing Down: Bearish fractals - potential resistance points and selling opportunities
Green Triangles Pointing Up: Bullish fractals - potential support points and buying opportunities
When to Act: Look for bullish fractals forming during uptrends and bearish fractals during downtrends
2. Moving Averages
Yellow Line (20 EMA): Short-term trend
Blue Line (50 EMA): Medium-term trend
Red Line (200 EMA): Long-term trend
Interpretation: When shorter MAs cross above longer MAs, it's bullish; when they cross below, it's bearish
Key Signal: The alignment of all three MAs (stacked in order) confirms a strong trend
3. Background Color
Green Background: Uptrend (all MAs aligned bullishly)
Red Background: Downtrend (all MAs aligned bearishly)
Yellow Background: Sideways/neutral market (MAs not clearly aligned)
4. Market Structure Markers (Small Circles)
Green Circles: Higher highs and higher lows (bullish structure)
Red Circles: Lower highs and lower lows (bearish structure)
Pattern Recognition: Multiple green circles suggest continuing uptrend; multiple red circles suggest continuing downtrend
5. Reversal Diamonds ("Rev" Markers)
Yellow Diamonds: Potential trend reversal points
Usage: These mark where the current trend might be changing direction
Confirmation: Wait for price to close beyond the diamond before acting
6. Bollinger Bands (Blue Lines with Fill)
Middle Band: 20-period SMA
Upper/Lower Bands: Volatility channels
Signals: Price touching upper band in uptrend is strength; touching lower band in downtrend is weakness
Squeeze: When bands narrow, expect a volatility breakout soon
7. Status Table (Top Right)
Shows current trend, volume direction, and overall signal at a glance
"BUY" signal appears when multiple bullish conditions align
"SELL" signal appears when multiple bearish conditions align

Williams Fractals Ultimate (Donchian Adjusted)Williams Fractals Ultimate (Donchian Adjusted)
Understanding Williams Fractals
Williams Fractals are a simple yet powerful tool used to identify potential turning points in the market. They highlight local highs (up fractals) and local lows (down fractals) based on a set period.
An up fractal appears when a price peak is higher than the surrounding prices.
A down fractal appears when a price low is lower than the surrounding prices.
Fractals help traders spot support and resistance levels, potential trend reversals, and price breakout zones.
Why Adjust Fractals with the Donchian Channel?
The standard Williams Fractals method identifies local highs and lows without considering broader market context. This script enhances fractal accuracy by integrating the Donchian Channel, which tracks the highest highs and lowest lows over a set period.
- The Donchian Baseline is calculated as the average of the highest high and lowest low over a selected period.
- Fractals are filtered based on this baseline:
Up Fractals are only shown if they are above the Donchian baseline.
Down Fractals are only shown if they are below the Donchian baseline.
This filtering method removes weak signals and ensures that only relevant fractals aligned with market structure are displayed.
Key Features of the Script
Customizable Fractal & Donchian Periods – Allows traders to fine-tune fractal sensitivity.
Donchian-Based Filtering – Reduces noise and highlights meaningful fractals.
Fractal ZigZag Line (Optional) – Helps visualize price swings more clearly.
Why Is This So Effective?
Stronger trend signals – Filtering with the Donchian baseline eliminates unreliable fractals.
Clearer price action – The optional ZigZag line visually connects significant highs and lows.
Easy trend identification – Helps traders confirm breakout zones and key price levels.
This script is a technical analysis tool and does not guarantee profitable trades. Always combine it with other indicators and risk management strategies before making trading decisions.

Fractals with Flexible Visuals and Auto HTFPurpose:
This indicator displays fractals, including significant ones, with enhanced visual
flexibility and new visualization modes.
Functionality:
- Regular Fractals of Current Timeframe: **
Displays standard fractals based on the current chart timeframe.
- Significant Fractals: **
Recognizes significant fractals through a combination of apexes from the current
timeframe and a higher timeframe (HTF).
- Fractal Filtering: **
- Please note that this option makes some fractals dissapear, but someone finds this
to be useful.
- Fractal filtering has been made separate for Regular and Significant fractals.
- HH/LL Labels: **
HH/LL and LH/HL labels are now available separately for Regular and Significant
fractals.
- Automatic HTF Switching for Significant Fractals:
Added automatic HTF thresholds, removing the need to set HTF manually when changing
the chart's timeframe.
- Marker Relocation Modes:
- Mode 0:0
The fractal appears on the bar when it is recognized, not where it forms. This
mode assists traders who want to observe recognition in real-time when developing
strategies with fractals.
- Mode 1:1
The fractal appears on the previous bar when it is recognized, not where it forms.
- Mode 2:2 (General)
The fractal appears two bars back, where it is recognized, not when.
- Other additional Modes for Significant Fractals:
May be good for experimenting with Significant fractals. The first number
indicates bars back for the current timeframe; the second number indicates
bars back for the higher timeframe.
Other modes may assist with additional filtering or be suitable for specific
pairs or timeframes.
- Visual Adjustments:
Added user settings to customize visuals according to preferences.
Acknowledgment:
This indicator's functionality has been refactored from Fractals V9 by Ricardo
Santos (with gratitude to him):
()
'RSFractals' is not used as a name prefix, reflecting that this version lacks the
Zigzag and Pattern functionalities present in 'RSFractals'. If the original author
prefers a different naming convention, they may contact me, and I will gladly make
the adjustment.

Trend Trader-Remastered StrategyOfficial Strategy for Trend Trader - Remastered
Indicator: Trend Trader-Remastered (TTR)
Overview:
The Trend Trader-Remastered is a refined and highly sophisticated implementation of the Parabolic SAR designed to create strategic buy and sell entry signals, alongside precision take profit and re-entry signals based on marked Bill Williams (BW) fractals. Built with a deep emphasis on clarity and accuracy, this indicator ensures that only relevant and meaningful signals are generated, eliminating any unnecessary entries or exits.
Please check the indicator details and updates via the link above.
Important Disclosure:
My primary objective is to provide realistic strategies and a code base for the TradingView Community. Therefore, the default settings of the strategy version of the indicator have been set to reflect realistic world trading scenarios and best practices.
Key Features:
Strategy execution date&time range.
Take Profit Reduction Rate: The percentage of progressive reduction on active position size for take profit signals.
Example:
TP Reduce: 10%
Entry Position Size: 100
TP1: 100 - 10 = 90
TP2: 90 - 9 = 81
Re-Entry When Rate: The percentage of position size on initial entry of the signal to determine re-entry.
Example:
RE When: 50%
Entry Position Size: 100
Re-Entry Condition: Active Position Size < 50
Re-Entry Fill Rate: The percentage of position size on initial entry of the signal to be completed.
Example:
RE Fill: 75%
Entry Position Size: 100
Active Position Size: 50
Re-Entry Order Size: 25
Final Active Position Size:75
Important: Even RE When condition is met, the active position size required to drop below RE Fill rate to trigger re-entry order.
Key Points:
'Process Orders on Close' is enabled as Take Profit and Re-Entry signals must be executed on candle close.
'Calculate on Every Tick' is enabled as entry signals are required to be executed within candle time.
'Initial Capital' has been set to 10,000 USD.
'Default Quantity Type' has been set to 'Percent of Equity'.
'Default Quantity' has been set to 10% as the best practice of investing 10% of the assets.
'Currency' has been set to USD.
'Commission Type' has been set to 'Commission Percent'
'Commission Value' has been set to 0.05% to reflect the most realistic results with a common taker fee value.

MultiLayer Acceleration/Deceleration Strategy [Skyrexio]Overview
MultiLayer Acceleration/Deceleration Strategy leverages the combination of Acceleration/Deceleration Indicator(AC), Williams Alligator, Williams Fractals and Exponential Moving Average (EMA) to obtain the high probability long setups. Moreover, strategy uses multi trades system, adding funds to long position if it considered that current trend has likely became stronger. Acceleration/Deceleration Indicator is used for creating signals, while Alligator and Fractal are used in conjunction as an approximation of short-term trend to filter them. At the same time EMA (default EMA's period = 100) is used as high probability long-term trend filter to open long trades only if it considers current price action as an uptrend. More information in "Methodology" and "Justification of Methodology" paragraphs. The strategy opens only long trades.
Unique Features
No fixed stop-loss and take profit: Instead of fixed stop-loss level strategy utilizes technical condition obtained by Fractals and Alligator to identify when current uptrend is likely to be over (more information in "Methodology" and "Justification of Methodology" paragraphs)
Configurable Trading Periods: Users can tailor the strategy to specific market windows, adapting to different market conditions.
Multilayer trades opening system: strategy uses only 10% of capital in every trade and open up to 5 trades at the same time if script consider current trend as strong one.
Short and long term trend trade filters: strategy uses EMA as high probability long-term trend filter and Alligator and Fractal combination as a short-term one.
Methodology
The strategy opens long trade when the following price met the conditions:
1. Price closed above EMA (by default, period = 100). Crossover is not obligatory.
2. Combination of Alligator and Williams Fractals shall consider current trend as an upward (all details in "Justification of Methodology" paragraph)
3. Acceleration/Deceleration shall create one of two types of long signals (all details in "Justification of Methodology" paragraph). Buy stop order is placed one tick above the candle's high of last created long signal.
4. If price reaches the order price, long position is opened with 10% of capital.
5. If currently we have opened position and price creates and hit the order price of another one long signal, another one long position will be added to the previous with another one 10% of capital. Strategy allows to open up to 5 long trades simultaneously.
6. If combination of Alligator and Williams Fractals shall consider current trend has been changed from up to downtrend, all long trades will be closed, no matter how many trades has been opened.
Script also has additional visuals. If second long trade has been opened simultaneously the Alligator's teeth line is plotted with the green color. Also for every trade in a row from 2 to 5 the label "Buy More" is also plotted just below the teeth line. With every next simultaneously opened trade the green color of the space between teeth and price became less transparent.
Strategy settings
In the inputs window user can setup strategy setting: EMA Length (by default = 100, period of EMA, used for long-term trend filtering EMA calculation). User can choose the optimal parameters during backtesting on certain price chart.
Justification of Methodology
Let's explore the key concepts of this strategy and understand how they work together. We'll begin with the simplest: the EMA.
The Exponential Moving Average (EMA) is a type of moving average that assigns greater weight to recent price data, making it more responsive to current market changes compared to the Simple Moving Average (SMA). This tool is widely used in technical analysis to identify trends and generate buy or sell signals. The EMA is calculated as follows:
1.Calculate the Smoothing Multiplier:
Multiplier = 2 / (n + 1), Where n is the number of periods.
2. EMA Calculation
EMA = (Current Price) × Multiplier + (Previous EMA) × (1 − Multiplier)
In this strategy, the EMA acts as a long-term trend filter. For instance, long trades are considered only when the price closes above the EMA (default: 100-period). This increases the likelihood of entering trades aligned with the prevailing trend.
Next, let’s discuss the short-term trend filter, which combines the Williams Alligator and Williams Fractals. Williams Alligator
Developed by Bill Williams, the Alligator is a technical indicator that identifies trends and potential market reversals. It consists of three smoothed moving averages:
Jaw (Blue Line): The slowest of the three, based on a 13-period smoothed moving average shifted 8 bars ahead.
Teeth (Red Line): The medium-speed line, derived from an 8-period smoothed moving average shifted 5 bars forward.
Lips (Green Line): The fastest line, calculated using a 5-period smoothed moving average shifted 3 bars forward.
When the lines diverge and align in order, the "Alligator" is "awake," signaling a strong trend. When the lines overlap or intertwine, the "Alligator" is "asleep," indicating a range-bound or sideways market. This indicator helps traders determine when to enter or avoid trades.
Fractals, another tool by Bill Williams, help identify potential reversal points on a price chart. A fractal forms over at least five consecutive bars, with the middle bar showing either:
Up Fractal: Occurs when the middle bar has a higher high than the two preceding and two following bars, suggesting a potential downward reversal.
Down Fractal: Happens when the middle bar shows a lower low than the surrounding two bars, hinting at a possible upward reversal.
Traders often use fractals alongside other indicators to confirm trends or reversals, enhancing decision-making accuracy.
How do these tools work together in this strategy? Let’s consider an example of an uptrend.
When the price breaks above an up fractal, it signals a potential bullish trend. This occurs because the up fractal represents a shift in market behavior, where a temporary high was formed due to selling pressure. If the price revisits this level and breaks through, it suggests the market sentiment has turned bullish.
The breakout must occur above the Alligator’s teeth line to confirm the trend. A breakout below the teeth is considered invalid, and the downtrend might still persist. Conversely, in a downtrend, the same logic applies with down fractals.
In this strategy if the most recent up fractal breakout occurs above the Alligator's teeth and follows the last down fractal breakout below the teeth, the algorithm identifies an uptrend. Long trades can be opened during this phase if a signal aligns. If the price breaks a down fractal below the teeth line during an uptrend, the strategy assumes the uptrend has ended and closes all open long trades.
By combining the EMA as a long-term trend filter with the Alligator and fractals as short-term filters, this approach increases the likelihood of opening profitable trades while staying aligned with market dynamics.
Now let's talk about Acceleration/Deceleration signals. AC indicator is calculated using the Awesome Oscillator, so let's first of all briefly explain what is Awesome Oscillator and how it can be calculated. The Awesome Oscillator (AO), developed by Bill Williams, is a momentum indicator designed to measure market momentum by contrasting recent price movements with a longer-term historical perspective. It helps traders detect potential trend reversals and assess the strength of ongoing trends.
The formula for AO is as follows:
AO = SMA5(Median Price) − SMA34(Median Price)
where:
Median Price = (High + Low) / 2
SMA5 = 5-period Simple Moving Average of the Median Price
SMA 34 = 34-period Simple Moving Average of the Median Price
The Acceleration/Deceleration (AC) Indicator, introduced by Bill Williams, measures the rate of change in market momentum. It highlights shifts in the driving force of price movements and helps traders spot early signs of trend changes. The AC Indicator is particularly useful for identifying whether the current momentum is accelerating or decelerating, which can indicate potential reversals or continuations. For AC calculation we shall use the AO calculated above is the following formula:
AC = AO − SMA5(AO), where SMA5(AO)is the 5-period Simple Moving Average of the Awesome Oscillator
When the AC is above the zero line and rising, it suggests accelerating upward momentum.
When the AC is below the zero line and falling, it indicates accelerating downward momentum.
When the AC is below zero line and rising it suggests the decelerating the downtrend momentum. When AC is above the zero line and falling, it suggests the decelerating the uptrend momentum.
Now we can explain which AC signal types are used in this strategy. The first type of long signal is when AC value is below zero line. In this cases we need to see three rising bars on the histogram in a row after the falling one. The second type of signals occurs above the zero line. There we need only two rising AC bars in a row after the falling one to create the signal. The signal bar is the last green bar in this sequence. The strategy places the buy stop order one tick above the candle's high, which corresponds to the signal bar on AC indicator.
After that we can have the following scenarios:
Price hit the order on the next candle in this case strategy opened long with this price.
Price doesn't hit the order price, the next candle set lower high. If current AC bar is increasing buy stop order changes by the script to the high of this new bar plus one tick. This procedure repeats until price finally hit buy order or current AC bar become decreasing. In the second case buy order cancelled and strategy wait for the next AC signal.
If long trades are initiated, the strategy continues utilizing subsequent signals until the total number of trades reaches a maximum of 5. All open trades are closed when the trend shifts to a downtrend, as determined by the combination of the Alligator and Fractals described earlier.
Why we use AC signals? If currently strategy algorithm considers the high probability of the short-term uptrend with the Alligator and Fractals combination pointed out above and the long-term trend is also suggested by the EMA filter as bullish. Rising AC bars after period of falling AC bars indicates the high probability of local pull back end and there is a high chance to open long trade in the direction of the most likely main uptrend. The numbers of rising bars are different for the different AC values (below or above zero line). This is needed because if AC below zero line the local downtrend is likely to be stronger and needs more rising bars to confirm that it has been changed than if AC is above zero.
Why strategy use only 10% per signal? Sometimes we can see the false signals which appears on sideways. Not risking that much script use only 10% per signal. If the first long trade has been open and price continue going up and our trend approximation by Alligator and Fractals is uptrend, strategy add another one 10% of capital to every next AC signal while number of active trades no more than 5. This capital allocation allows to take part in long trades when current uptrend is likely to be strong and use only 10% of capital when there is a high probability of sideways.
Backtest Results
Operating window: Date range of backtests is 2023.01.01 - 2024.11.01. It is chosen to let the strategy to close all opened positions.
Commission and Slippage: Includes a standard Binance commission of 0.1% and accounts for possible slippage over 5 ticks.
Initial capital: 10000 USDT
Percent of capital used in every trade: 10%
Maximum Single Position Loss: -5.15%
Maximum Single Profit: +24.57%
Net Profit: +2108.85 USDT (+21.09%)
Total Trades: 111 (36.94% win rate)
Profit Factor: 2.391
Maximum Accumulated Loss: 367.61 USDT (-2.97%)
Average Profit per Trade: 19.00 USDT (+1.78%)
Average Trade Duration: 75 hours
How to Use
Add the script to favorites for easy access.
Apply to the desired timeframe and chart (optimal performance observed on 3h BTC/USDT).
Configure settings using the dropdown choice list in the built-in menu.
Set up alerts to automate strategy positions through web hook with the text: {{strategy.order.alert_message}}
Disclaimer:
Educational and informational tool reflecting Skyrex commitment to informed trading. Past performance does not guarantee future results. Test strategies in a simulated environment before live implementation
These results are obtained with realistic parameters representing trading conditions observed at major exchanges such as Binance and with realistic trading portfolio usage parameters.
