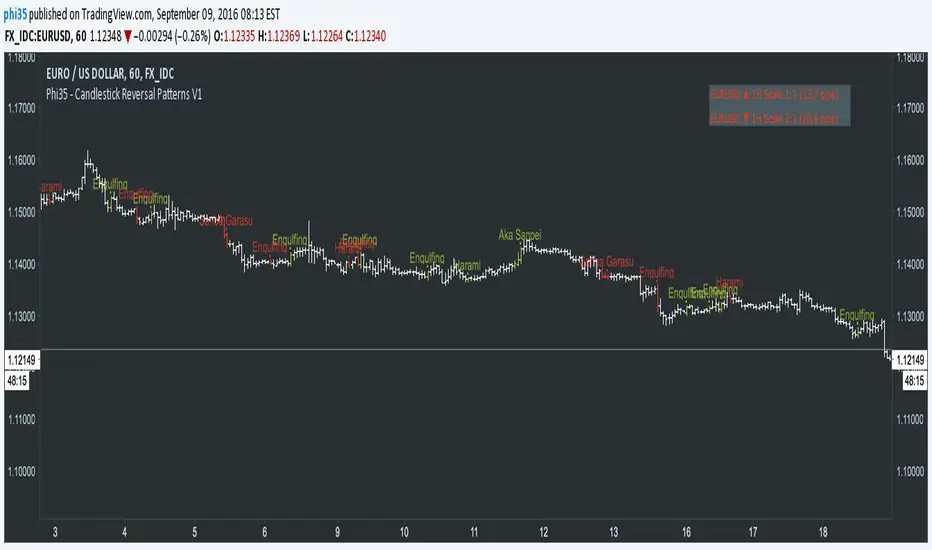
Phi35 - Candlestick Reversal Patterns V1 ©Candlestick Reversal Pattern V1 by Phi35 - 9rd September 2016 ©
Check also my " Candlestick Continuation Pattern " indicator which will follow soon!
Do not modify the code without my permission!
If there is an issue or any suggestions, feel free to contact me on the link below
www.tradingview.com
www.tradingview.com
It seems to work well but still no guarantee on completeness!
RISK WARNING! PAST PERFORMANCE IS NOT NECESSARILY INDICATIVE OF FUTURE RESULTS. IN MAKING AN INVESTMENT DECISION, TRADERS MUST RELY ON THEIR OWN EXAMINATION OF THE ENTITY MAKING THE TRADING DECISIONS!
Wait always for confirmation (next opening price or closing price)!!
RECOGNIZABLE REVERSAL PATTERNS
01.Engulfing
02.Harami
03.Piercing Line
04.Morning Star
05.Evening Star
06.Belt Hold
07.Three White Soldiers
08.Three Black Crows
09.Three Stars in the South
10.Stick Sandwich
11.Meeting Line
12.Kicking
13.Ladder Bottom
Although the Engulfing and Harami Patterns are important but can occur too often and give false signals, I give you the option to turn them completely off.
X-indicator
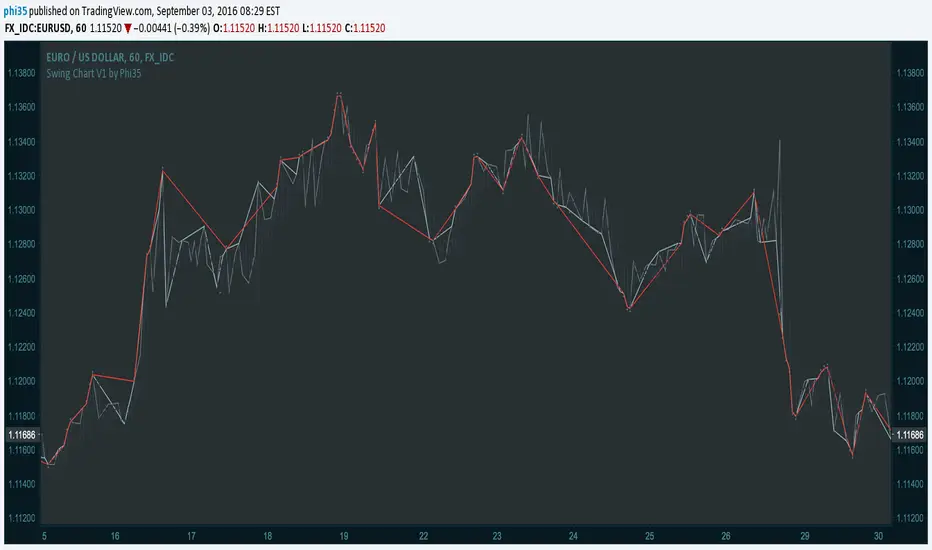
Swing Chart V1 by Phi35 © With this indicator, which plots the swing chart of the 3 degrees, swing traders can automate their work of tracking the right bars.
How it works:
Minor Degree (one bar) (gray)= If the current high is higher than the previous high or the current low is lower than the previous low.
Intermediate Degree (two bar) (baby blue)= If the current high is higher than previous and the penultimate high etc.
Main Degree (three bar) (red)= If the current high is higher than the previous, the penultimate and the high before penultimate high etc.
Alert:
On crossover there will be an alert (popup with a message) and in addition you will see "diamonds" on the place where the crossover took place
If there is an issue or any suggestions, feel free to contact me. Do not modify the code without permission.
Swing Chart V1 by Phi35 ©
HEIKIN ASHI COLOUR CHANGE ALERTThis can be used to trigger an alert if Heikin Ashi bar changes color :)

One White Soldier StudyThis shows a green indicator on this study (17Jun & 15Aug on TRN) when a bullish candle opens and closes above the prior day's bearish candle, ignoring gap ups. This will only show in the DAILY chart, not intraday.

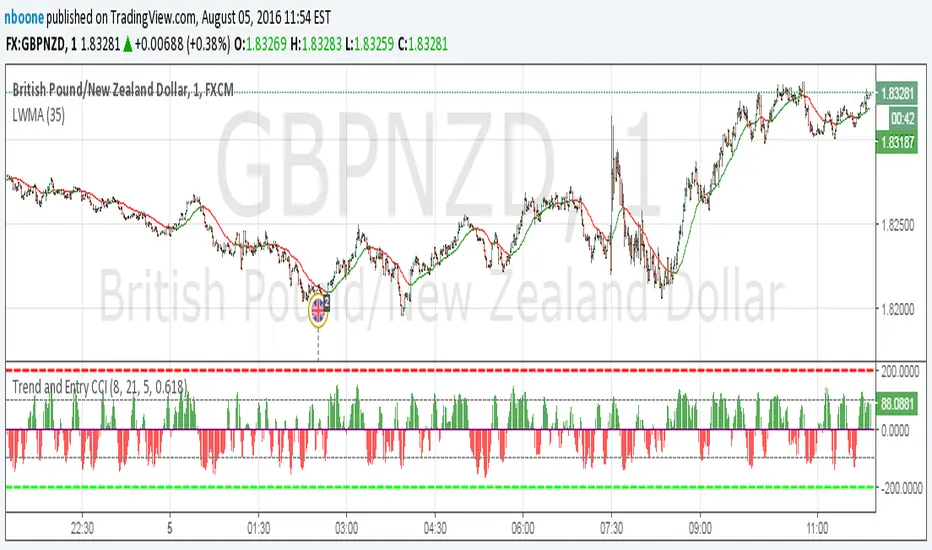
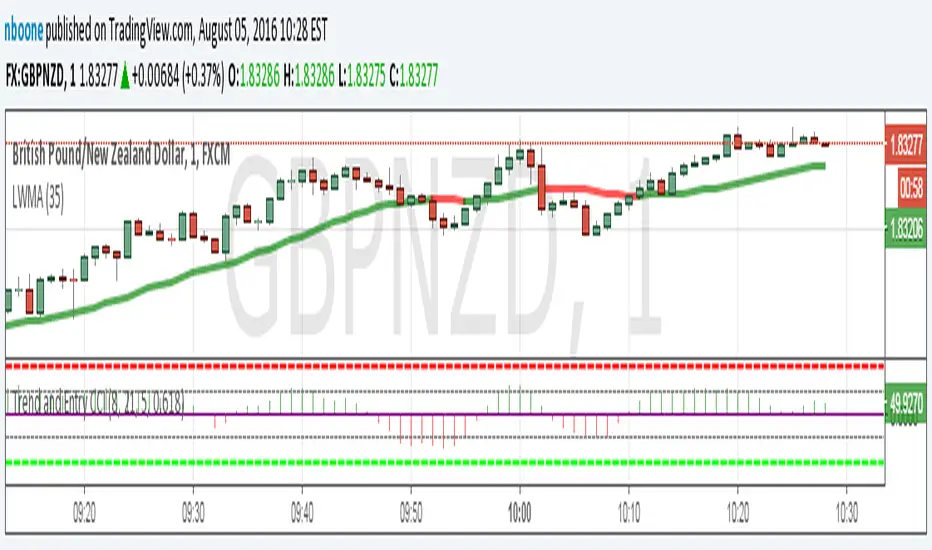
LWMA w/ Color ChangeLinear Weighted MA that changes colors based on slope.
Green = slope up from last bar
Yellow = slope is 0 from last bar
Red = slope down from last bar
This time with the ability to change the period.
LWMA w/ Color ChangeLinear Weighted MA that changes colors based on slope.
Green = slope up from last bar
Yellow = slope is 0 from last bar
Red = slope down from last bar
Bullish and Bearish EngulfingIndicator that changes the bar's color to green if there is a Bullish Engulfing or Red if there a Bearish Engulfing Patterns.

Bullish and Bearish EngulfingIndicator that changes the bar's color to green if there is a Bullish Engulfing or Red if there a Bearish Engulfing Patterns.
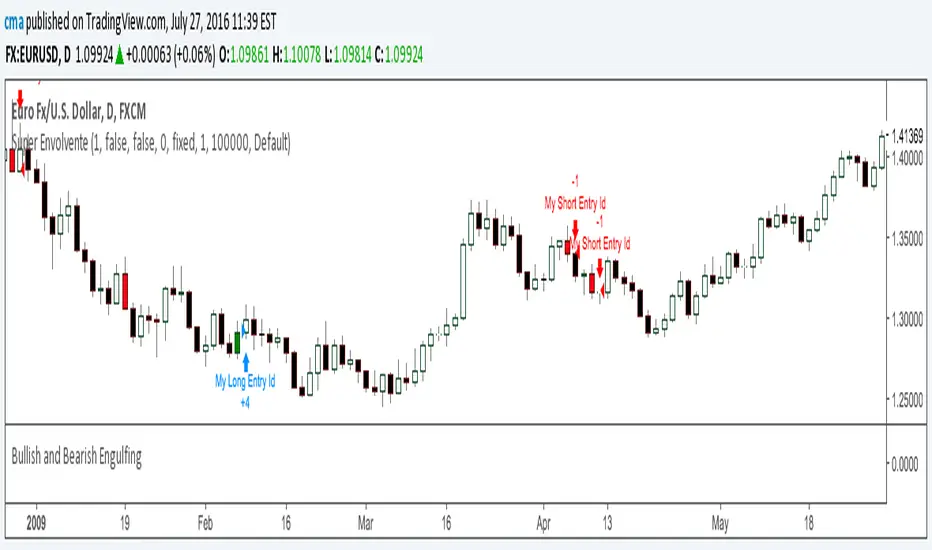
Super Envolvente (Bullish y Bearish)Identificador de Super-envolventes (SE), se encarga de darle un color verde a la SE alzista (Bullish) verde y rojo a la bajista (Bearish).

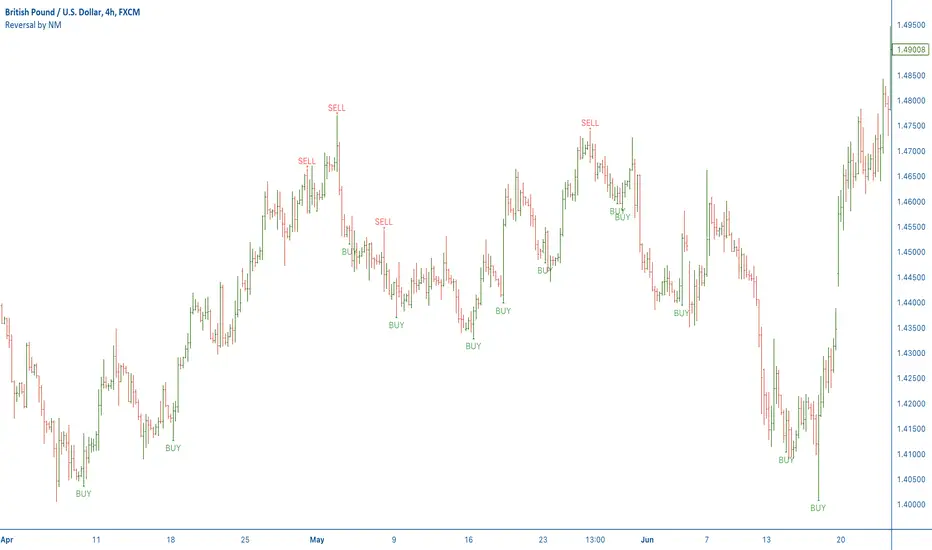
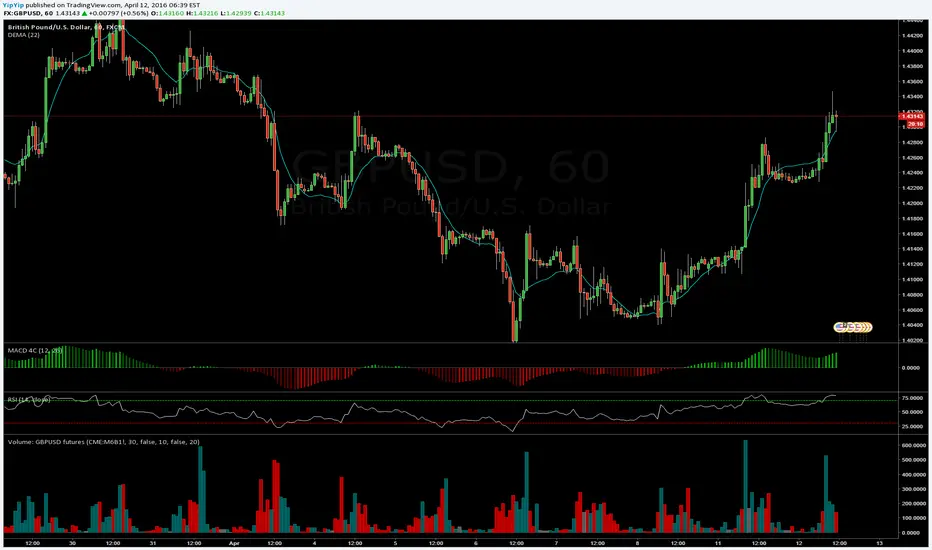
[NM] Reversal Candles v01Reversal candles are a very easy way to identify a turn in trend, this indicator has some specific additional conditions for the reversal candle.
BUY Signal reversal candle
Low of current candle exceeds low of previous candle
Low of current candle is lowest for last 7 candles
High of current candle exceeds high of previous candle
Close of current candle is in the upper 50% of the range of this candle
SELL Signal reversal candle
High of current candle exceeds high of previous candle
High of current candle is Highest for last 7 candles
Low of current candle exceeds low of previous candle
Close of current candle is in the lower 50% of the range of this candle
How do I trade it ? (example buy signal)
Wait for close of the candle and the BUY signal
Put a buy stop entry 5 pips above the high of the candle
Put a stop loss 5 pips below the low of the candle
Calculate difference between entry and stop loss and set your target that number of pips above the entry for a 1:1 RR trade*
Wait for your your target or stop loss to be triggered
* Alternatively, you can take 50% of the profit at the 1st (1:1 RR) profit target, move your stop to break even and let the rest of the position run for a higher potential profit.
Further advice on use
Personally I always look for some additional confirmation like a support or resistance level, a bounce of the EMA or a fibonacci level, but please feel free to add additional filters to make the strategy even more effective. I would strongly advise to backtest your strategy first so you can fine tune it and have confidence in trading it. Forward testing on a demo account before going live, although it takes longer, can be a worthy alternative. Works better on higher time frames.
How do you use it ?
Please leave a note in the comment section below to let me know if you use the indicator and how. There's definitely not just one way to use the indicator so I'm curious about your feedback.
To apply the script to your chart, just add it to your favourites so you can easily find it in the Indicators list.
Kindly leave me a thumbs up if you like this indicator or support my work, and do not hesitate to visit my other indicators. Thanks for your visit
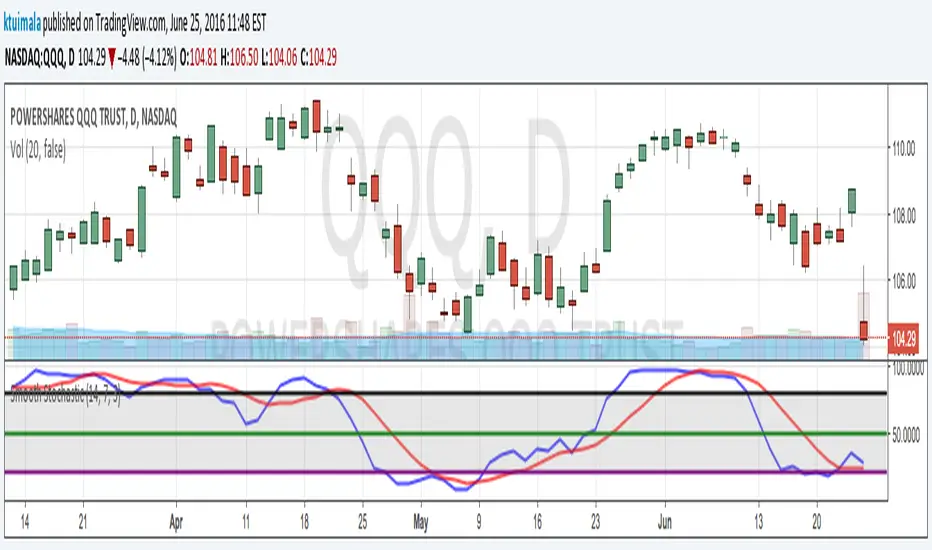
KT_Smooth_StochasticI normally don't publish my indicators. However, I couldn't find a smoothed stochastic on TradingView officially or unofficially. This is a standard implementation of a smoothed Fast Stochastic where %K and %D are calculated and then smoothed by n periods. This helps to reduce chop and gives better extreme signals.
I have defaulted the indicator to use commonly used settings where %K is over 14 periods, %D is over 7 period, and the smoothing factor is 3 periods. I have also defaulted the extreme lines to an upper band of 80, mid band of 50, and lower band of 20. However, my favorite settings are %K = 10, %D = 10, Smooth = 3, upper band = 75, mid band = 50, and lower band = 25.
RSI Oversold/UndersoldThe study script will place GREEN BUY arrows BELOW oversold conditions and RED SHORT arrows ABOVE overbought conditions. You can configure the period
Most RSI(14) indicators use a 14-period, I prefer a 5-period. The period, overbought and oversold periods are settings that can easily be changed by adding this study to your chart and clicking the "gear" icon next to the study inside your chart.

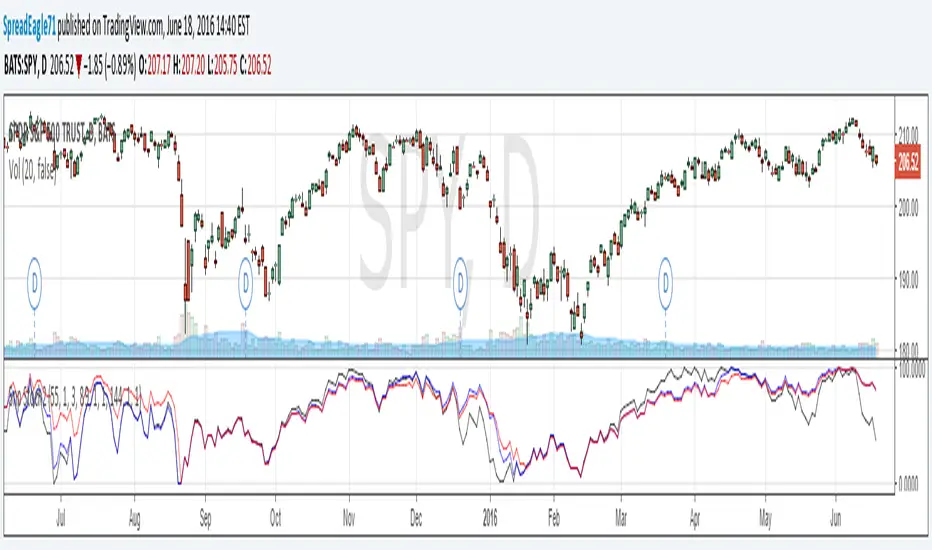
Sniper Stochastics 2 Sniper Stochastics 2 is like the other one - a triple stochastics consisting of different lengths, in this case 55,89,144.
One thing I noticed was that the stochastics lines can be a kind of divergence detector with the slow (red), medium (blue) and fast(black) lines making breakaways once they converge.
For example, if the lines are together and the black line starts to diverge upwards, it means that there is a positive divergence which will happen quickly and then end. The blue and the red lines are longer term divergences.
I wanted to share this one and the unique and interesting use of divergences with this indicator.
Ichimoku PanOptic TM-V1Modified Ichimoku indicator with signals from PanOptic Method by User Ichimoku_Trader.

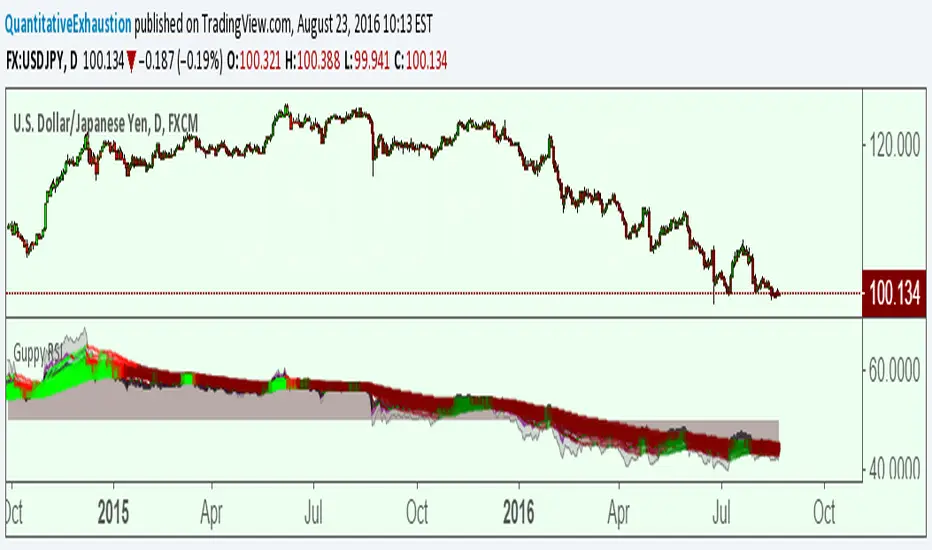
Intramarket Correlator L-O-L-A excerptHere we have an intramarket correlator taken as an excerpt from the L-O-L-A institutional trading system.
The plot displayed on the screen is the correlation index of the correlated security plotted against the security data series. Suggest simple line plots of contrasting colors.
When the plot is below the security price this is an indication of a strong negative correlation. When the plot is above the security price this is indicative of a strong positive correlation.
Provided for free by Tarzan at tradingview. or noprism@hushmail.com
plz contact for more information on L-O-L-A
*** Past performance is not necessarily indicative of future results ***
Life is like a moving picture
Nothing in life is a permanent fixture
Ray Davies


Forex Trading Sessions with Daylight Savings TimeV1 - Max WarrenDifferent version of the CM one but everything is configurable and easy to manage.
Daylight savings may also be toggled, I cannot automatically toggle it yet but hopefully with a pine update I will be able to.
It had the four main sessions but version two could possibly have all of them as optional toggles
Hope it is useful

UPdate Intraday TS ,BB + Buy/Sell +Squeeze Mom.+ adx-dmiUpdate version with legend on data window and new colors on the squeeze mom idicator

Intraday TS ,BB + Buy/Sell +Squeeze Mom.+ adx-dmiIntraday 5+ min indicator/strategy. Mix of indicator as BB, Ema , Roc , adx/dmi with buy and TP/SL point. All in 1 indicator easy to use . Just look the color chnge and the shape add the the bars


Aroon OscillatorAroon Oscillator for the Aroon indicator. This creates an oscillator out of the upper and lower aroon plots.
