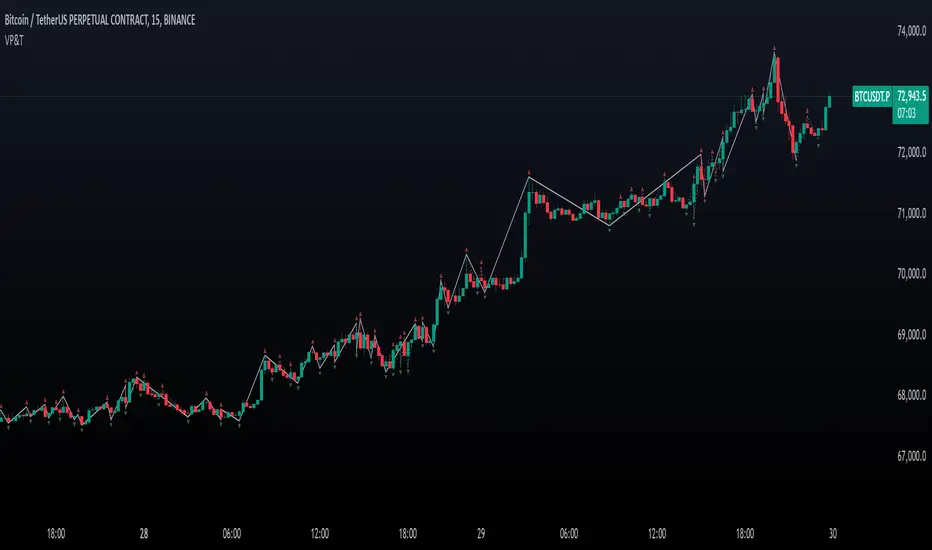
█ OVERVIEW This indicator displays zigzag based on high and low, which is using user-defined types (UDT) or objects . █ CREDITS LonesomeTheBlue █ FEATURES 1. Label can be resized. 2. Label can be display either short (Eg : HH, LL, H, L, etc) and long (Eg : Higher Low, etc) 3. Color can be customized either contrast color of chart background, trend...
🔥 Overview 🎯 This Double BOS(Break Of Structure) Confirm indicator combined ma-based BOS and classic BOS to achieve a more credible BOS signal . it works well in most symbols with 2 parameters finetune. 🎯 It's a enhanced version compare with previous script. 🎯 at the same time, I keep D-BOS and BOS separately, you can use them in combination...
█ OVERVIEW MATHR3E WAVES automatically draws Elliott Waves on your charts with their potential associated targets. █ CONCEPTS Disclaimer MATHR3E RETRACEMENTS indicator is intended for advanced traders and may fit your profile, whether you are a day trader or a long-term investor. It was originally developed by a renowned market analyst and documented in...
Japanese below / 日本語説明は英文の後にあります。 ------------------------- This indicator that automatically displays Fibonacci from each High & Low based on 3 Zigzags. It's useful for multi-timeframe analysis. For example, Fibonacci calculated from the high and low prices (Zigzag 3 Period=100) of the upper timeframe can be displayed on the lower timeframe. Also, you can set...
Strategy Time!!! Have built this on my earlier published indicator Band-Zigzag-Trend-Follower . This is just one possible implementation of strategy on Band-Based-Zigzag . 🎲 Notes Experimental prototype. Not financial advise and strategy not guaranteed to make money despite backtest results Not created or tested for any specific instrument or...
The "Zig Zag Stochastic" indicator is an indicator that uses a combination of zigzag pivot points and exponential smoothing to calculate a stochastic-like oscillator. The indicator starts by identifying pivot high and pivot low points in the price data using the Zigzag indicator. These pivot points are then used to calculate the scale_price, which is a ratio of...
We defined new method to derive zigzag last month - which is called Channel-Based-Zigzag . This script is an example of one of the use case of this method. 🎲 Trend Following Defining a trend following method is simple. Basic rule of trend following is Buy High and Sell Low (Yes, you heard it right). To explain further - methodology involve finding an...
🎲 Overview 🎯 This Zigzag indicator build based on different MA such as EMA/HMA/RMA/SMA, support multi-timeframe setting . you can get customer zigzag indicator by change short/long ma length and high-timeframe config(5m/15m/30m/1h/2h) in any symbol. 🎲 Indicator design logic 🎯 entired logic is simple and code looks complex, I‘ll explain core logic here, code...
Hello Everyone, Wish you all Merry X-Mas and happy new year. Lets start 2023 with fresh new strategy built on Wolfe Indicator. Details of the indicator can be found here 🎲 Wolfe Concept Wolfe concept is simple. Whenever a wedge is formed, draw a line joining pivot 1 and 4 as shown in the chart below: For simplicity, we will only consider static value for...
Japanese below / 日本語説明は英文の後にあります。 Based on "ZigZag++" indicator by DevLucem. Thanks for the great indicator. ------------------------- This indicator that displays the candle count (bar count) at the peaks of Zigzag . It also displays the price of the peaks. You can easily count candles (bars) from peak to peak. Helpful for candles (bars) in cycle theory. This...
This indicator is perfect for traders who want to identify trend lines on a chart. It draws higher low uptrends and lower high downtrends, making it easy to see where the trend is going. You can also customize the settings to fit your needs, making it the perfect tool for your trading arsenal. With this new tool, you can easily customize your experience to get...
|Tradingview wants a Description| The Indicator Helps with finding: - higher highs - lower highs - lower lows - higher lows - trends It also shows with a triangle what candle confirmed the Pivot points And it just looks fancy (my opinion)
Still experimental. Extending further on the divergence backtest results - in this script we try to project next 2 pivots (including one unconfirmed pivot) 🎲 Previous experiments 1. Divergence-Backtester 2. Divergence-Backtester-V2 🎲 Additions Apart from collecting the stats on number of occurrences of HH, HL, LH, LL - this script also keeps track of...
This script will show up to three different timeframe structure based on fractal formation (combination of three candles where the middle one is the highest). You can modify each of the timeframes (called factors in the script). These factors emulate the fractal formations on the timeframe specified (in minutes). I found that at least for me a combination of...
Further attempts to study divergence impact on price in shorter terms. Previous study can be found here: In this script, we are trying to gather the stats based on last two pivot state together. For example, Individual table of Pivot High Projection is as explained below: But, by looking at the bigger picture, we can further estimate following things...
There is n number of possible ways in which we can backtest divergence and this is just a start :) In this script, we are trying to count how many times the pivots made HH, HL, LH, LL after a particular divergence state. An example of using data is as below: The script keeps track of each pivot sentiment and resulting next pivot state. As mentioned in the...
Another ZigZag, yes... I believe though this concerns another angle/principle, therefore I wanted to share How does it work? Given: source for level breach -> close X breaches -> 3 Let's say this is the latest found 'lower low' (LL - blue dot under bar): This bar has been triggered because 3 bars closed under low...
Micro zigzag is created based on similar concepts as that of zigzag but by using lower timeframe intra-bar data. The lines join candle's high/low points but also depict how the price movement within the candle happened. That is, if the high of the candle is reached first, pivot from previous candle join the high first and then low and vice versa. The output can...