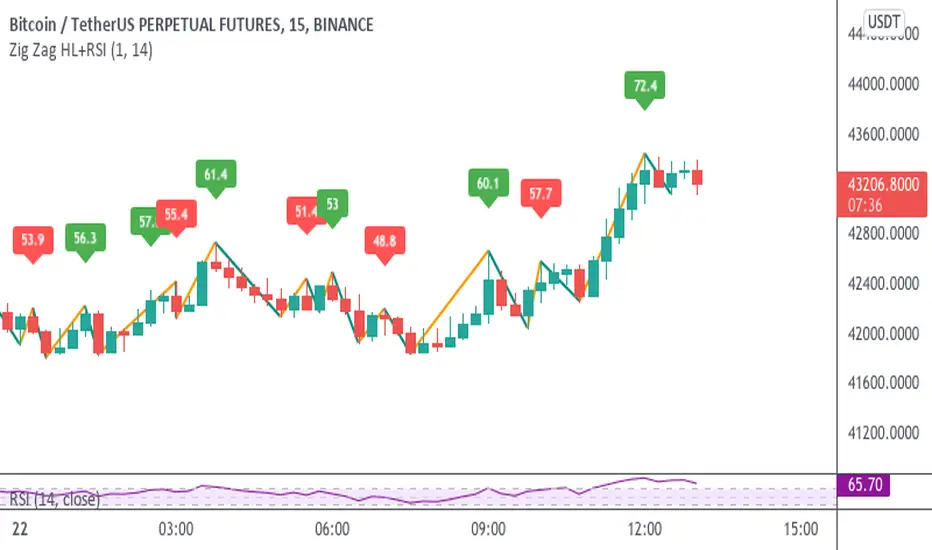
This indicator shows the cumulative volume between the zigzag segments (waves) and plots the percentage change from the previous segment Let us know if there's anything you'd like added to the indicator and please click LIKE to support us
Automatic Double Top and Double Bottom pattern scanner for any time frame, any asset. Simple to use, just add to your chart, and set the size (in the settings) for the patterns you want to find. • Green patterns are bullish • Red patterns are bearish • Alerts are available for when new patterns are displayed • When a pattern completes (at the neckline), it...
This is a simple end of the day indicator based on open and close values. Angles: Identifying narrow angles helps to find breakouts Maximum angle = High chance of reversal Minimum angle = Chance of breakouts on the next day or upcoming days. Price Flow: I personally use price flow to simplify the flow of candlestick chart and to identify breakouts using...
Chart Patterns and Harmonic Patterns using just ONE indicator! This is a automatic scanner for well know patterns like Head and Shoulder to get started. I'm planning to add more patterns in the near future. It works as follows: 1. Is going to plot the pattern on the chart, lines in blue 2. Is going to show you when the pattern has finished to form, triangles and...
This is a automatic scanner for well know patterns like Head and Shoulder to get started. I'm planning to add more patterns in the near future. It works as follows: 1. Is going to plot the pattern on the chart, lines in blue 2. Is going to show you the long entry or short entry bar, red or green triangles 3. It is possible to get an alert when there is a...
Hello friends, I wish you all the best. you can measure the success rate of this indicator from the past. It works well on indicator stocks. You can use the time period you want I'd like to talk a little bit about how it works The lower channel support shows the upper channel resistance. sub-channel is expected when it goes under the channel When it rises above...
Automatically detects and visually displays Harmonic patterns, from small ZigZag to large ZigZag. 17 types of Harmonic patterns are supported. Pattern5-0 / 3Drive / AB=CD / Gartley / Butterfly / Bat / A Bat / Crab / Deep Crab / Cypher / A Cypher / Shark / Nenstar / A Nenstar / Dragon / Black Swan / White Swan The alert function allows you to be alerted when a...
Automatically detects and visually displays Harmonic patterns, from small ZigZag to large ZigZag. 5 types of Harmonic patterns are supported. Pattern5-0 / 3Drive / AB=CD / Gartley / Butterfly 小さいZigZagから大きいZigZagまですべてを監視し、ハーモニックパターンを自動的に検出します。 検出したパターンは視覚的に表示されます。 インジケーターは、5種類のハーモニックパターンに対応しています。 Pattern5-0 / 3Drive / AB=CD / Gartley / Butterfly
This indicator will divide the area to Buy and Sell zone with a divider line. Buy Signal The Buy signal will only appear when current price is above the divider line and break the last peak zigzag. Buy signal with yellow color indicate that momentum value is between 0 and below the value set at Low Momentum Upper. Buy signal with green color indicate that...
Hello Traders! This is the script that finds Consolidation Zones in Realtime. How it works? - The script finds highest/lowest bars by using "Loopback Period" - Then it calculates direction - By using the direction and highest/lowest bar info it calculates consolidation zones in realtime - If the length of consolidation area is equal/greater than user-defined...
This script follows the Zig Zag pattern of price movement, based on the Weis Wave Volume indicator. The Weis Wave Volume shows the cumulative volume from the lowest point of the price swing to the highest point (or vice versa) The user has the option to change the Trend Detection Length of the indicator to adjust the swings frequency (from say 5 to any value...
Function: labelling recent highs and lows automatically. Easy and clean. In this example, we can see the previous low of the ticker is around 105.5, the previous high is around 120. We can set up our entries and exits by referring to the last lows and highs. Users can adjust the searching bar range by themselves.
The 2nd version of this indicator came quick :) As the previous one, it draws swings on the candlesticks, based on price action and RSI. Also in the labels you can see if the current swing is higher or lower to the previous one. HH stands for Higher High LL stands for Lower Low LH means Lower High HL means Higher low THIS IS NOT A STRATEGY, this is for TREND...
This indicator draws swings on the chart based on the RSI configured within. The swings are drawn from Overbought to Oversold or vice-versa. Logic: From Overbought to Oversold, a line is drawn from the highest price before oversold to the lowest price of the oversold. The labels can be deactivated from the style menu, it was easier for me to implement this way...
Strategy: Fibonacci + RSI: - Intraday trading strategy (Scalping). Time Frames Tested with best Results: 30 Minutes. 5 Minutes. 15 Minutes. 1 Minute Indicators Used: RSI (30 / 70) Fibonacci (1 - 0.784) How it Works: Once the Price Hits the 1 or -1 Fibonacci Level and bounces a little bit, It checks the RSI if Over Bought or Over...
Zig Zag script that uses local minimums and maximums as pivot points. It can be used as a source for pattern recognition.