Mua DODOUSDT: Trung hạnMua DODOUSDT: Ngắn hạn
Entry: 0.1835
SL: 0.165 (10.08%)
TP: 0.37 (101.6%)
Xin cám ơn quý anh chị và các bạn đã theo dõi bài viết.
DEFI

Mua C98USDT ngắn hạnMua C98USDT: (R:R=4)
Entry: 3.790
Stop Loss: 3.725 (1.72)
Take Profit: 4.080 (7.65%)
Xin cám ơn quý anh chị và các bạn đã theo dõi bài viết

Dom BTC đang cho thấy điều gì? 2.3.2021Tuần cuối tháng 2.2021 là tuần SML nặng của Altcoin và Defi. Khi BTC điều chỉnh 25% từ đỉnh 58K thì đa phần Altcoin và Defi giảm trung bình 30-40-50% từ đỉnh.
Xu hướng kế tiếp BTC.D sẽ thế nào? Thật sự quá khó đoán đường đi của Dom BTC nhưng chúng ta có thể đưa ra vài điều lưu ý sau:
1- BTC vẫn đang trong chu kỳ điều chỉnh.
- Nên Dom BTC thấp và đang có tính hiệu tích lũy thì càng rủi ro khi danh mục chúng ta hold altcoin và defi nhiều. Vì khi BTC giảm 1 thì altcoin và Defi và 1.5-2.
- Quan điểm của tôi BTC vẫn rủi ro lớn trong giai đoạn này, nghĩa là có thể giảm giá bất kỳ lúc nào
- Dom BTC đột ngột lên 64 thì altcoin và Defi / BTC sẽ giảm mạnh.
=> Nên hãy tự cân đối danh mục cho phù hợp giữa BTC, Altcoin / Defi, USD.
2 - Altcoin và Defi có vượt qua đỉnh cũ hay đây chỉnh là sóng hồi thì quá khó nói. Nhưng có vài điều có thể thấy.
- Một số Altcoin và Defi đã tăng overbought, và xuất hiện phân kỳ ở giai đoạn cuối 2.2021
- Vẫn cón KB Altcoin và Defi sẽ breakout đỉnh cũ và tiếp tục tăng mạnh. Nhưng quan điểm tôi thì cần thời gian để thực hiện điều này. Nếu có xảy ra thì tháng 4.2021 sẽ thích hợp vì cần thời gian tích lũy.
Giải pháp tôi hiện tại theo quan điểm cá nhân:
- Chỉ lướt sóng BTC và Altcoin, ko phải lúc hold nếu không có điểm entry tốt từ đầu or giữa mùa Uptrend.
- Cân đối danh mục giữa BTC, Altcoin và Defi. Không quá mơ mộng giai đoạn này.
Đây không phải lời khuyên đầu tư, hãy tự cân đối quản lý vốn. Chúc bạn may mắn!
Hãy cho ý kiến bạn bên dưới cùng thảo luận nhé!

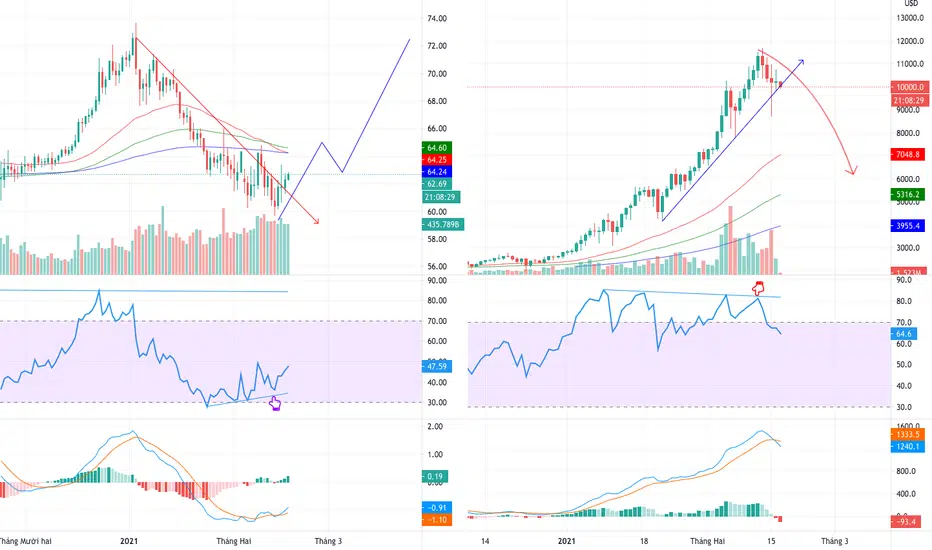
Dòng tiền trader sẽ đổ vào BTC hay Altcoin, Defi?Tôi thường ít phân tích chi biết chỉ số Bitcoin Dominance (BTC.D hay gọi tắt DOM BTC or DOM), lý do chỉ số này trong ngắn hạn thường xuyên flash Dump Pump.
Hôm nay chúng ta làm bài so sánh chỉ số DOM BTC với Defi, để xem dòng tiền của NĐT (Trader) sẽ về đâu?
1- Chart D1 DOM BTC đang tạo đỉnh ngắn hạn, sẽ Pump lên retest lại VKC 65-66, đây là vùng khá mạnh - trước đây DOM mất vùng này là lúc Altcoin và Defi pump mạnh.
- RSI D1 đang tạo phân kỳ dương, DOM khả năng tiếp tục xu hướng tăng. Cặp Altcoin / BTC sẽ giảm, Defi / BTC càng giảm mạnh - đặc biệt cặp nào đã tăng quá nóng.
- DOM gặp VKC 65-66 sẽ Pullback retest trước khi đi tiếp, đây là lúc có thể bắt đáy Altcoin target sóng hồi khoảng 15-20%.
2- Chart D1 DOM Defi đã tạo đỉnh ngắn hạn
- Một số Defi tăng nóng đã giảm 20-30% từ đỉnh cách đây khoảng 1 tuần. Dự đoán sẽ còn tiếp tục giảm và sideway để tìm VHT mới.
Dự đoán:
- Dòng tiền sẽ tiếp tục đổ vào Bitcoin khi BTC Breakout 55-60K
- Dòng tiền sẽ tiếp tục rút khỏi Defi, và một số Defi đang dò VHT
- Altcoin top như BCH, LTC, ETH, LINK... sẽ theo sát BTC, chỉ cần BTC dừng lập tức Altcoin sẽ pump mạnh theo.
Hãy phân bổ vốn theo xu hướng thị trường, biết khi nào hoán đổi BTC <> Altcoin / Defi sẽ giúp bạn tối ưu hóa lợi nhuận.
Quan điểm của tôi lúc này sẽ dành 30-50% vốn vào BTC, còn lại canh bắt Altcoin.
Đây không phải lời khuyên đầu tư, hãy tự quản lý vốn. Chúc may mắn!
- James Crypto-

FTT ( Coin sàn tiềm năng và đáng Hold nhất Q4/ 2020 )FTX được mọi người biết đến với những cặp giao dịch Bull and Bear
- Hiện tại FTX thu hút mọi ánh mắt của giới đầu tư khi những dự án SOL hay điển hình gần đây là IEO SRM bùng nổ mạnh mẽ và là dự án IEO thành công về mọi mặt của FTX.
- Cách đây không lâu khi SUSHI một dự án mà tạo ra nhiều ý kiến trái chiều từ giới đầu tư, và đặc biệt khi CZ ( Binance ) đưa ra những phát ngôn làm cộng đồng phẫn nộ. FTX đã có một động thái tuyệt vời như một đáng cứu thế với SUSHI giúp SUSHI x3 lần ngay lập tức. Sau vụ Drama này đã thu hút khá đông đảo cộng đồng ủng hộ và tin dùng FTX.
- Bên cạnh các yếu tố tin tức, Về lộ trình phát triển được đánh giá rất cao khi SAM ( FTX ) không chỉ giỏi về việc cập nhập xu hướng mà còn làm rất tốt nó. Mọi thứ mà FTX đang có đều rất đáng kỳ vọng và kỳ vọng có cơ sở ( mình sẽ làm rõ hơn khi có thời gian )
Tổng hợp các yếu tố cơ bàn và tin tức hàng ngày quan điểm cá nhân mình cho rằng FTX cụ thể là FTT sẽ không dừng lại ở giá 3.7$ hay dưới 3.7$ được.
Nếu bạn muốn trông đợi về một khoản đầu tư chắc chắn và an toàn bên cạnh mức lợi nhuận nhiều X trong trung và dài hạn hãy quan tâm tới gợi ý này nhé !
* Lưu ý: Gợi ý là gợi ý không phải lời khuyên đầu tư nha, tất cả xuất phát từ ý kiến cá nhận có đúng có sai quyết định ở các bạn

SOL CẬP NHẬP 20/9 Vậy là Sol đang đi theo kịch bản mình đưa ra ở bài trước.
TH1: sẽ chạm 2.75 rồi bay lên
TH2: Nến H4 đóng dưới 2.75 khả năng chúng ta sẽ có 2.4 rất cao.
Theo quan điểm của mình thì sẽ thiên về TH1 hơn. Mình sẽ mua thêm ở 2.75 một chút. nếu TH2 xảy ra thì sẽ vào nốt số BTC còn lại cho Sol xóa app hóng tin từ các bạn !
