SB_CCI coded OBV StrategyStrategy-
Buy Order: Previous obv value is green and obv_cci coded line crosses over ema line
Sell Order: Previous obv value is red and obv_cci coded line crosses under ema line.
Original Idea:
Preferable for day/week intervals.
For Tips to continue :) -
BTC: 1BjswGcRR6c23pka7qh5t5k56j46cuyyy2
ETH: 0x64fed71c9d6c931639c7ba4671aeb6b05e6b3781
LTC: LKT2ykQ8QSzzfTDB6Tnsf12xwYPjgq95h4
Khối lượng Cân bằng (OBV)


On Balance Volume (CCI-coded) [Krypt]This is a straightforward modification of LazyBear's CCI-coded OBV indicator with the following changes:
1) uses log-hl2 as source, which seems to be a more stable indicator of price change than close
2) adds optional price smoothing

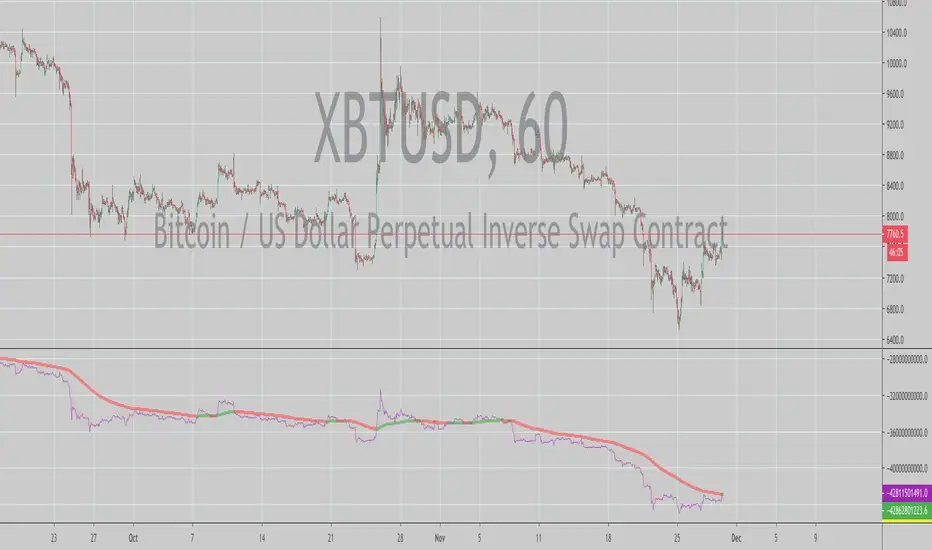
Variance of OBVIDEA is to easily spot the length of a calm periods based on OBV.
Some says that after a longer OBV-calm (but not supercalm) period up or down rallies are somewhat more likely)
METHOD: variance of OBV
ADVISE: cannot be used on its own, just with others (RSI, CCI, Coppock, MACD etc.)
Period shall be adjusted to the market.
PERSONAL: I also use it to evaluate how long an uptrend/downtrend is "normal" and when it is a "changer".
Also to see if a market is too flat. (No changes in flat periods is also not a good sign for me)
Also to evaluate magnitude of bursts.
Have fun, use stops, avoid FOMO and comments welcome!
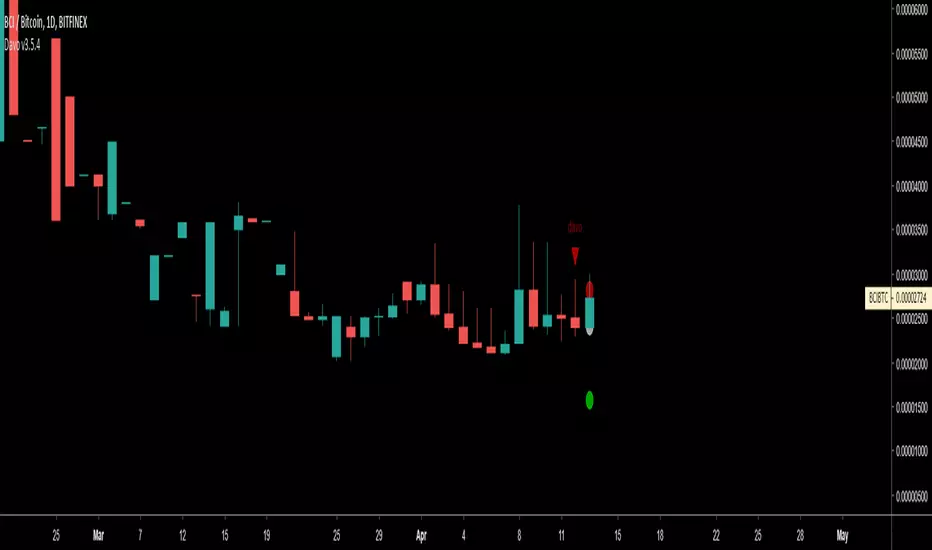
Dav-o meter (public)I decided to make this formerly invite only script public (you can find the invite only version here
If you are part of the invite only you don't need to change scripts. I will push improvements first on the invite only script but in time it will come to this version as well.
I would love to know your ideas and thoughts on how this indicator can be improved, so feel free to give any feedback.
Remember to give it a thumbs up if you like it.
[LAVA] OBV stratAn OBV strategy indicator. Included is a method to show the RSI or Oscillator value. Backtest to figure out which method works the best for your chart. A higher Profit Factor is what you want to look for since you want to trade less with better results for an overall lower commissioning fee.
Also, please contact me if there is any other indicator you would be interested in seeing as a strategy. I can do them all.
Please send your donation to any of the following addresses. Don't forget to add your TV name to the message when donating so that I can unlock the script for you. You can also send me a pm with your donation amount.
BTC: 1EabcghxBLZmGKHmKEP9W6S5ZSKeG4wLFA
BCH: 1M4QS5HE82Mk17ghKhaDeaXinL9CkLnhhR
ETH: 0x836ced779a10975248f847cad033c405a639b565
DASH: XhQexkwQUyDbvX4Xw78FHnxPvEsyRJYFqv
Click here for more information on these various cryptocurrencies listed above and others.

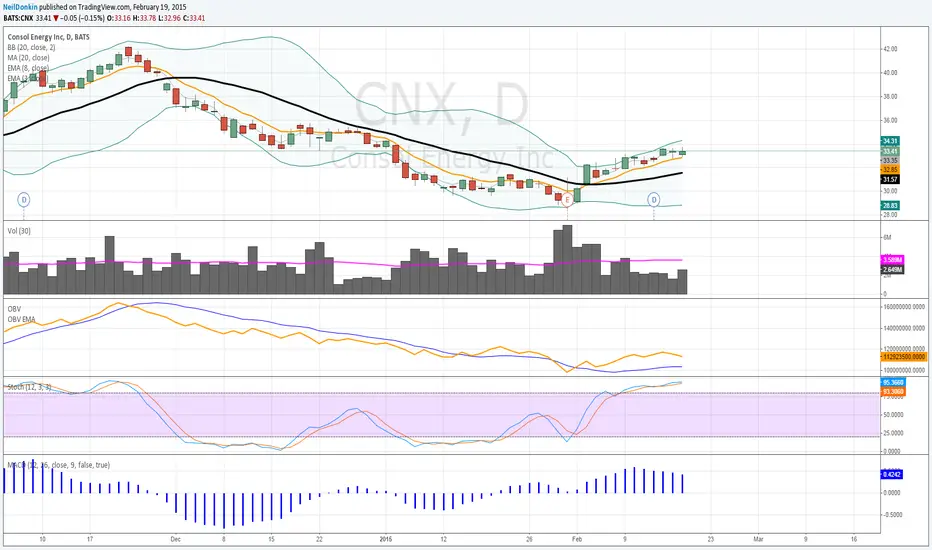
On Balance VolumeThe script applies an EMA to OBV . By default, the EMA=13 periods. All calculations are based off the closing price.
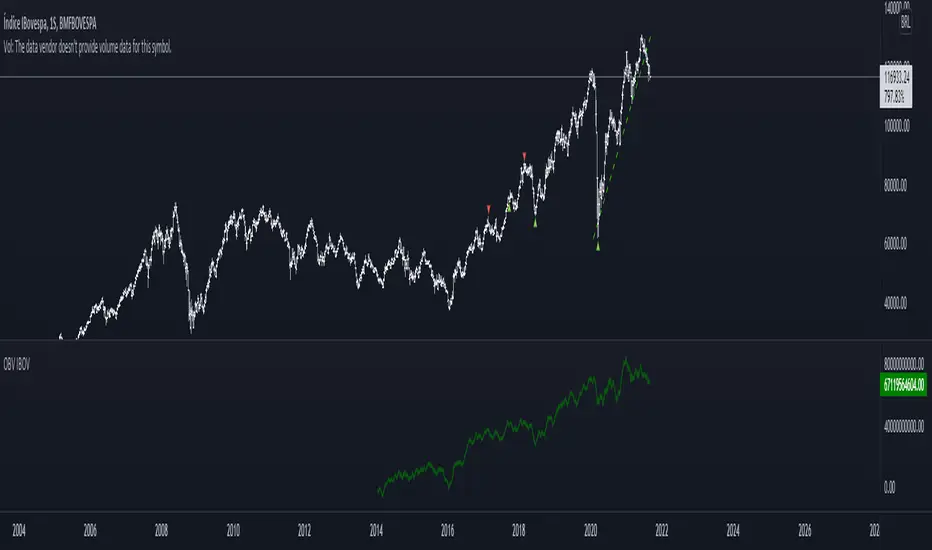
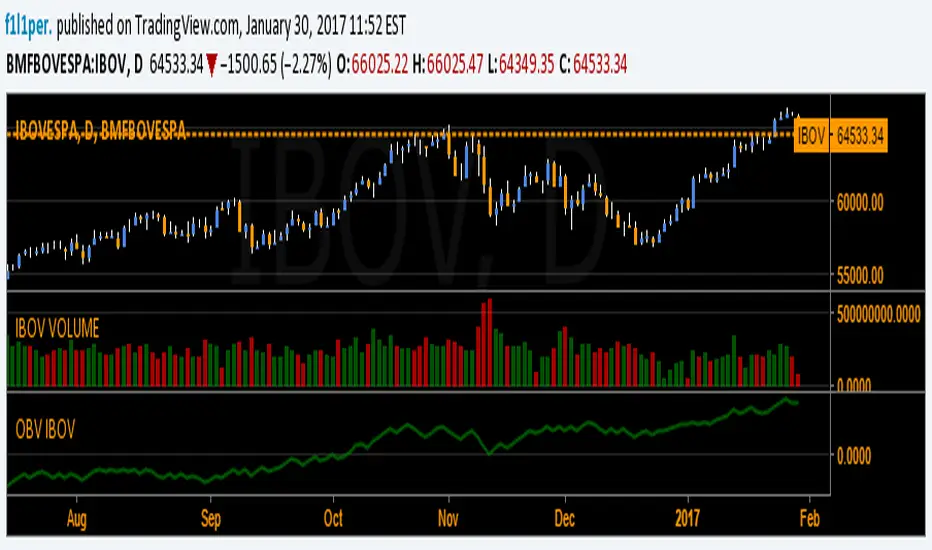
OBV IBOVOn Balance Volume is one of the most popular volume-based indicators and my favorite. In the absence of volume data for the IBOV I decided to construct the volume indicator and the OBV indicator based on that.
O On Balance Volume é um dos indicadores baseado em volume mais popular e o meu favorito. Na ausência de dados de volume para o IBOV resolvi construir o indicador de volume e o OBV baseado nele.
[ST] obv adl combination v4modified equation using sum of volume*hlc3*(close-open)/(high-low) to give more accuracy of distribution within a single candle unlike regular obv.


OBV Accumulation / Distribution combination v2OBV takes difference between old close and new close and multiplies by volume without considering high and low.
This assigns the entire volume into a single direction even tho movement could've been in both.
Accum/dist takes difference between close and high and low without considering previous close or open. This causes huge deviation from OBV when you have close or open far from high or low and price moving in the other direction like in a series of descending hammers.
This is attempt to combine both so relative motion between candles is detected and volume direction is assigned based relative to movement within a candle to account for volume in both directions.
+ and - depends if close is above previous close (+ if above, - if below)
Maximum upward volume counts if close = high and previous close = low, this makes multiplier 1 and thus entire volume is counted upwards
Maximum downward volume counts if close = low and previous close = high, this makes multiplier -1 and thus entire volume is counted downwards.
Zero volume movement occurs when close = previous close.
Half upward volume movement occurs if close-previous_close is half the range from high-low.
Update:
Open used instead of previous close due to issues with grabbing previous close on some charts. This seems more accurate for gaps without volume.

OBV Accumulation/Distribution combinationOBV takes difference between old close and new close and multiplies by volume without considering high and low.
This assigns the entire volume into a single direction even tho movement could've been in both.
Accum/dist takes difference between close and high and low without considering previous close or open. This causes huge deviation from OBV when you have close or open far from high or low and price moving in the other direction like in a series of descending hammers.
This is attempt to combine both so relative motion between candles is detected and volume direction is assigned based relative to movement within a candle to account for volume in both directions.
+ and - depends if close is above previous close (+ if above, - if below)
Maximum upward volume counts if close = high and previous close = low, this makes multiplier 1 and thus entire volume is counted upwards
Maximum downward volume counts if close = low and previous close = high, this makes multiplier -1 and thus entire volume is counted downwards.
Zero volume movement occurs when close = previous close.
Half upward volume movement occurs if close-previous_close is half the range from high-low.

Price/OBV divergenceShows agreement or disagreement between the direction of the the price and the on-balance volume. When they disagree, the price is supposed to follow the OBV (or so they say.)


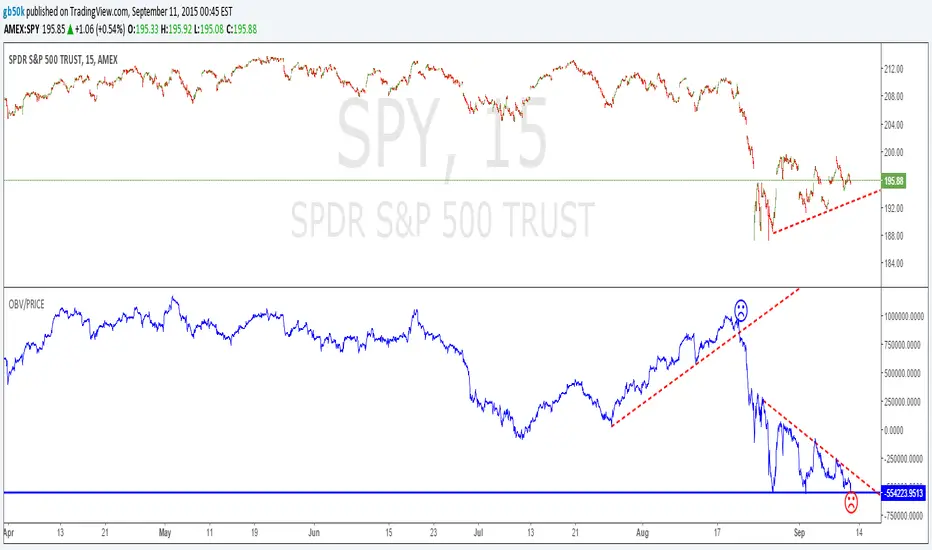
On Balance Volume/PriceFirst, look at the chart, then read.
Use OBV/Price to see a price adjusted by 'On Balance Volume' - (OBV), a momentum indicator that measures positive and negative volume flow, was developed by Joseph Granville and introduced in 1963.
The indicator, together with trend lines, provides good entry/ exit points.
In the chart note the exit point before the crash.
Also, note the "wedge" - a bit lees optimistic that the 'price only' wedge for SPY.
Pip Foundry - Fx IDC OBVMy premium indicators are available for monthly lease at www.tradingview.com
I previously published a simple OBV that allowed you to manually apply a different security to the one you are charting as the volume plot. However, this script will automatically apply the correct volume data to whatever forex pair you are viewing without requiring a manual setting.

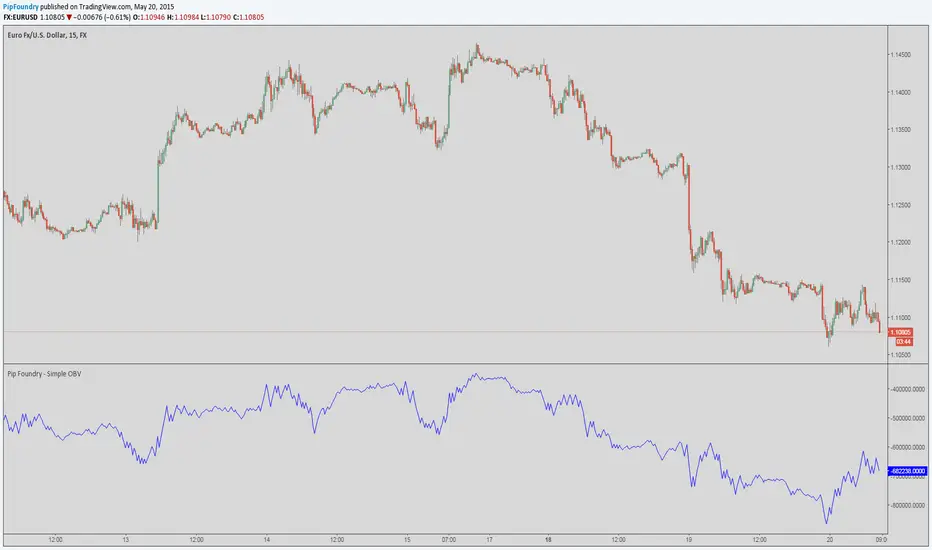
Pip Foundry - Simple OBVMy premium indicators are available for monthly lease at www.tradingview.com
On request from SunnyBTC for trading Forex pairs that do not themselves have any volume indication.
The concept: A simple OBV that will display the volume of a security other than what you are charting.
Edit: This script has been updated.
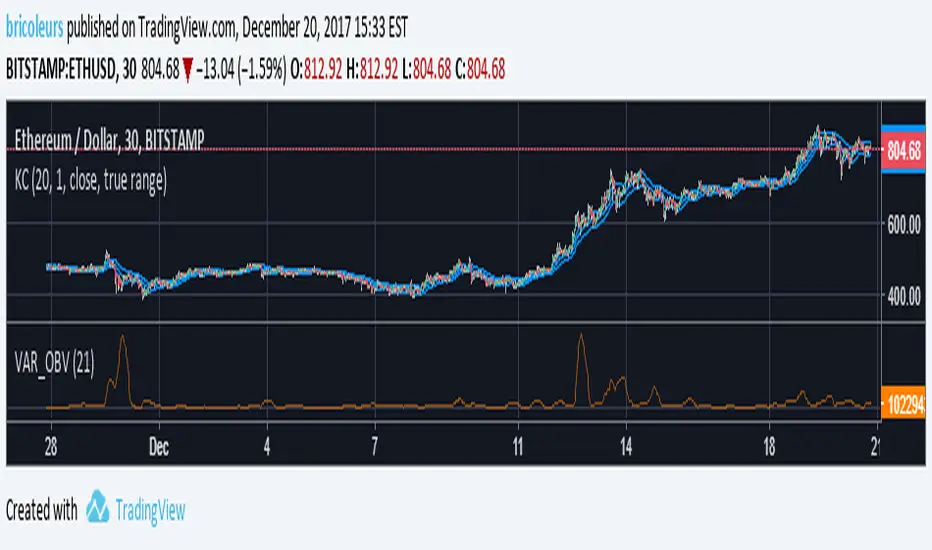
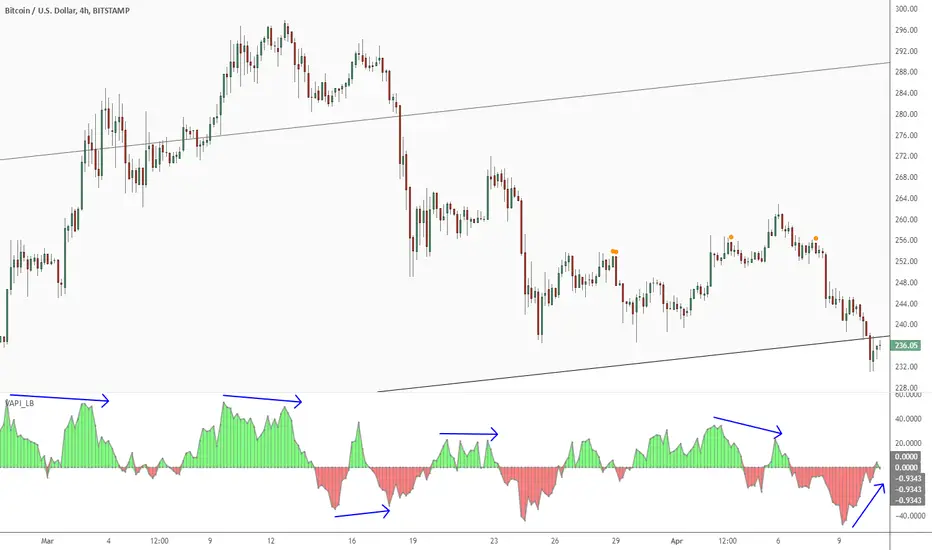
Volume Accumulation Percentage Indicator [LazyBear]Volume Accumulation Percentage Indicator (VAPI) is a variation of the classic volume-accumulation indicators. It uses volume the same way as OBV except that it assigns volume weights based on intraday volatility.
In a positive trend, if the stock price is close to a (local) new high, the VAPI should be at its maximum as well (and vice versa for a negative trend). If the market is looking for a direction, if the price is in the bottom side of his current trading range and if, at the same moment the VAPI osc slopes up, there is accumulation on the stock and that the prices should start to climb. The SELL signal is given when the VAPI decreases (distribution). Divergences are usually very effective too.
Tuning the "length" parameter may be needed for your instrument (default is 10), do let me know if you find a different value to be optimal for majority of instruments.
List of my public indicators: bit.ly
List of my app-store indicators: blog.tradingview.com
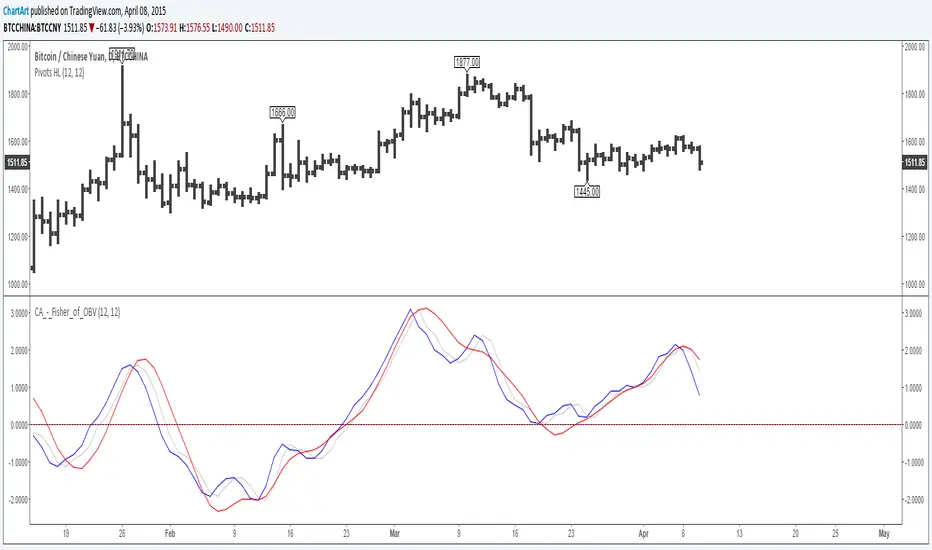
Fisher Transform of On Balance Volume (by ChartArt)A simple mash-up of the On Balance Volume (OBV) indicator with the Fisher Transform indicator (blue) with the classic Fisher Transform signal trigger (silver color), plus a linear regression as a second signal line (red).
I recommend to use a period for the linear regression which has the same speed or is slower than the period of the Fisher Transform to avoid overshooting.
P.S. Here are three areas where the indicator worked quite good on historic charts
VPT_OBVThis is a derivation of the On Balance Volume Indicator.
The idea behind it is that volume consists of two parts. The driving theory is the basic law of supply and demand.
Part 1: Volume consists of shares traded at an equilibrium price. An equal number of buyers and sellers are present during this volume. This area is displayed as the upper and lower shadows on a single candlestick. For this indicator, volume traded in equilibrium is not included in the display.
Part 2: Volume consists of shares that are not traded at an equilibrium price, driving price up or down for the time period. In this volume, buyers or sellers are not present in equal numbers. This area is displayed as the body of the candlestick. This indicator focuses on this part of volume.
VPT_OBV plots only the volume that occurs at the difference in price between the open and the close. To achieve this, volume is divided by the difference between the high and the low (in pennies). Next, the difference between the open and close is calculated (in pennies). Volume is then divided by the difference in the high and low, to get the amount of volume needed to move the asset up or down by $0.01 during the time period. This number is then multiplied by the difference between the open and close.
VPT_OBV plots the outcome as a cumulative total. A simple moving average of the VPT_OBV is thrown in to provide smoothing.
