Khối lượng Cân bằng (OBV)
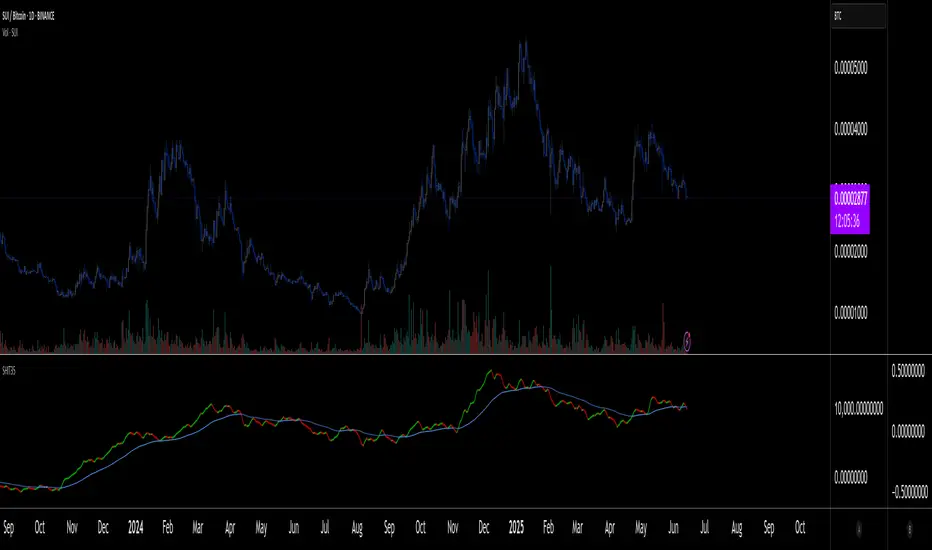
SHIT35 Alt Index (ROC or Volume) [LucF]SHIT35 is an index of 35 Binance alt/BTC pairs. It provides traders with a more reliable read of BTC pairs price movement than the often uncorrelated USD market cap standard.
Because it must read data coming from 35 markets, SHIT35 is painfully slow and should be kept hidden most of the time. Its features will hopefully seduce traders in using it nonetheless for market analysis.
Features
The Index can be calculated using 4 different modes:
1. Total of instant rate of change for all 35 markets ,
2. Cumulative total of ROCs,
3. Average of ROCs,
4. Plus/Minus volume (an aggregate OBV, if you will).
Select only one of the methods at a time to prevent confusion between modes.
An option allows showing the correlation between the Index as it is configured, and another instrument (CRYPTOCAP:TOTAL2 by default).
Markers can be used to identify abnormal movements in the Index. They are generated using Index exits from Bollinger bands.
The chart shows the Index with, from top to bottom, the default mode with BTC pairs, with USDT pairs, then mode 2 and 4 for BTC pairs.
Index Components
The Index is not weighed. The 35 instruments composing the index all have equivalents in the USDT quote currency on Binance, so you can easily change to those pairs using the Settings. Choosing another exchange or quote currency will require modifications to the list of instruments in the indicator’s code, since if one of the markets cannot be found, the indicator will not work. If the instrument exists but has no history for some bars, zero values will be used for them.
Watchlists
I have created a watchlist for the 35 markets in each of the BTC and USDT quote currencies. To import the watchlists, save the text you’ll find at these links in a file named the way you want your watchlist to be named and import them using the “Import Watchlist…” function.
BTC Watchlist: pastebin.com
USDT Watchlist: pastebin.com
Alerts
You can define alerts on any combination of markers you configure. After defining the markers you want the alert to trigger on, make sure you are on the interval you want the alert to be monitoring at, then create the alert, select the indicator, use the default alert condition and choose your triggering window (usually “Once Per Bar Close”). Once the alert is created, you can change the indicator's inputs with no effect on the alert.
TA-Money Flow-v2, Stochastic OBVNot sure where I originally got this (somewhere off Tradingview several years ago, thanks to the person who shared), just publishing because of a request.
This is basically a stochastic OBV movement indicator. It is good to work with both price and volume. I've updated to be able to display either as positive only, or both sides (50/-50), also included an invert function. It works great on any time frame, but you need to have volume data.
Enjoy.
I've got a version 3 if you're interested.

Volume Ticks - Increasing Volume Bar Count [LucF]Volume Ticks is a zero-lag market sentiment indicator. It works by providing a cumulative count of increasing volume columns.
A one count is added for each increasing volume column where close>open, and one is subtracted on an increasing volume column if close
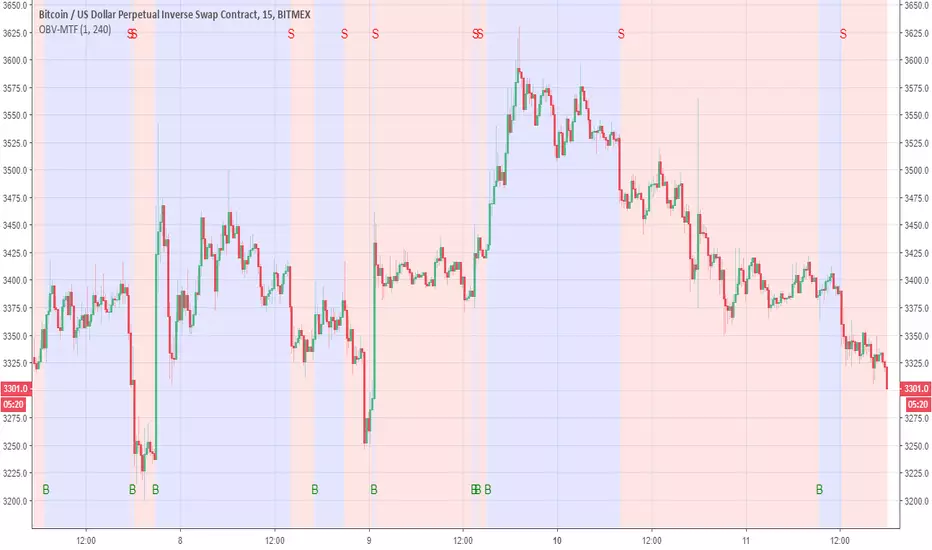
OBV-MTFUsing modified OBV volume equetion and using our modified MTF length (not need to use security so no repaint )
the Buy and Sell reresent in B and S and by the colors of bullish compare to bearish
You change the MTF by changing int2
in this example is set to 240 min MTF over 15 min charts
alerts inside
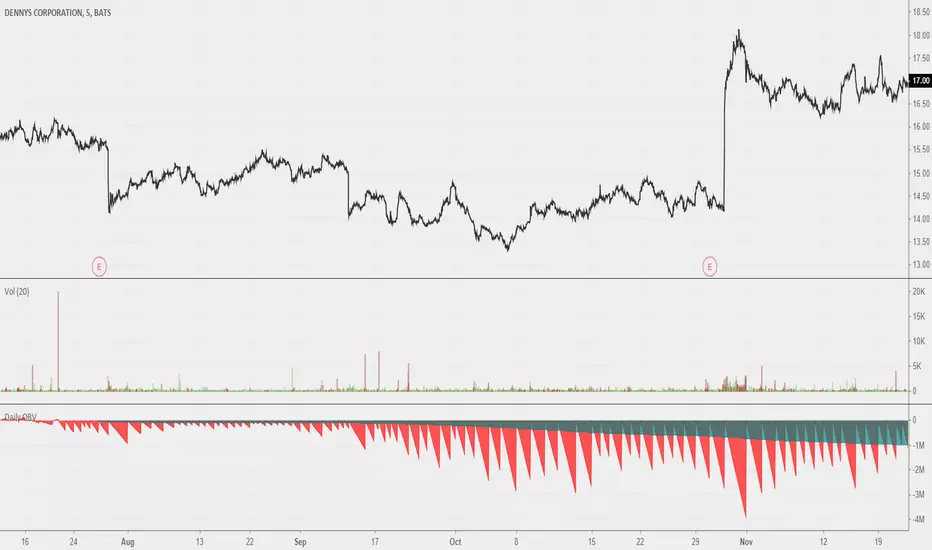
Daily OBVOBV that should reset on a daily session break. Looks neat when you scroll out all the way. Good use remains to be found; I believe this could be a useful reference for a more fleshed out idea for 'local zone' OBVs. Maybe comparing previous sessions' daily OBVs to current.
On Balance VolumeThis indicator was originally described by Joseph E. Granville in his book "Granville's New Key To Stock Market Profits" (1963).

Volume+ by BDthis is a simple volume indicator,
shows volume sizes with color differences on histogram (total volume, neutral volume and effective volume)
bar length = total volume, gray bar= neutral volume, green bar= pozitive volume, red bar= negative volume
variable value; The bar's average will be calculated until the given value. by default is average not calculated
On Balance Volume Oscillator + Bollinger Bands [SigmaDraconis]On Balance Volume (OBV) Oscillator with Bollinger Bands (BB).
Inspired by @LazyBear OBV Oscillator (link below)
Added BB to the oscillator and colored the OBV line yellow when it's outside the bands' limits, useful for finding over-extended zones where price reversals have higher probability of happening.
BB bands can be deactivated and the oscillator can be used as originally built by LazyBear if the BB bands are disabled and the OBV area activated.
Finding divergences helps increasing price behavior predictability too.
BB area is colored green when OBV is above the 20-period moving average and colored red when below it. This can be deactivated on the options to use regular BB colors or no BB at all.
If you like it and use it to profit, please tip me below :)
Tip jars:
BTC: 15nMBiEGVrdGcu9C1h6QRcTNRvugHkqrMQ
ETH: 0xC33845946c48B61fBCbEA0367ec2238CaF2b73bc
BTS: sigma-draconis
OBV Oscillator from LazyBear -

Enhanced On Balance VolumeEnhanced On Balance Volume
"On-balance volume (OBV) is a momentum indicator that uses volume flow to predict changes in stock price.
Joseph Granville first developed the OBV metric in the 1960s.
He believed that when volume increases sharply without a significant change in the stock's price, the price will eventually jump upward, and vice versa."
The On Balance Volume generalizes.
Only the direction of change is taken into consideration, making the price irrelevant.
Enhanced On Balance Volume comes to life when the entire price action is being considered - the lows and highs.
// I looked around on TradingView and there was no such indicator.
// This is a version of the well known On Balance Volume, ported to Pinescript, meant for markets with volume data.
OBV with 13 EMA - TRIOn Balance Volume with 13 Exponential Moving Average.
Taught in school Level 1 program.
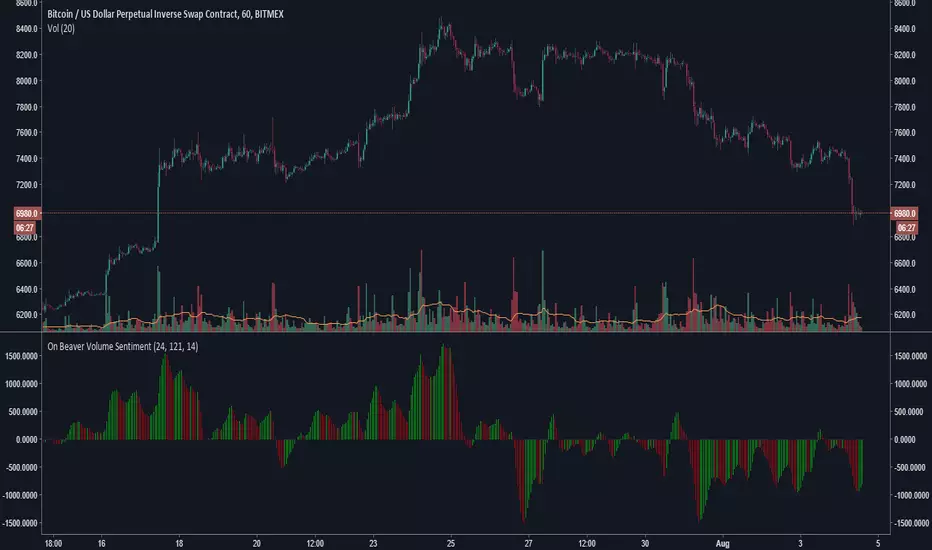
On Beaver Volume SentimentGeneral Market sentiment decoded from two Lazybear OBV's and a CCI.
Lots of strategies with this.
Main point is this indicator tries to be extra sensitive to relative volume changes but keep grounded in sentiment with the cci.
Let me know if you use this!
-Beaverman
Accumulation/Distribution Volume (ADV) [cI8DH]This is the simplified and optimized version of my original ADV indicator. It shows both regular volume bars and the accumulated/distributed (A/D) portion of them. The equation is elegant and intuitive. It calculates candle body to candle height ratio and multiplies it by volume: volume*(close-open)/(high-low). This is the building block of my three other indicators, ADL, ADP and ADMF.
- The volume bars has two shades of green and red. The dark shade shows amount of A/D and the light shade shows total volume (what you see on a regular volume indicator).
When money volume is enabled, volume is multiplied by price. As you can see in the chart below, trade volume in terms of USD was growing over the past years.
- Blue line is the moving average of A/D and the orange line is for total volume. When "Baseline Chart" option is enabled, this moving average is identical to ADMF indicator which can be a powerful indicator for assessing buy/sell pressure as well as money flow and volume divergences. You can turn off volume bars (from style menu) for better visibility or you can use the below indicators.
Please note that ADMF is now available as a part of ADP indicator as well and I recommend using the latter since ADP can also replace CMF and MFI indicators.
- If you change the aggregation to cumulative (while having money volume disabled), the gray line becomes identical to On Balance Volume (OBV) and the blue line identical to my ADL indicator. The latter I would argue is more accurate than Chaikin's ADL, William's A/D and OBV.

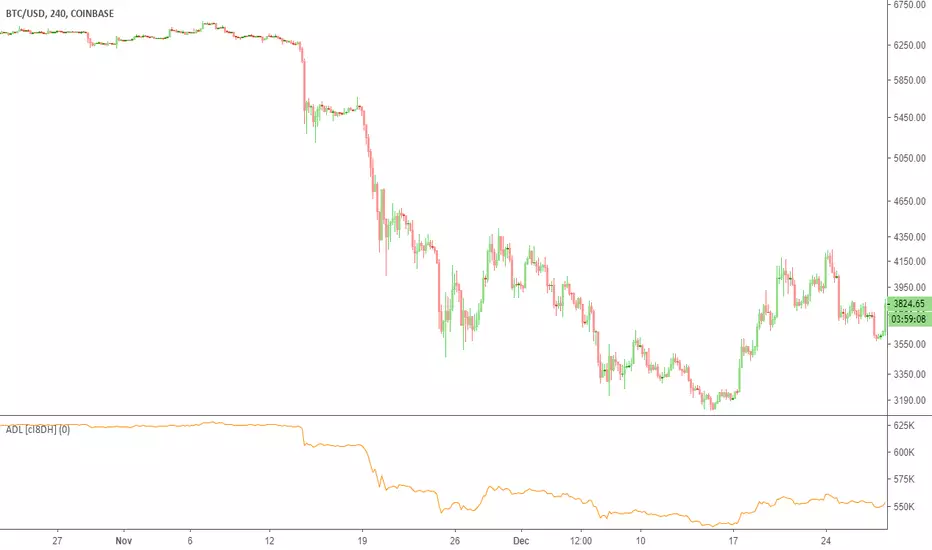
Accumulation/Distribution Level (ADL) [Cyrus c|:D]This indicator shows Accumulation/Distribution level which can be used for confirming trends or reversals (via divergence). It is an alternative to Chaikin's Accumulation/Distribution Line (ADL) and On Balance Volume (OBV) indicators. It can also replicate PVT and OBV via options in the input menu.
Here is a comparison of four related indicators:
OBV is too simple and has serious flaws as explained in PVT's wiki.
Chaikin's ADL is a broken indicator as can be seen in the chart below:
A/D Level addresses the flaws in these two indicators. It simply sums up portions of the volume that contributes to price change. These portions are visualized in dark green and red on "Accumulation/Distribution Volume (ADV)" indicator. This can also be achieved by ADV indicator if you are nerd enough.
PS: There is Williams A/D as well which is also a broken indicator.
Accumulation/Distribution VolumeThis is a simple yet powerful indicator that can replace volume, Money Flow, Chaikin Money Flow, Price Volume Trend (PVT), Accumulation/Distribution Line (ADL), On Balance Volume (OBV).
When "Baseline Chart" option is disabled, it looks similar to regular volume. The volume bars has two shades of green and red. The dark shade shows amount of accumulation and the light shade shows total volume (what you see on a regular volume indicator). Blue line is the moving average (or cumulative total) of A/D and the gray line is for total volume.
When money volume is enabled, volume it multiplied by price. As you can see in the chart below, trade volume in terms of USD was declining after ATH. This is not the case in regular volume chart which shows instrument volume (chart above).
In Baseline view, the aggregation method you choose can turn it into different indicators. With EMA/SMA aggregation, blue and gray line shows buy/sell pressure. At 0, there is not buy or sell pressure.
If you turn off volume bars (from style menu), it gives you a reliable indicator to measure divergence. This should be more reliable than most other range-bound indicators (i.e. RSI, MFI, CMF). I will publish a TA about correctly measuring divergence (it's a must read even if you are a pro trader). Make sure that the length is set to a large number on smaller TFs such as 4h.
For following results, set aggregation to cumulative and turn off money volume:
When wick weight=0, the GRAY line is identical to OBV indicator.
When normalized by spread and wick weight=10, the BLUE line is identical to ADL (improved by true range).
When normalized by previous bar price, wick weight=0, the BLUE line is identical to PVT.
How I use this indicator:
- Baseline chart, replaced my regular volume indicator
- Mostly 4h TF for divergence
- EMA aggregation (and occasional cumulative aggregation) with length above 50. I change the length to 100 and 200 for confirmation.
- Wick weight=0 or max 2.
With this indicator, you can learn how different indicators are built and how they are different from each other. I will publish a TA to explain more about different indicators and their pros and cons.
I will publish this indicator without volume bars and additional options to make it range bound.

CCI OBV 4Kmod of lazy bear's OBV coded CCI , which indicates CCI state by changing the color of the OBV. now it shows you when CCI is overbought or oversold, not just one or the other
when CCI > 100, that's an oversold signal and OBV line turns green
when CCO -0.54% < -100, that's an undersold signal and OBV line turns red
CCI threshold can be changed (ex. 200 and -200)
EMA is overlaid, too, in orange, and that period can be changed

RIZ OBV with coloured CCIThis ones useful for spotting divergence on OBV, and also includes CCI to show overbought and oversold areas in the volume. I've coloured the OBV bar with the CCI levels. Look for divergence (best results on 5min chart I believe) with this and you can spot where to sell if a second peak is not supported by volume, also shows where the big guns are dumping lots of volume!
A volume study is always a good addition to any analysis I feel, and this is one of my day to day always on indicators.

OBV Daily ResetJust a quick OBV indicator for intraday trading that resets to 0 at the start of each new session (based on dayofmonth changes). I saw someone looking for this in chat and jotted it down for him.

On Balance Volume (CCI-coded) [Krypt]This is a straightforward modification of LazyBear's CCI-coded OBV indicator with the following changes:
1) uses log-hl2 as source, which seems to be a more stable indicator of price change than close
2) adds optional price smoothing

Variance of OBVIDEA is to easily spot the length of a calm periods based on OBV.
Some says that after a longer OBV-calm (but not supercalm) period up or down rallies are somewhat more likely)
METHOD: variance of OBV
ADVISE: cannot be used on its own, just with others (RSI, CCI, Coppock, MACD etc.)
Period shall be adjusted to the market.
PERSONAL: I also use it to evaluate how long an uptrend/downtrend is "normal" and when it is a "changer".
Also to see if a market is too flat. (No changes in flat periods is also not a good sign for me)
Also to evaluate magnitude of bursts.
Have fun, use stops, avoid FOMO and comments welcome!
Dav-o meter (public)I decided to make this formerly invite only script public (you can find the invite only version here
If you are part of the invite only you don't need to change scripts. I will push improvements first on the invite only script but in time it will come to this version as well.
I would love to know your ideas and thoughts on how this indicator can be improved, so feel free to give any feedback.
Remember to give it a thumbs up if you like it.
On Balance VolumeThe script applies an EMA to OBV . By default, the EMA=13 periods. All calculations are based off the closing price.
[ST] obv adl combination v4modified equation using sum of volume*hlc3*(close-open)/(high-low) to give more accuracy of distribution within a single candle unlike regular obv.
