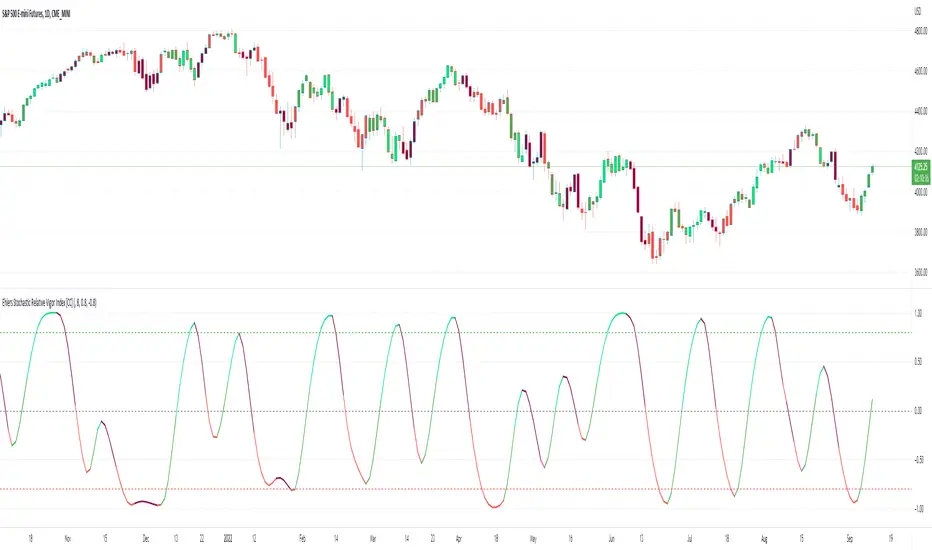
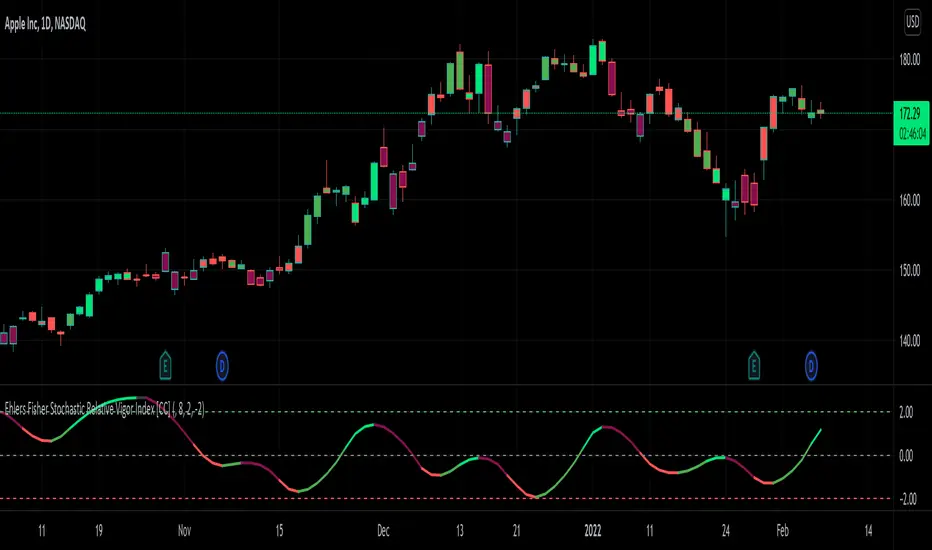
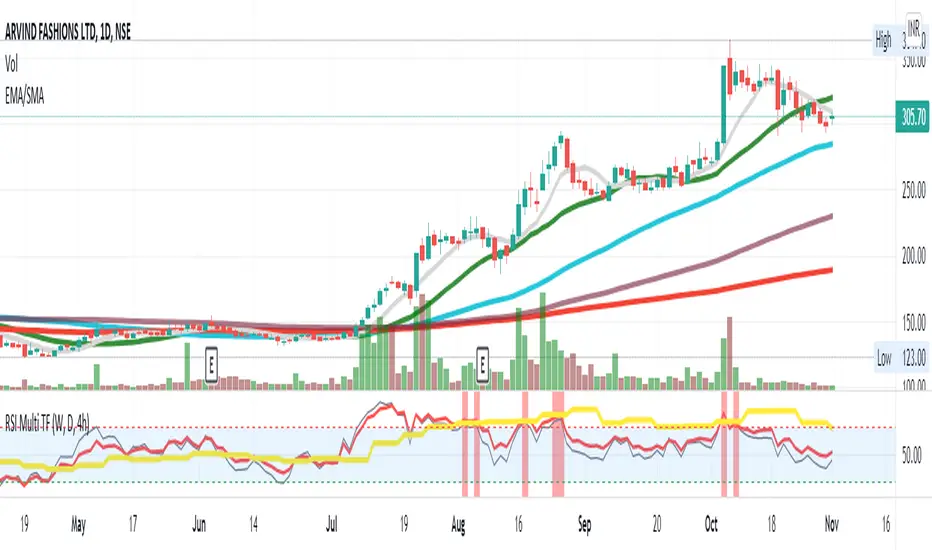
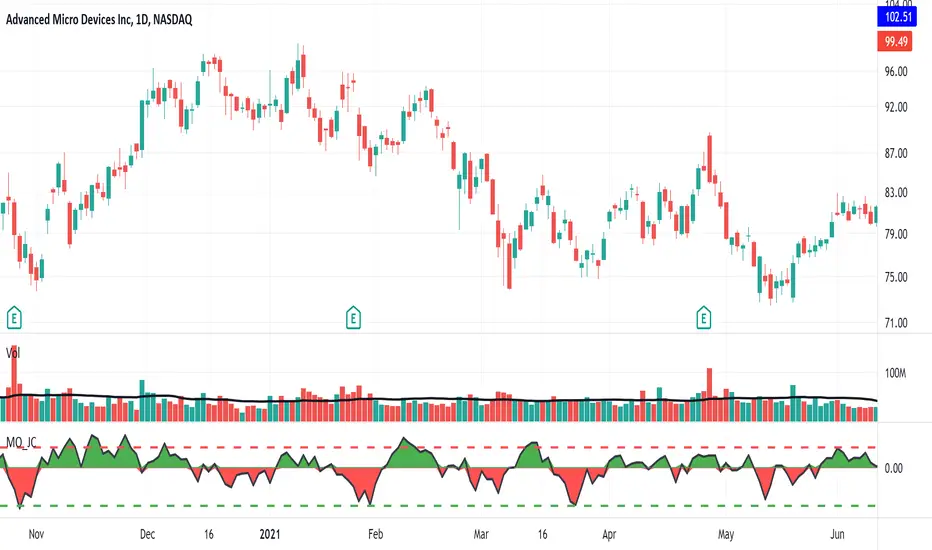
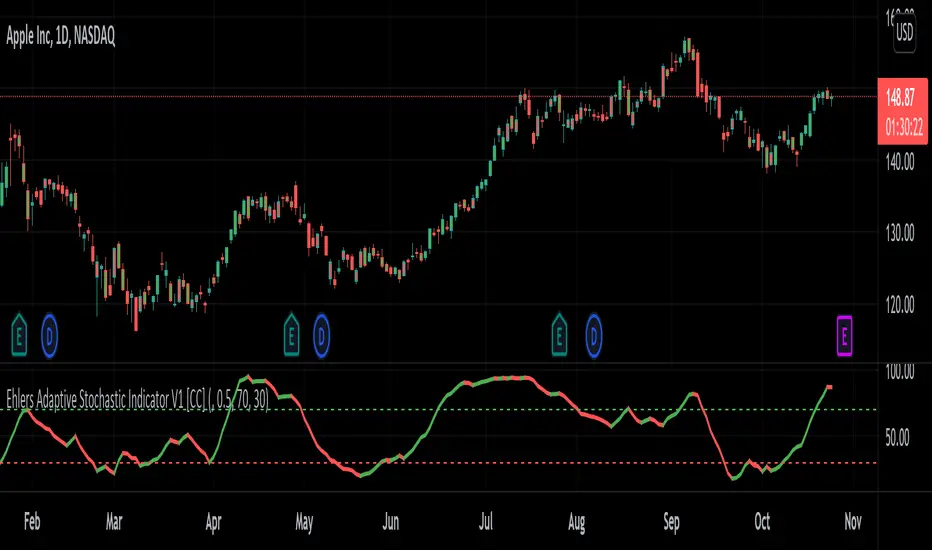
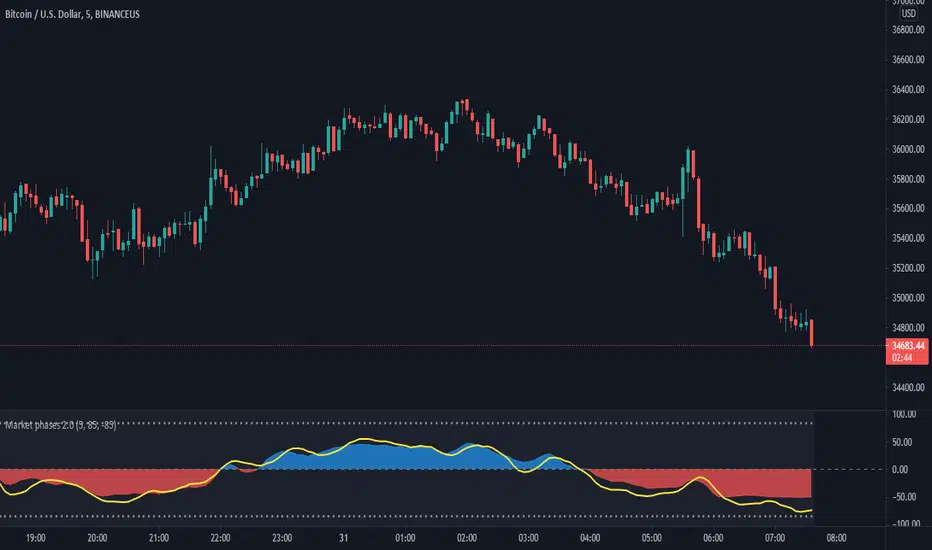
B3 Stochastic Full w/BarColorNow with Bar Color!
The simplest upgrade to the classic indicator, old script:
B3 Stochastic Full
Also, if you like this one you may appreciate my personally modified take on the stochastic readings:
B3 Extended Stochastics
Oversold
VWAP Gap [AR]This simple indicator measure the difference between price and VWAP line
The VWAP Gap indicator works best on intraday charts
SET-UP INFO
1. Add VWAP to your chart and set it up
2. Open "VWAP Gap Indicator" settings
3. Change source to "VWAP"
Enjoy!
Alex R.
Better Donchian OscillatorWhat is BDO?
- BDO is the Better Donchian Oscillator. This is a proprietary indicator which I derived from the donchian formula.
BDO usage
1. BDO is mainly used to determine overbought and oversold levels. I think it is more accurate in determing these levels than RSI or MACD.
2. It can also be used to follow major trends with a very high accuracy, although it is lagging. However, its main oscillator in the middle is still a leading indicator.
Access and Documentation:
Message or PM to know how to get access.
RSI Call-outs [BigBitsIO]This is a simple RSI indicator that overlays the current chart to show labels for specified oversold and overbought areas defined with inputs.
It will delete any labels of the same kind within the last 3 candles so you don't see as many labels as you would otherwise.
Red labels with white text represent overbought RSI levels as defined by the user.
Green labels with black test represent oversold RSI levels as defined by the user.
This RSI overlay help easily call-out overbought and oversold candles on a chart without sacrificing screen space for a traditional RSI indicator that is not overlayed on the chart.
RSI ChannelHello All. For a while this idea (showing RSI levels on the chart as a channel) was in my mind and finally today I developed the script. I hope it will be usefull for all.
Enjoy!
Range MovementRange Movement is an indicator I created to help me determine a few things:
1. the mood of the market makers and market participants
2. the price trend
What I found after creating the indicator is that it is extremely helpful in finding "EXTREME SENTIMENT" when this line has moved up dramatically and price has too, but then RgMov diverges and signals a weakening support for the stock. When Range Movement surges it reveals extreme optimism and powerful upward movement in price, which can draw in momentum investors and create a blow-off peak in price. So in this instance, RgMov is an overbought, oversold indicator.
What I also found is that when a stock is stuck in a range for a long time that RgMov will breakout FIRST to give an early indicator of the future price move to follow. This can be true for rallies or declines.
In the example I show $TSLA Tesla shares which broke out in RgMov well ahead of the stock price in October 2019. See example on chart.
What is RgMov or Range Movement?
Range Movement, aka "RgMov" is derived from open-high-low-close price data. If the market has moved up more than it has moved down during a given bar, the line will move up. Tracking the cumulative movement of the line over time creates the pattern.
You can use RgMov in many ways. Here's how I created it to be used for the daily trend in any stock or index:
Uptrend = New high over 44 days
Downtrend = New low over 44 days
As long as the trend is up on the 44-day time frame, I use shorter term (11-days, for example) oversold conditions as entry points to buy and go with the uptrend.
If the trend turns down, then I use shorter term (11-days, for example again) overbought readings to go short to trade with the downtrend.
CryptoSignalScanner - Stochastic Trend IndicatorDESCRIPTION:
This script has been designed to provide the ideal buy and sell moment on the lower time frames.
• This scripts is based on the Stochastic RSI Indicator.
• When we are in an uptrend the background becomes green.
• When we are in a downtrend the background becomes red.
• It is also possibility to set the overbought and oversold range.
HOW TO USE:
• When the blue line (stochastic K) has crossed above the red line (stochastic D) in the oversold area then this is the ideal moment to get into a trade.
• When the blue line (stochastic K) has crossed below the red line (stochastic D) in the overbought area then this is the ideal moment to get out of a trade.
• Use this together with the CryptoSignalScanner - Advanced BUY/SELL indicator to get a stronger confirmation.
• Use the Fibonacci tool together with the Eliot Waves to help you to find the ideal buy or sell moment.
HOW TO GET ACCESS TO THE SCRIPT:
• Use the link below to subscribe to our indicators.
REMARKS:
• This advice is NOT financial advice.
• We do not provide personal investment advice and we are not a qualified licensed investment advisor.
• All information found here, including any ideas, opinions, views, predictions, forecasts, commentaries, suggestions, or stock picks, expressed or implied herein, are for informational, entertainment or educational purposes only and should not be construed as personal investment advice.
• We will not and cannot be held liable for any actions you take as a result of anything you read here.
• We only provide this information to help you make a better decision.
• While the information provided is believed to be accurate, it may include errors or inaccuracies.
Good Luck,
The CryptoSignalScanner Team
Stoch RSI improved with crossing alerts for TV Signals - adjustaStoch RSI improved with crossing alerts for TV Signals - adjustable
CryptoSignalScanner - Advanced BUY/SELL indicatorDESCRIPTION:
This script has been designed to do some swing trading on 4 hour and daily candles.
After some adjustments it also gives a good result on the lower timeframes 5m, 15m and 1h.
• This scripts is based on RSI, Stoch RSI and some other indicator(s).
• It provides BUY, SELL, STRONG BUY and STRONG SELL labels when loading the script.
• It is also possibility to set a BUY, STRONG BUY, SELL, STRONG SELL, BUY/SELL or STRONG BUY/STRONG SELL alert.
HOW TO USE:
• When a BUY signal appears it means that the trading pair is oversold. Wait for the reversal to buy. Use the Fibonacci tool together with the Eliot Waves Theory to BUY or SELL or wait for the SELL signal.
• When a SELL signal appears it means that the trading pair is overbought. SELL immediately or use the Fibonacci tool together with the Eliot Waves Theory to SELL.
FEATURES:
• You can show/hide the labels based on RSI, Stoch RSI input values.
• You can show/hide the labels based on Stoch RSI K and R input values.
• You can show/hide the labels based on Stoch RSI K and R crossing.
• You can show only STRONG BUY or STRONG SELL labels.
• Etc...
HOW TO GET ACCESS TO THE SCRIPT:
• Use the link below to subscribe to our indicators.
• Based on this script we provide telegram channels that provides signals for all Binance BTC, ETH, USDT and BNB pairs.
REMARKS:
• This advice is NOT financial advice.
• We do not provide personal investment advice and we are not a qualified licensed investment advisor.
• All information found here, including any ideas, opinions, views, predictions, forecasts, commentaries, suggestions, or stock picks, expressed or implied herein, are for informational, entertainment or educational purposes only and should not be construed as personal investment advice.
• We will not and cannot be held liable for any actions you take as a result of anything you read here.
• We only provide this information to help you make a better decision.
• While the information provided is believed to be accurate, it may include errors or inaccuracies.
Good Luck,
The CryptoSignalScanner Team
RSI Divergence Plotter (2020)How do i use this script?
Firstly, be sure that you have done your research on what divergence is. The oscillator will automatically mark all types of divergence and has coloured 'over bought' and 'oversold' levels at 30 and 70, although reliable, be sure to use other Technical Analysis before entering trades.
Thank you.
Dynamic RSIThe Dynamic RSI indicator is a kind of exponential RSI. The overbought and oversold levels (respectively HiLine and LoLine) are calculated according to the recent highest and lowest values of the Dynamic RSI line.
RSI channel ob/os breakout [ChuckBanger]This is a breakout signal script based on reverse engineering of RSI. It shows a channel of overbought and oversold readings that the trader can sett in settings. When low crosses under lower line it shows bullish signal and when high is crossing upper line it shows a bearish signal. The script also has wilder's moving average as filter instead of high/low.
Good luck traders!
[PX] RSI BarcolorThis script simply colors the candles based on the defined "overbought" and "oversold" RSI-levels set in the input section of the indicator.
If the price is below the oversold level, the candle is colored in yellow.
If the price is above the overbought level, the candle is colored in aqua.
If the price moves back between both levels, no color will be applied.
Might be useful for some of you ;)
Ace Pro Long Indicator - 1 Minute BTCUSD Bitcoin ChartThe Ace Pro Long Indicator calculates overbought and oversold conditions.
It focuses on momentum to identify whether the market is overbought or oversold.
If it detects that the market is oversold, it gives an alert of “long entry”
If it detects that the market is overbought, it gives an alert of “long exit”
Users are also able to set notifications on Tradingview with this version of the indicator.
To set an alert, after adding the indicator, at the top left of the chart where the indicator is listed, click on the "more" option (three dots), and then select "Add alert."
Please note the following:
The Ace Pro Long indicator is designed only for use on the 1 minute Bitstamp BTCUSD chart.
It is only to be used for opening and closing long positions.
It is not recommended for use with short positions.
It is not recommended for use with time frames other than the 1 minute.
In a sideways market, or during a violent move, it is likely to produce false signals.
Traders must use confluence from their technical analysis to enter trades.
Because this is an invite only script, users with a free Tradingview account will not be able to obtain access.
Traders must use confluence from their technical analysis to enter trades.
Snake/RSIThis study is similar to my Snake study. The differernce is that instead of following a moving average, this "snake" follows a RSI closely looking for the best opportunities to buy/sell.
Dark red triangles at the bottom are buy signals with alerts of BUY ASSET. Dark red triangles to the top are sell signals with alerts of SELL ASSET.
Overbought and oversold are configurable as well as the length of the RSI itself.
RSI Oversold/Overbought IndicatorThis is a very simple but quite powerful indicator which looks at the RSI simultaneously over the 4h, Daily and Weekly timeframes, and places bands on the chart when one or more timeframes move into oversold/overbought territory. For further filtering I use the 200 day SMA to determine if we are in a Bull or Bear market, which puts a bias on the RSI (30/80 in a Bull market and 20/70 in a Bear market).
The deeper the colour, the more oversold the market is. The weekly RSI can be used as an early warning sign, with the Daily/ 4h RSI useful to identify local peaks.
Project Windfall BETAThis oscillator is designed to be used in confluence with the PROJECT ROYALTY BETA.
The oscillator to end all oscillators. With over 1000 lines of code, this oscillator provides a detailed and responsive look at trend direction.
Color Description:
Blue is showing bullish movement. Price action is most likely moving upwards.
Darkened Blue is showing extreme bullish movement. This does not guarantee that price is or soon will be rocketing. The coloring is related to recent bullish movement. Color could be darkened while price could be increasing slowly.
Orange is showing bearish movement. Price action is most likely moving downwards.
Darkened Orange shows extreme bearish movement. Again, this does not guarantee that price is or soon will be plummeting. The coloring is related to recent bearish movement. Color could be darkened while price could be decreasing slowly.
Trading Strategy
LONG when color turns from any orange to any blue.
LONG when the oscillator is below the zero line, is increasing (blue), and when the color changes from dark to light.
SHORT when color turns from any blue to any orange.
SHORT when the oscillator is above the zero line, is decreasing (orange), and when the color changes from dark to light.
IMPORTANT:
This oscillator is specifically tuned for BTCUSD and is most effective on the 1 HOUR . Be warned when trading any other instrument with this oscillator.
WaveTrend Oscillator + Divergence + Direction Detection +AlertsMake this version of the famous WaveTrend indicator has the following characteristics:
- WaveTrend direction detection
- Customizable overbought and oversold level (set by default just like the original version)
- Possibility to modify the length of the channel (set by default same as the original version)
- Possibility of modifying mobile period (set by default same as the original version)
- Show ONLY overbought sales.
- Show all sales.
- Show ONLY purchases in oversold.
- Show all purchases.
- See histogram.
- See half signal.
- Paint Bars.
- Modification of colors.
Alerts:
The indicator has the following alerts:
- Sales in oversold
- All Sales
- Purchases in oversold
- All Purchases
- Purchases / Overbought sales / Sales
- All Sales / Purchases
- Change WT Direction
NOTE: This single indicator should not be taken as a trading strategy is only a tool for the trader that gives a sense of depth market and potential opportunities for purchase / sale which must be evaluated in the context generally used this indicator to look for positions in areas of overbought / sell, also for detecting differences, other aspects such as the direction of Wavetrend, levels, histogram, etc, also provide useful information.
Release Notes: Add a field to change reaction and color change direction WT, is set to 1 as fast (default), better greater number address filter but is slower.
Release Notes: Add a Hidden Divergences detector and Regulars (bulls and the bears), from setup can activate them, also can turn off the labels and leave only the lines, configure it to your liking.
NOTE: SCRIPT IN SPANISH
Rainbow Technometer - Multi Timeframe [WYCKOFF ARSENAL]🌈 Rainbow Technometer - Multi Timeframe WYCKOFF ARSENAL
The purpose of the Technometer is to provide a mathematical indication of the degree to which the market is overbought or oversold .
The value of the Technometer could be as high as 100 or as low as 0. The other possible values would represent degrees of overbought or oversold.
In Rainbow form, the Technometer could also be used as a trend-following indicator.
The Rainbow Technometer can be used on any available timeframes and assets with volume data .
It is a combination of Technometer instances of different lengths that are plotted on the same chart.
The confluence zones can hint at a price reversal and help estimate the trend strength.
The Rainbow Technometer can be combined with other technical analysis tools as a trend-following indicator.
When the trend is strong and the other indicators used to determine entry points send a bullish or a bearish signal, a position can be opened.
When the trend is weak, opening new positions should not be to consider.
The Rainbow Technometer can also be used on its own. The angles of the Rainbow will hint at the trend strength.
The steeper the curve, the stronger the trend. The flatter the curve, the weaker the trend.
A Buy position can be opened in the beginning of a strong positive trend .
A Sell position can be opened in the beginning of a strong negative trend .
During a strong trend, short-lived retracements can be found, and it is possible to enter a position in the direction of the general trend against the retracement.
The Rainbow mode can be experienced with the Multi RSI indicator as well.
Related tools :
▪ Optimism Pessimism
▪ Force
- 🌈 Rainbow Force
▪ Technometer
- 🌈 Rainbow Technometer ◄
▪ Momentum
- 🌈 Rainbow Momentum
▪ Market Screener
RSI bars chartShows RSI over-bought /over-sold conditions with specific bar-color on main chart.
All inputs such as color, RSI value & level are modifiable by users.
Liens FavoriteMy favorite scripts togheter.
1. Long / M/S-R.Trend changing direction. This is best on higher tf, but can be used on lower aswell. It gives signals when stochastic is overbought/oversold and the macd is crossing the 0 line.
2. This script got 2 ema lines ( Buy/Sell crosses )
3. MA line that changes color. Options - SMA", "EMA", "WMA", "VWMA", "SMMA", "DEMA", "TEMA", "HullMA", "ZEMA", "TMA", "SSMA". Sometimes i use this(ma) insdead of the bb center line.
4. Standar Bollinger bands with buy and sell signals - also added a function so buy and sell signals only show when stochastic is overbought/oversold for less false signals.
5. Stochastic Oversold/overbought on chart.
6. Macd Bearish and bullish crosses on chart.
Alerts for all functions.
[astropark] Super Stochastic RSI [alarms]Dear Followers,
today a new Scalper Tool , which works great on 3 minutes and 5 minutes timeframes !
I called it " Super Stochastic RSI ", as it is based on StochRSI and inherits some basic functionality from it.
If you check its settings, you will see that you can have 3 different buy-sell sources (first two are active by default):
STRONG BUY/SELL : buy when green area deeply falls into oversold zone and sell when red area gets into overbought zone (you can set and edit at which level oversold and overbought zones start);
K/D CROSSES : buy when k-line cross above d-line and sell viceversa (you can set and edit specific cross ranges for both buy and sell);
WEAK BUY/SELL : buy when green area at least go below 50 level and sell when red area at least goes above 50 level (you can edit both levels); these conditions are highlighted as background color and are very useful for taking (at least partial) profits in trades.
By default the script will be placed as overlay on the chart, but
> you can activate the oscillator plot by disabling the "hide all plot" option
> and place it in a below pane by clicking on the black arrow at then end on the indicator name in chart and selecting "move to -> a new pane below"
This strategy can trigger till 10 buy or 10 sell signals in a row before reverting, so use a proper money management .
Strategy results are calculated on 20 trading days using 1000$ as initial capital and working at 10x leverage.
The user who wants to use this strategy, especially via an automated bot, must always set a stoploss at 3-5% from entry point or use a proper risk management strategy .
This is not the "Holy Grail", so use it with caution.
This script will let you set all notifications you may need in order to be alerted on each triggered signals.
The backtesting script version of this indicator, which will let you backtest this script and find best settings for your preferred market, can be found here below:
This is a premium indicator , so send me a private message in order to get access to this script .
[astropark] Super Stochastic RSI [strategy]Dear Followers,
today a new Scalper Tool , which works great on 3 minutes and 5 minutes timeframes !
I called it " Super Stochastic RSI ", as it is based on StochRSI and inherits some basic functionality from it.
If you check its settings, you will see that you can have 3 different buy-sell sources (first two are active by default):
STRONG BUY/SELL : buy when green area deeply falls into oversold zone and sell when red area gets into overbought zone (you can set and edit at which level oversold and overbought zones start);
K/D CROSSES : buy when k-line cross above d-line and sell viceversa (you can set and edit specific cross ranges for both buy and sell);
WEAK BUY/SELL : buy when green area at least go below 50 level and sell when red area at least goes above 50 level (you can edit both levels); these conditions are highlighted as background color and are very useful for taking (at least partial) profits in trades.
By default the script will be placed as oscillator on a specific pane below the chart, but
> you can disable the oscillator plot by enabling the "hide all plot" option
> and place it as overlay on chart by clicking on the black arrow at then end on the indicator name in chart and selecting "move to -> existing pane above"
This strategy can trigger till 10 buy or 10 sell signals in a row before reverting, so use a proper money management .
Strategy results are calculated on 20 trading days using 1000$ as initial capital and working at 10x leverage.
The user who wants to use this strategy, especially via an automated bot, must always set a stoploss at 3-5% from entry point or use a proper risk management strategy .
This is not the "Holy Grail", so use it with caution.
This script will let you backtest the strategy and find best settings for your preferred market.
The alarms script version of this indicator, which will let you set all notifications you may need in order to be alerted on each triggered signals, can be found here below:
This is a premium indicator , so send me a private message in order to get access to this script .